Metrics are measurements or data points that tell you what is happening. For example, the number of steps you walk each day, your heart rate, or the temperature outside—these are all metrics.
Monitoring is the process of keeping an eye on these metrics over time to understand what’s normal, identify changes, and detect problems. It's like watching your step count daily to see if you're meeting your fitness goal or checking your heart rate to make sure it's in a healthy range.
- Prometheus is an open-source systems monitoring and alerting toolkit originally built at SoundCloud.
- It is known for its robust data model, powerful query language (PromQL), and the ability to generate alerts based on the collected time-series data.
- It can be configured and set up on both bare-metal servers and container environments like Kubernetes.
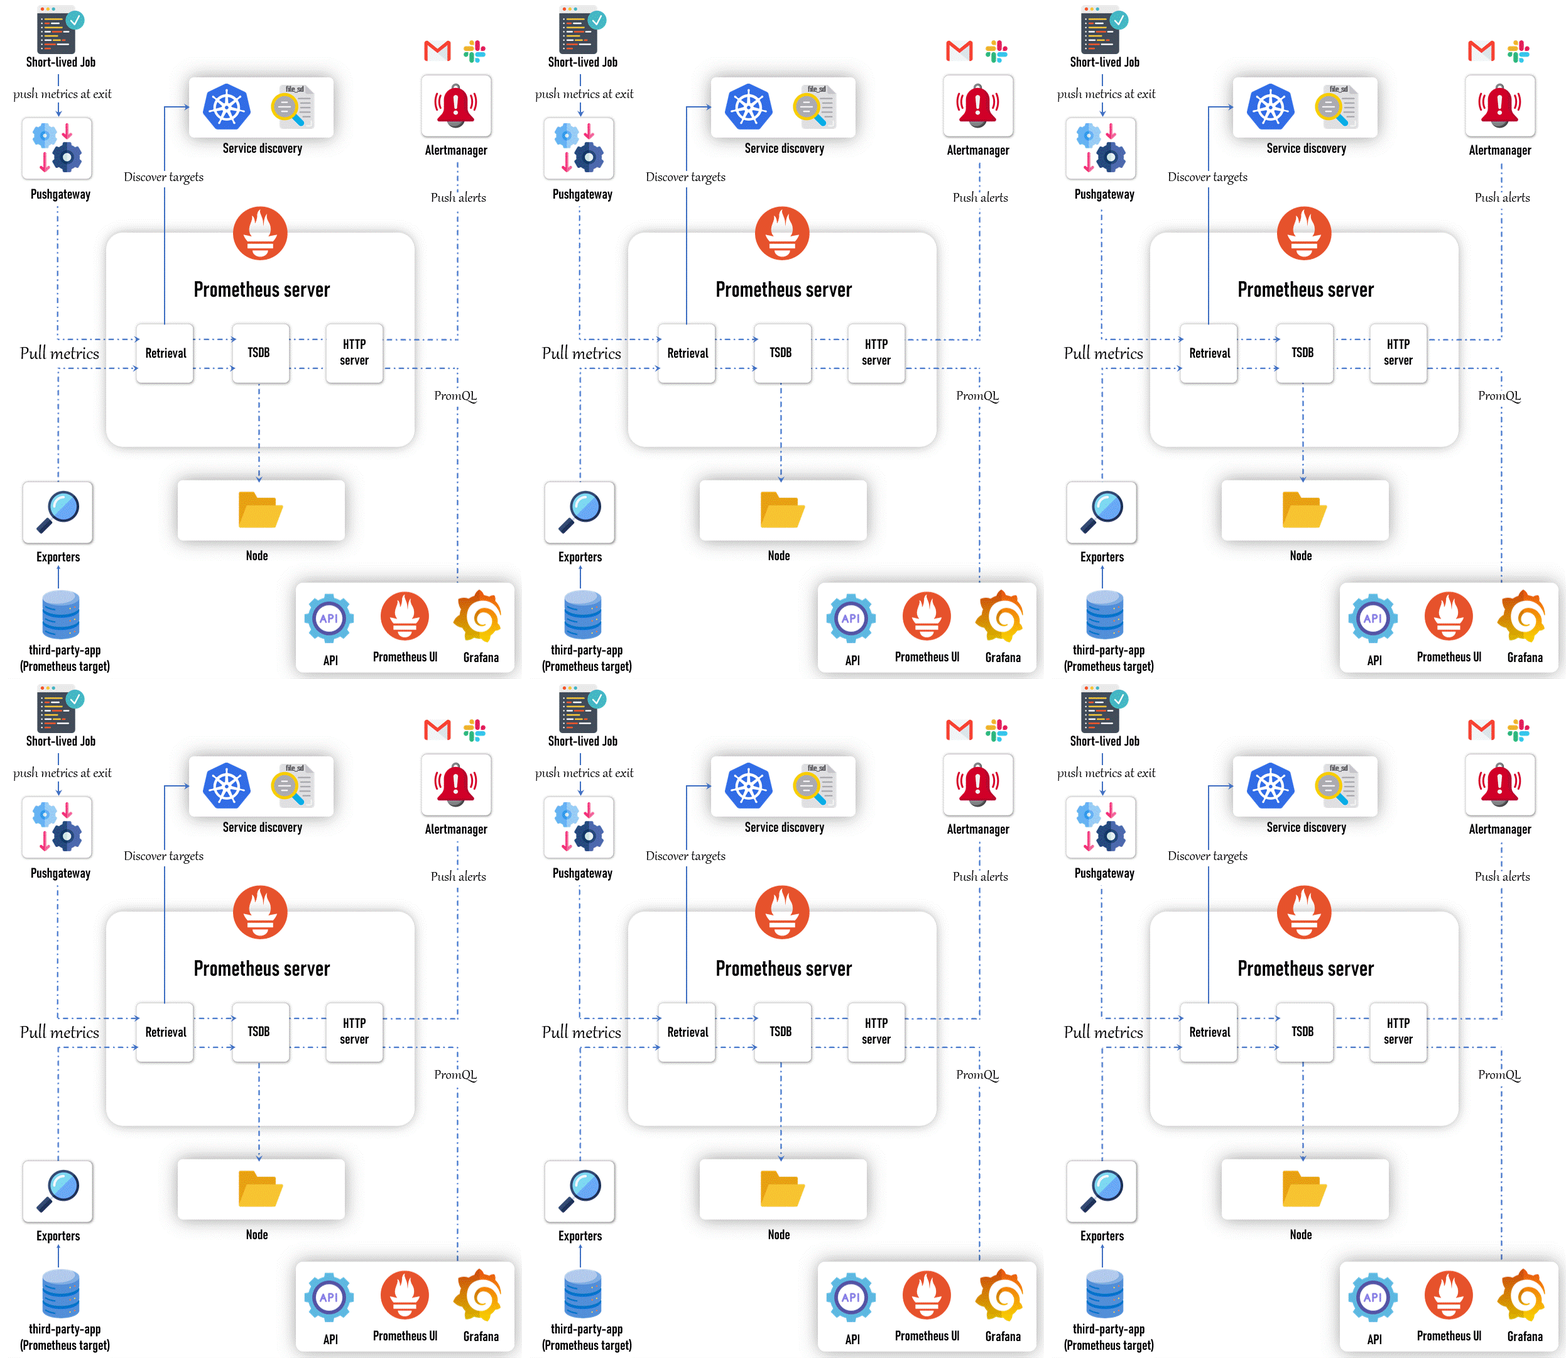
- The architecture of Prometheus is designed to be highly flexible, scalable, and modular.
- It consists of several core components, each responsible for a specific aspect of the monitoring process.
- Prometheus server is the core of the monitoring system. It is responsible for scraping metrics from various configured targets, storing them in its time-series database (TSDB), and serving queries through its HTTP API.
- Components:
- Retrieval: This module handles the scraping of metrics from endpoints, which are discovered either through static configurations or dynamic service discovery methods.
- TSDB (Time Series Database): The data scraped from targets is stored in the TSDB, which is designed to handle high volumes of time-series data efficiently.
- HTTP Server: This provides an API for querying data using PromQL, retrieving metadata, and interacting with other components of the Prometheus ecosystem.
- Storage: The scraped data is stored on local disk (HDD/SSD) in a format optimized for time-series data.
- Service discovery automatically identifies and manages the list of scrape targets (i.e., services or applications) that Prometheus monitors.
- This is crucial in dynamic environments like Kubernetes where services are constantly being created and destroyed.
- Components:
- Kubernetes: In Kubernetes environments, Prometheus can automatically discover services, pods, and nodes using Kubernetes API, ensuring it monitors the most up-to-date list of targets.
- File SD (Service Discovery): Prometheus can also read static target configurations from files, allowing for flexibility in environments where dynamic service discovery is not used.
- The Pushgateway is used to expose metrics from short-lived jobs or applications that cannot be scraped directly by Prometheus.
- These jobs push their metrics to the Pushgateway, which then makes them available for Prometheus to scrape(pull).
- Use Case:
- It's particularly useful for batch jobs or tasks that have a limited lifespan and would otherwise not have their metrics collected.
- The Alertmanager is responsible for managing alerts generated by the Prometheus server.
- It takes care of deduplicating, grouping, and routing alerts to the appropriate notification channels such as PagerDuty, email, or Slack.
- Exporters are small applications that collect metrics from various third-party systems and expose them in a format Prometheus can scrape. They are essential for monitoring systems that do not natively support Prometheus.
- Types of Exporters:
- Common exporters include the Node Exporter (for hardware metrics), the MySQL Exporter (for database metrics), and various other application-specific exporters.
- The Prometheus Web UI allows users to explore the collected metrics data, run ad-hoc PromQL queries, and visualize the results directly within Prometheus.
- Grafana is a powerful dashboard and visualization tool that integrates with Prometheus to provide rich, customizable visualizations of the metrics data.
- API clients interact with Prometheus through its HTTP API to fetch data, query metrics, and integrate Prometheus with other systems or custom applications.
- Download and Install AWS Cli - Please Refer this link.
- Setup and configure AWS CLI using the
aws configurecommand. - Install and configure eksctl using the steps mentioned here.
- Install and configure kubectl as mentioned here.
eksctl create cluster --name=observability \
                      --region=us-east-1 \
                      --zones=us-east-1a,us-east-1b \
                      --without-nodegroup
eksctl utils associate-iam-oidc-provider \
--region us-east-1 \
--cluster observability \
--approveeksctl create nodegroup --cluster=observability \
--region=us-east-1 \
--name=observability-ng-private \
--node-type=t3.medium \
--nodes-min=2 \
--nodes-max=3 \
--node-volume-size=20 \
--managed \
--asg-access \
--external-dns-access \
--full-ecr-access \
--appmesh-access \
--alb-ingress-access \
--node-private-networking
# Update ./kube/config file
aws eks update-kubeconfig --name observabilityhelm repo add prometheus-community https://prometheus-community.github.io/helm-charts
helm repo updatekubectl create ns monitoringcd day-2
helm install monitoring prometheus-community/kube-prometheus-stack \
-n monitoring \
-f ./custom_kube_prometheus_stack.ymlkubectl get all -n monitoring- Prometheus UI:
kubectl port-forward service/prometheus-operated -n monitoring 9090:9090NOTE: If you are using an EC2 Instance or Cloud VM, you need to pass --address 0.0.0.0 to the above command. Then you can access the UI on instance-ip:port
- Grafana UI: password is
prom-operator
kubectl port-forward service/monitoring-grafana -n monitoring 8080:80- Alertmanager UI:
kubectl port-forward service/alertmanager-operated -n monitoring 9093:9093- Uninstall helm chart:
helm uninstall monitoring --namespace monitoring- Delete namespace:
kubectl delete ns monitoring- Delete Cluster & everything else:
eksctl delete cluster --name observability