--8<-- "snippets/bizevent-run-demo.js"
!!! note "Expect No Traffic in Dynatrace"
You won't see these values (or any traffic in Dynatrace) by default
because the load test is hitting example.com
If you have a service instrumented with OneAgent or OpenTelemetry, modify `example.jmx` to hit your URL instead to see traffic.
Open jmeterscripts/example.jmx{target=_blank} and notice a few things:
- The load test calls
example.comand specifies anx-dynatrace-testheaders with these values:
SI=jmeter;LSN=Scenario1;TSN=Step1;LTN=Demo LoadTest 1
These values help arrange and organize your load testing across multiple scenarios, steps and load test names.
The definition of these values (and additional values) can be found here{target=_blank}.
A tearDown thread group exists (which fires at the end of the load test)
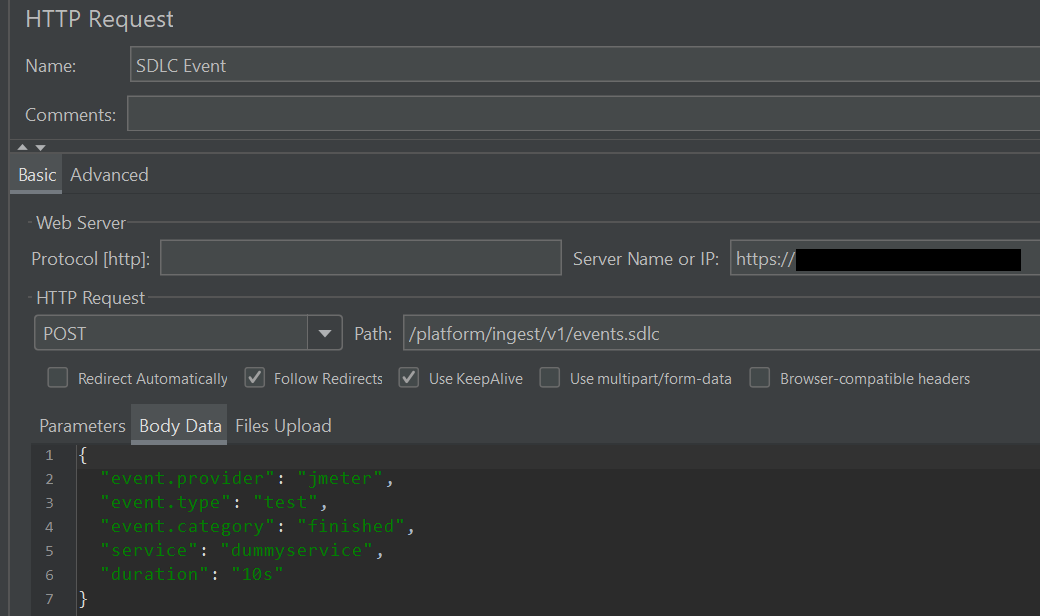
- This request is a
POSTto/platform/ingest/v1/events.sdlcwith a JSON payload - The request has header values set for
Content-TypeandAuthorization
This event allows integration opportunitities into other Dynatrace functionality such as triggering workflows automatically at the end of a load test.
In the codespace terminal, paste the following:
/workspaces/$RepositoryName/apache-jmeter/bin/jmeter.sh -n -t /workspaces/$RepositoryName/jmeterscripts/example.jmx
When the load test finished, the teardown thread group{target=_blank} sends a Software Delivery Lifecycle Event (SDLC) to Dynatrace.
Notice that the event contains metadata such as the provider and service which can be used for filtering in Dynatrace (see DQL below).
This event can be used as a trigger Dynatrace for workflows, synthetic tests, the site reliability guardian and more.
In Dynatrace:
- Press
ctrl + kand search fornotebooks - Open an existing notebook or create a new one
- Add a new
DQLsection and paste the following
fetch events
| filter event.kind == "SDLC_EVENT"
| filter event.provider == "jmeter"
| filter event.category == "finished"
The demo is complete.

