Note
Watch the video "Getting Started with GreptimeDB: Ingestion by InfluxDB line protocol, Analysis with SQL and PromQL" for a living showcase.
Other dependencies can be installed by:
pip3 install -r requirements.txt- Obtain a free Greptime service from GreptimeCloud.
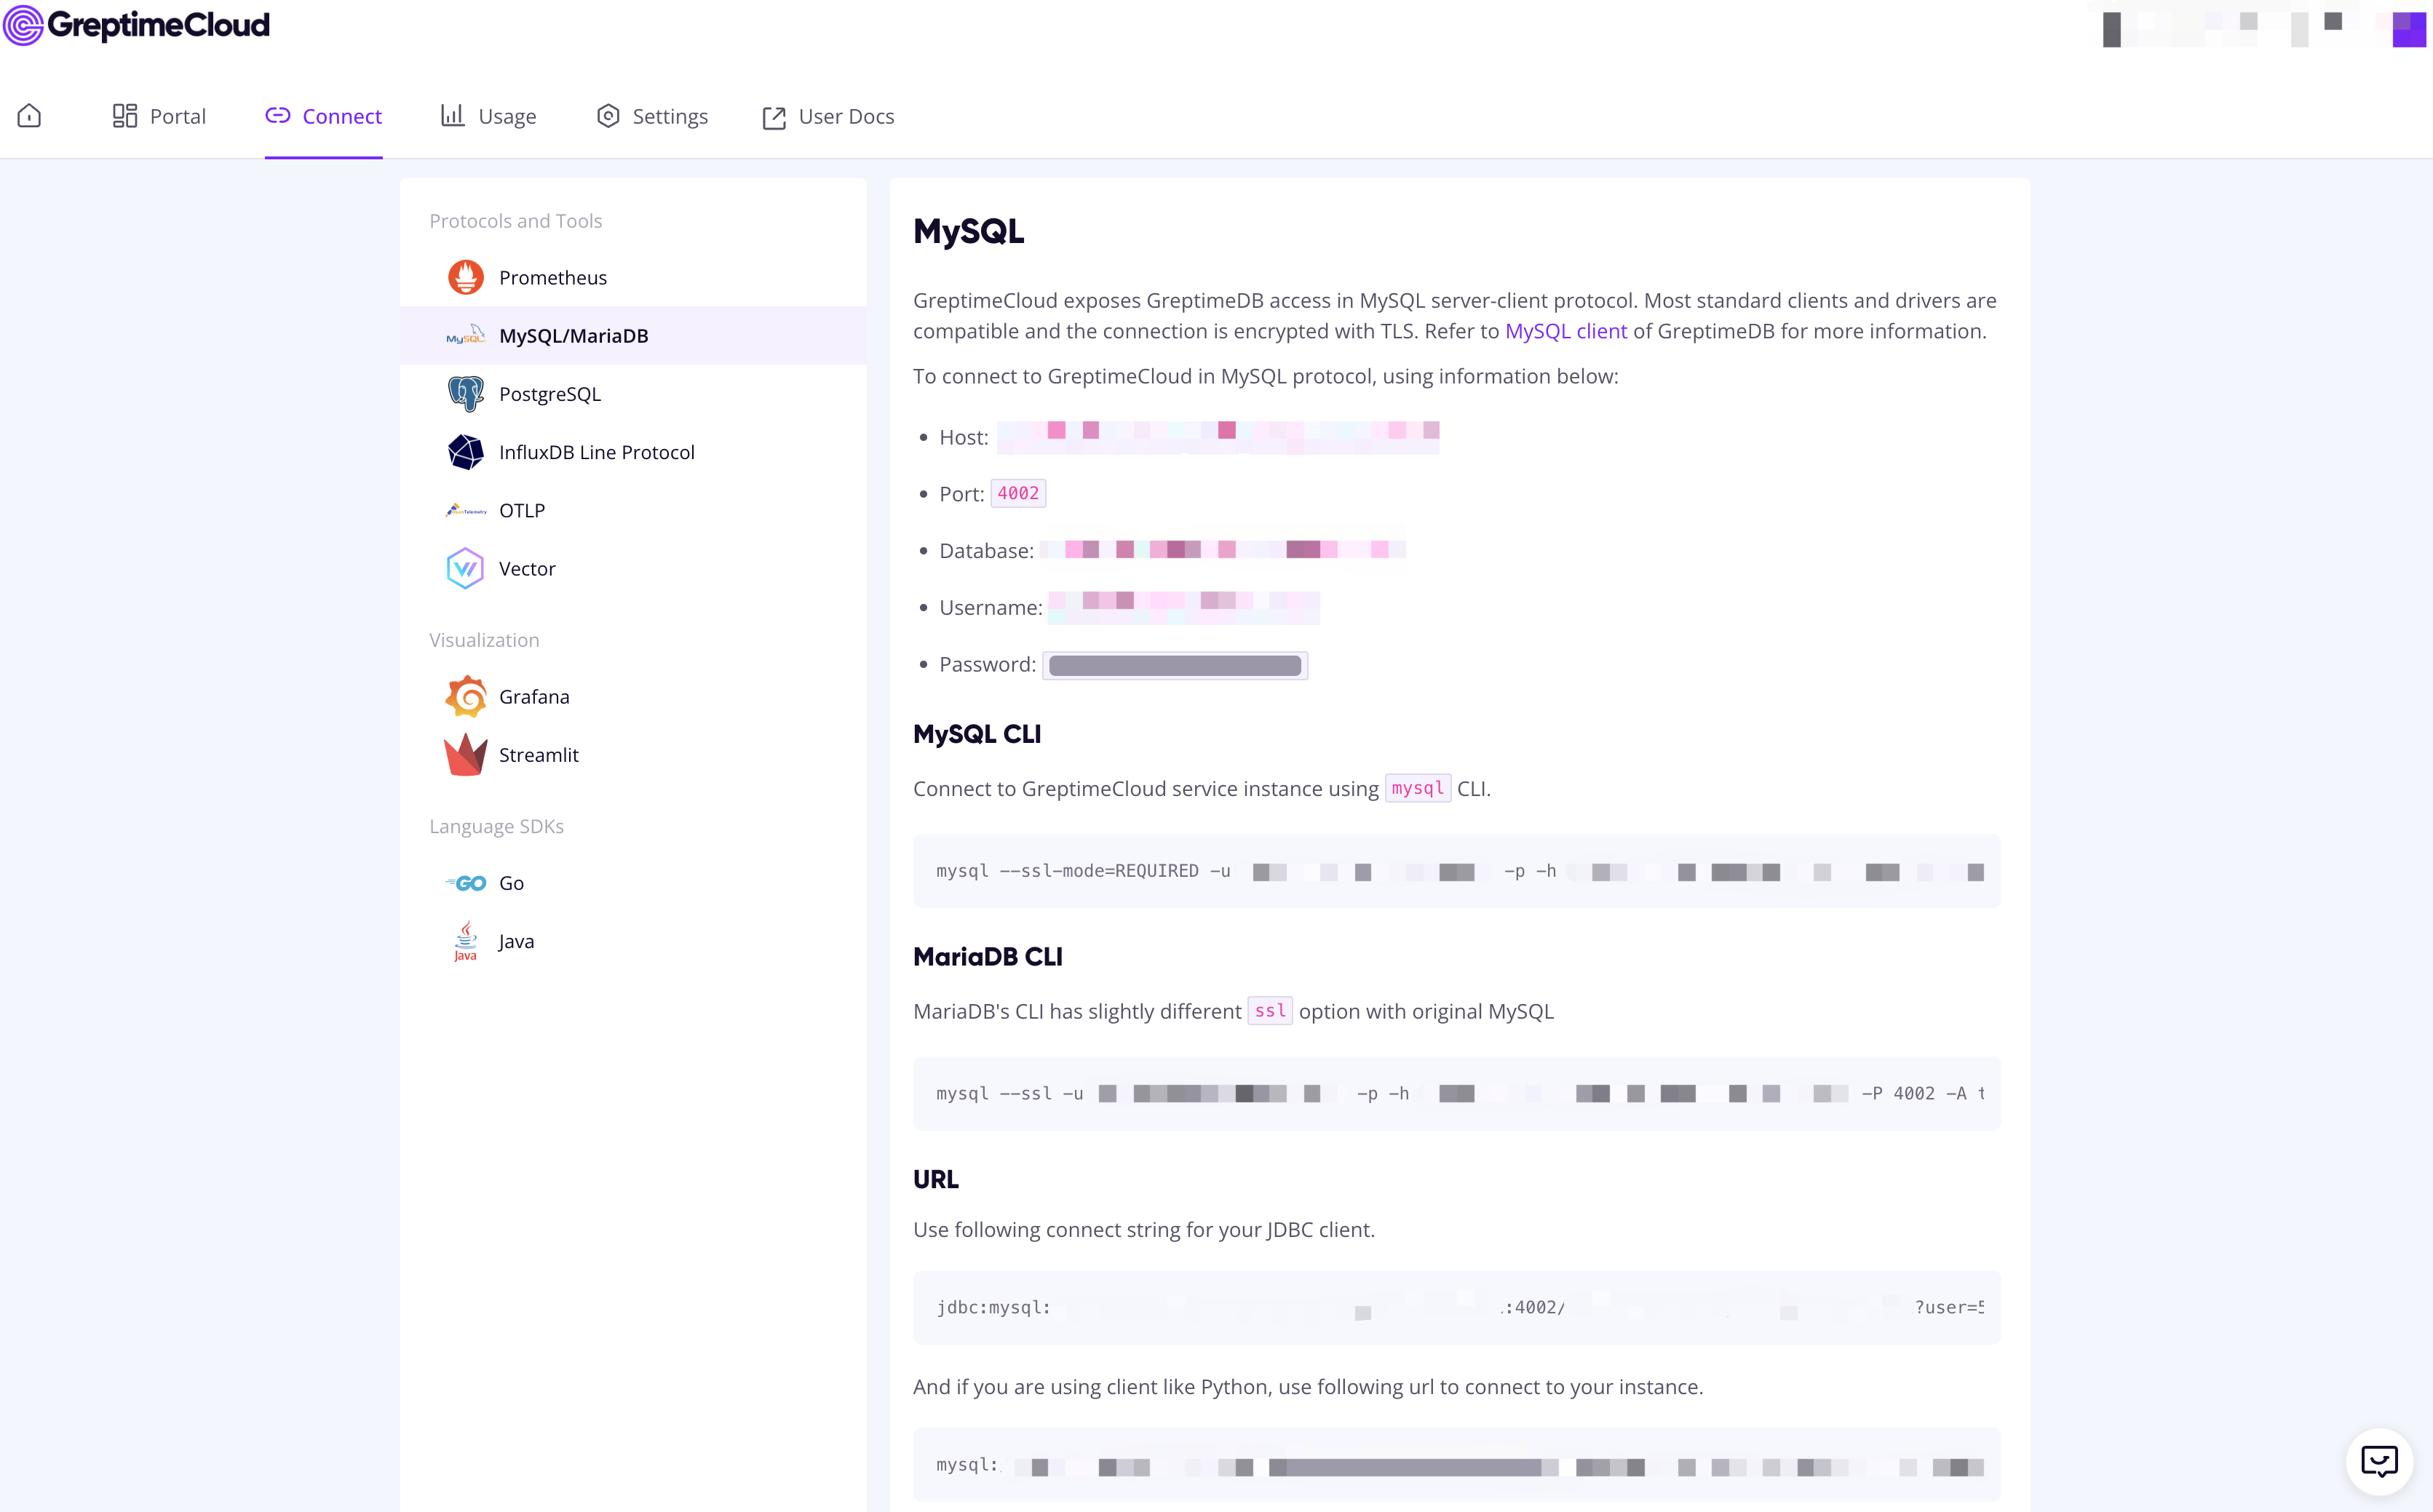
- Go to the "Connect" tab and find the connection string.
- Copy
.env.exampleto.envand set the connection string.
Download the sample data:
curl -O https://raw.githubusercontent.com/influxdata/influxdb2-sample-data/master/air-sensor-data/air-sensor-data.lp Tip
Use https://mirror.ghproxy.com/https://raw.githubusercontent.com/influxdata/influxdb2-sample-data/master/air-sensor-data/air-sensor-data.lp if you encounter network issues.
Ingest the air sensors data with:
python3 ingest.py air-sensor-data.lpThe script supports ingesting any data in line protocol format. You can specify the data file and timestamp precision:
$ python3 ingest.py --help
usage: ingest.py [-h] [--precision PRECISION] file

positional arguments:
  file                  File to ingest

options:
  -h, --help            show this help message and exit
  --precision PRECISION
                        Precision of the data (default: ns)
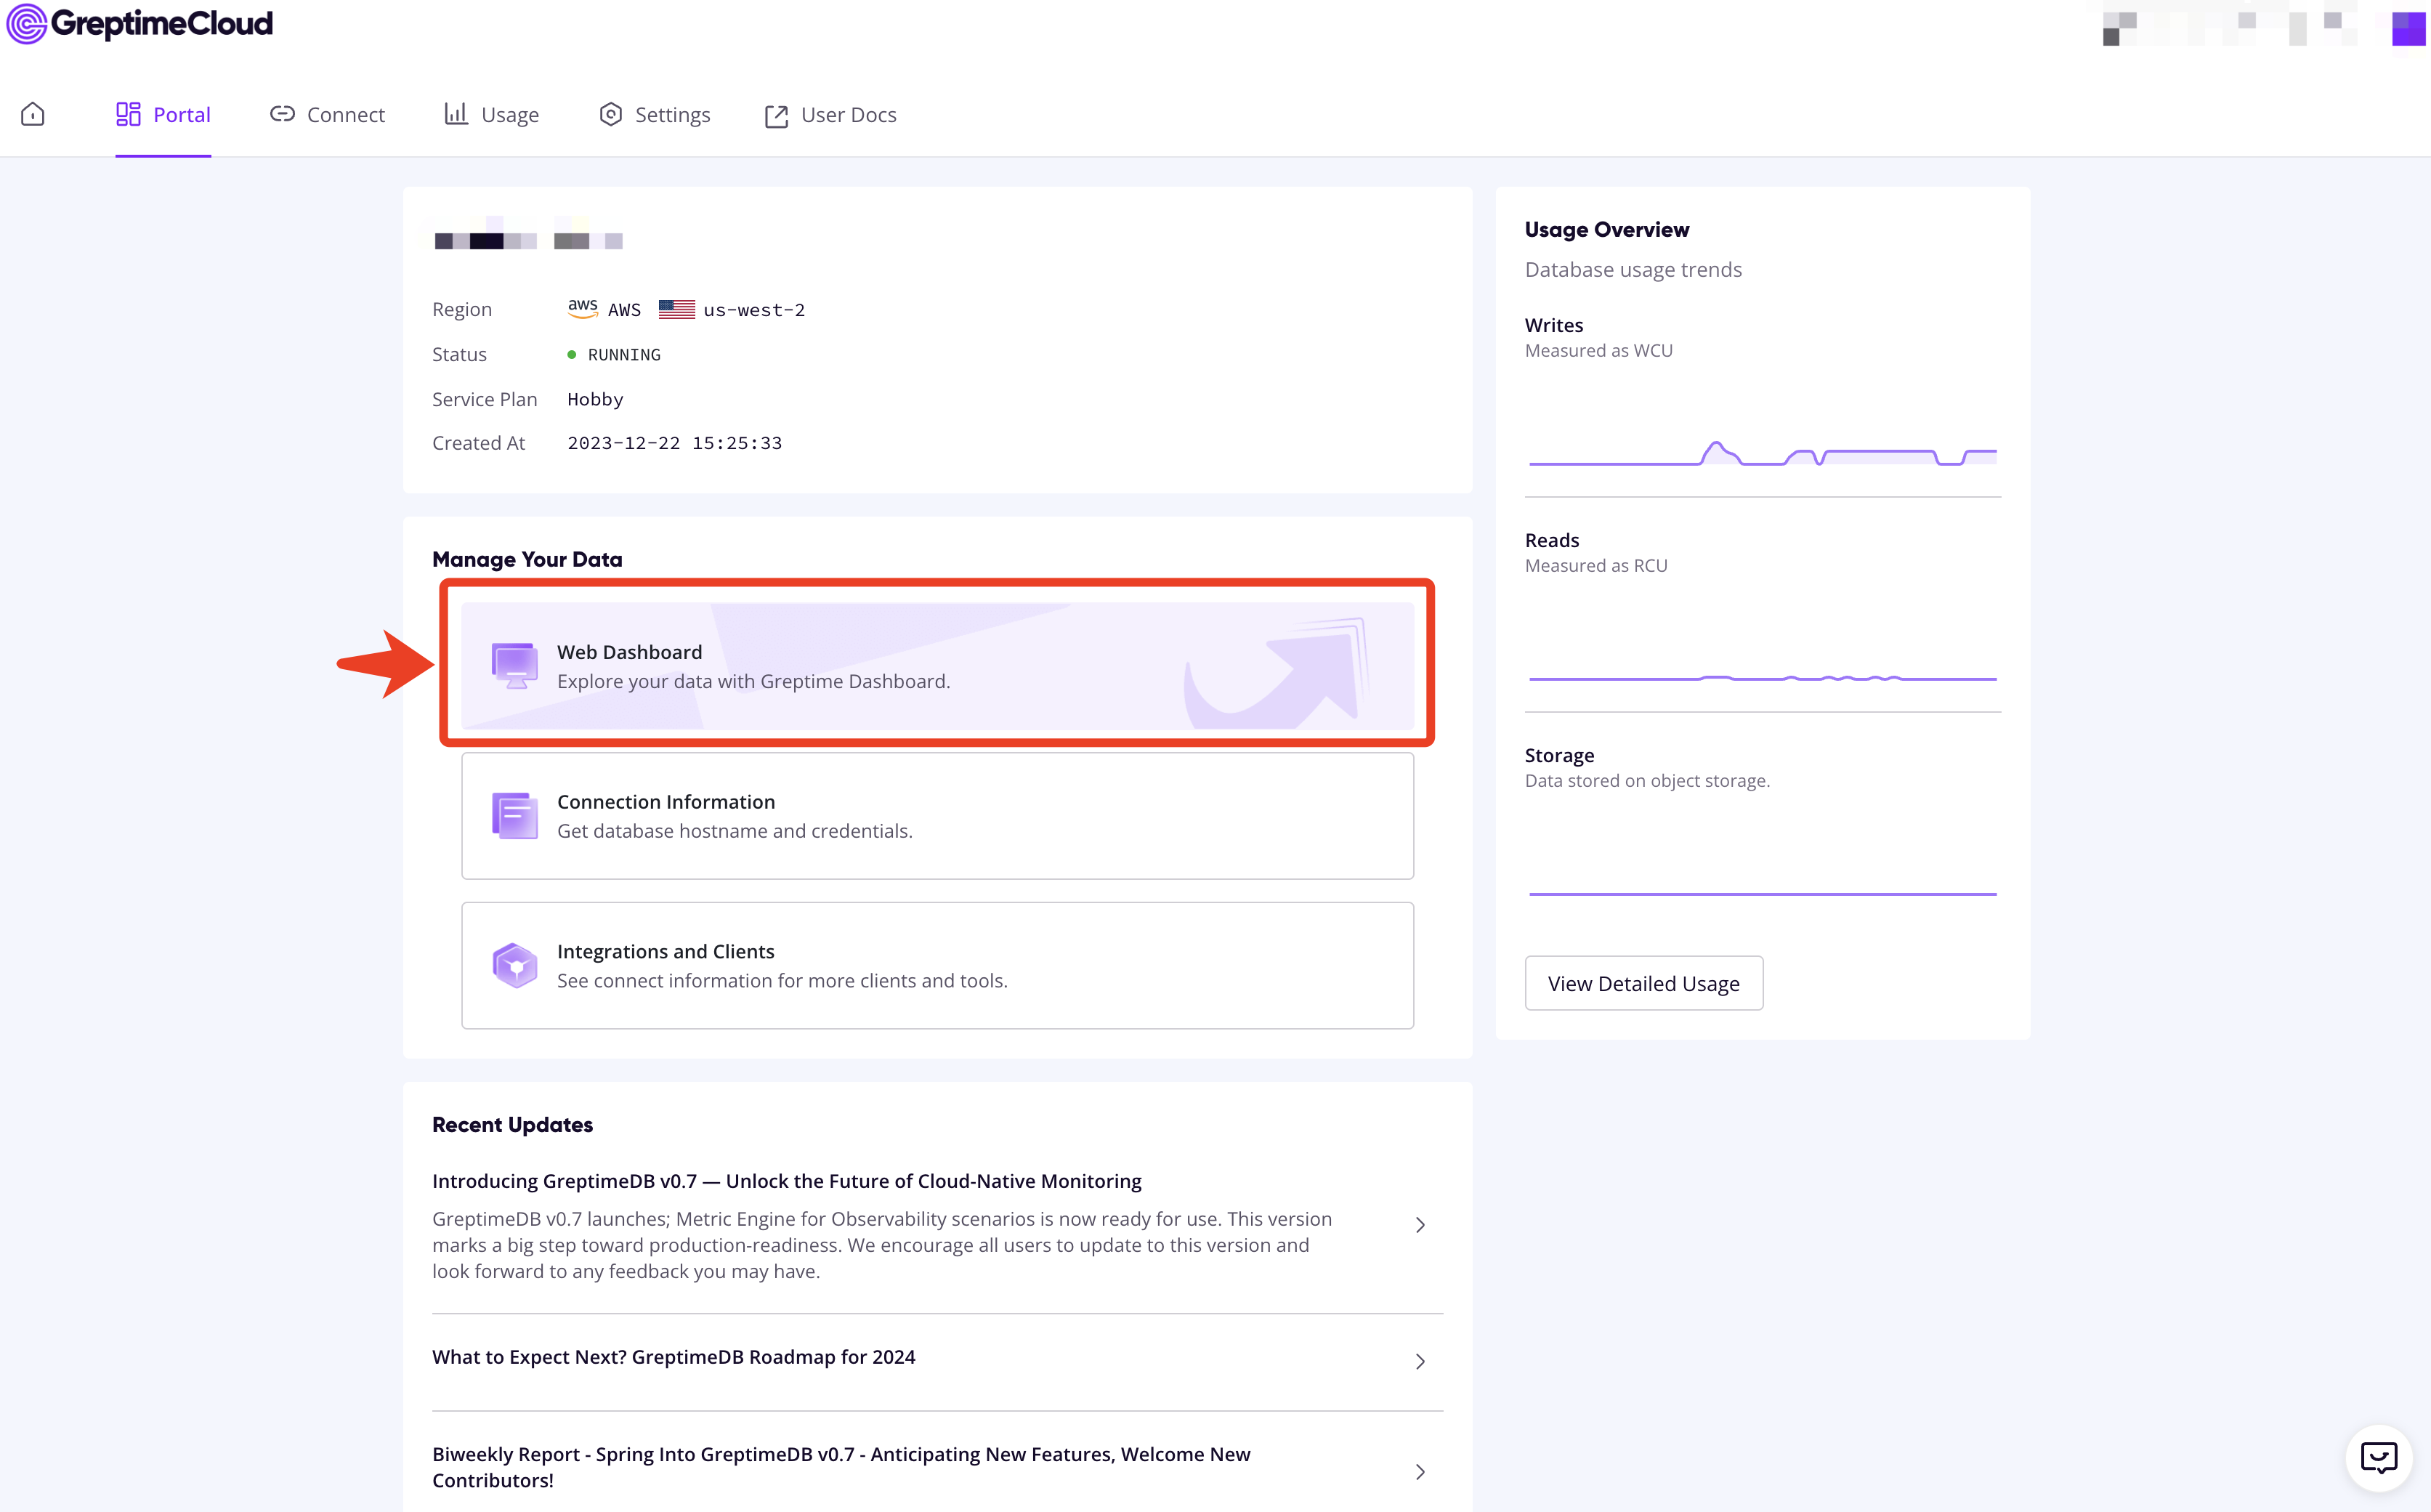
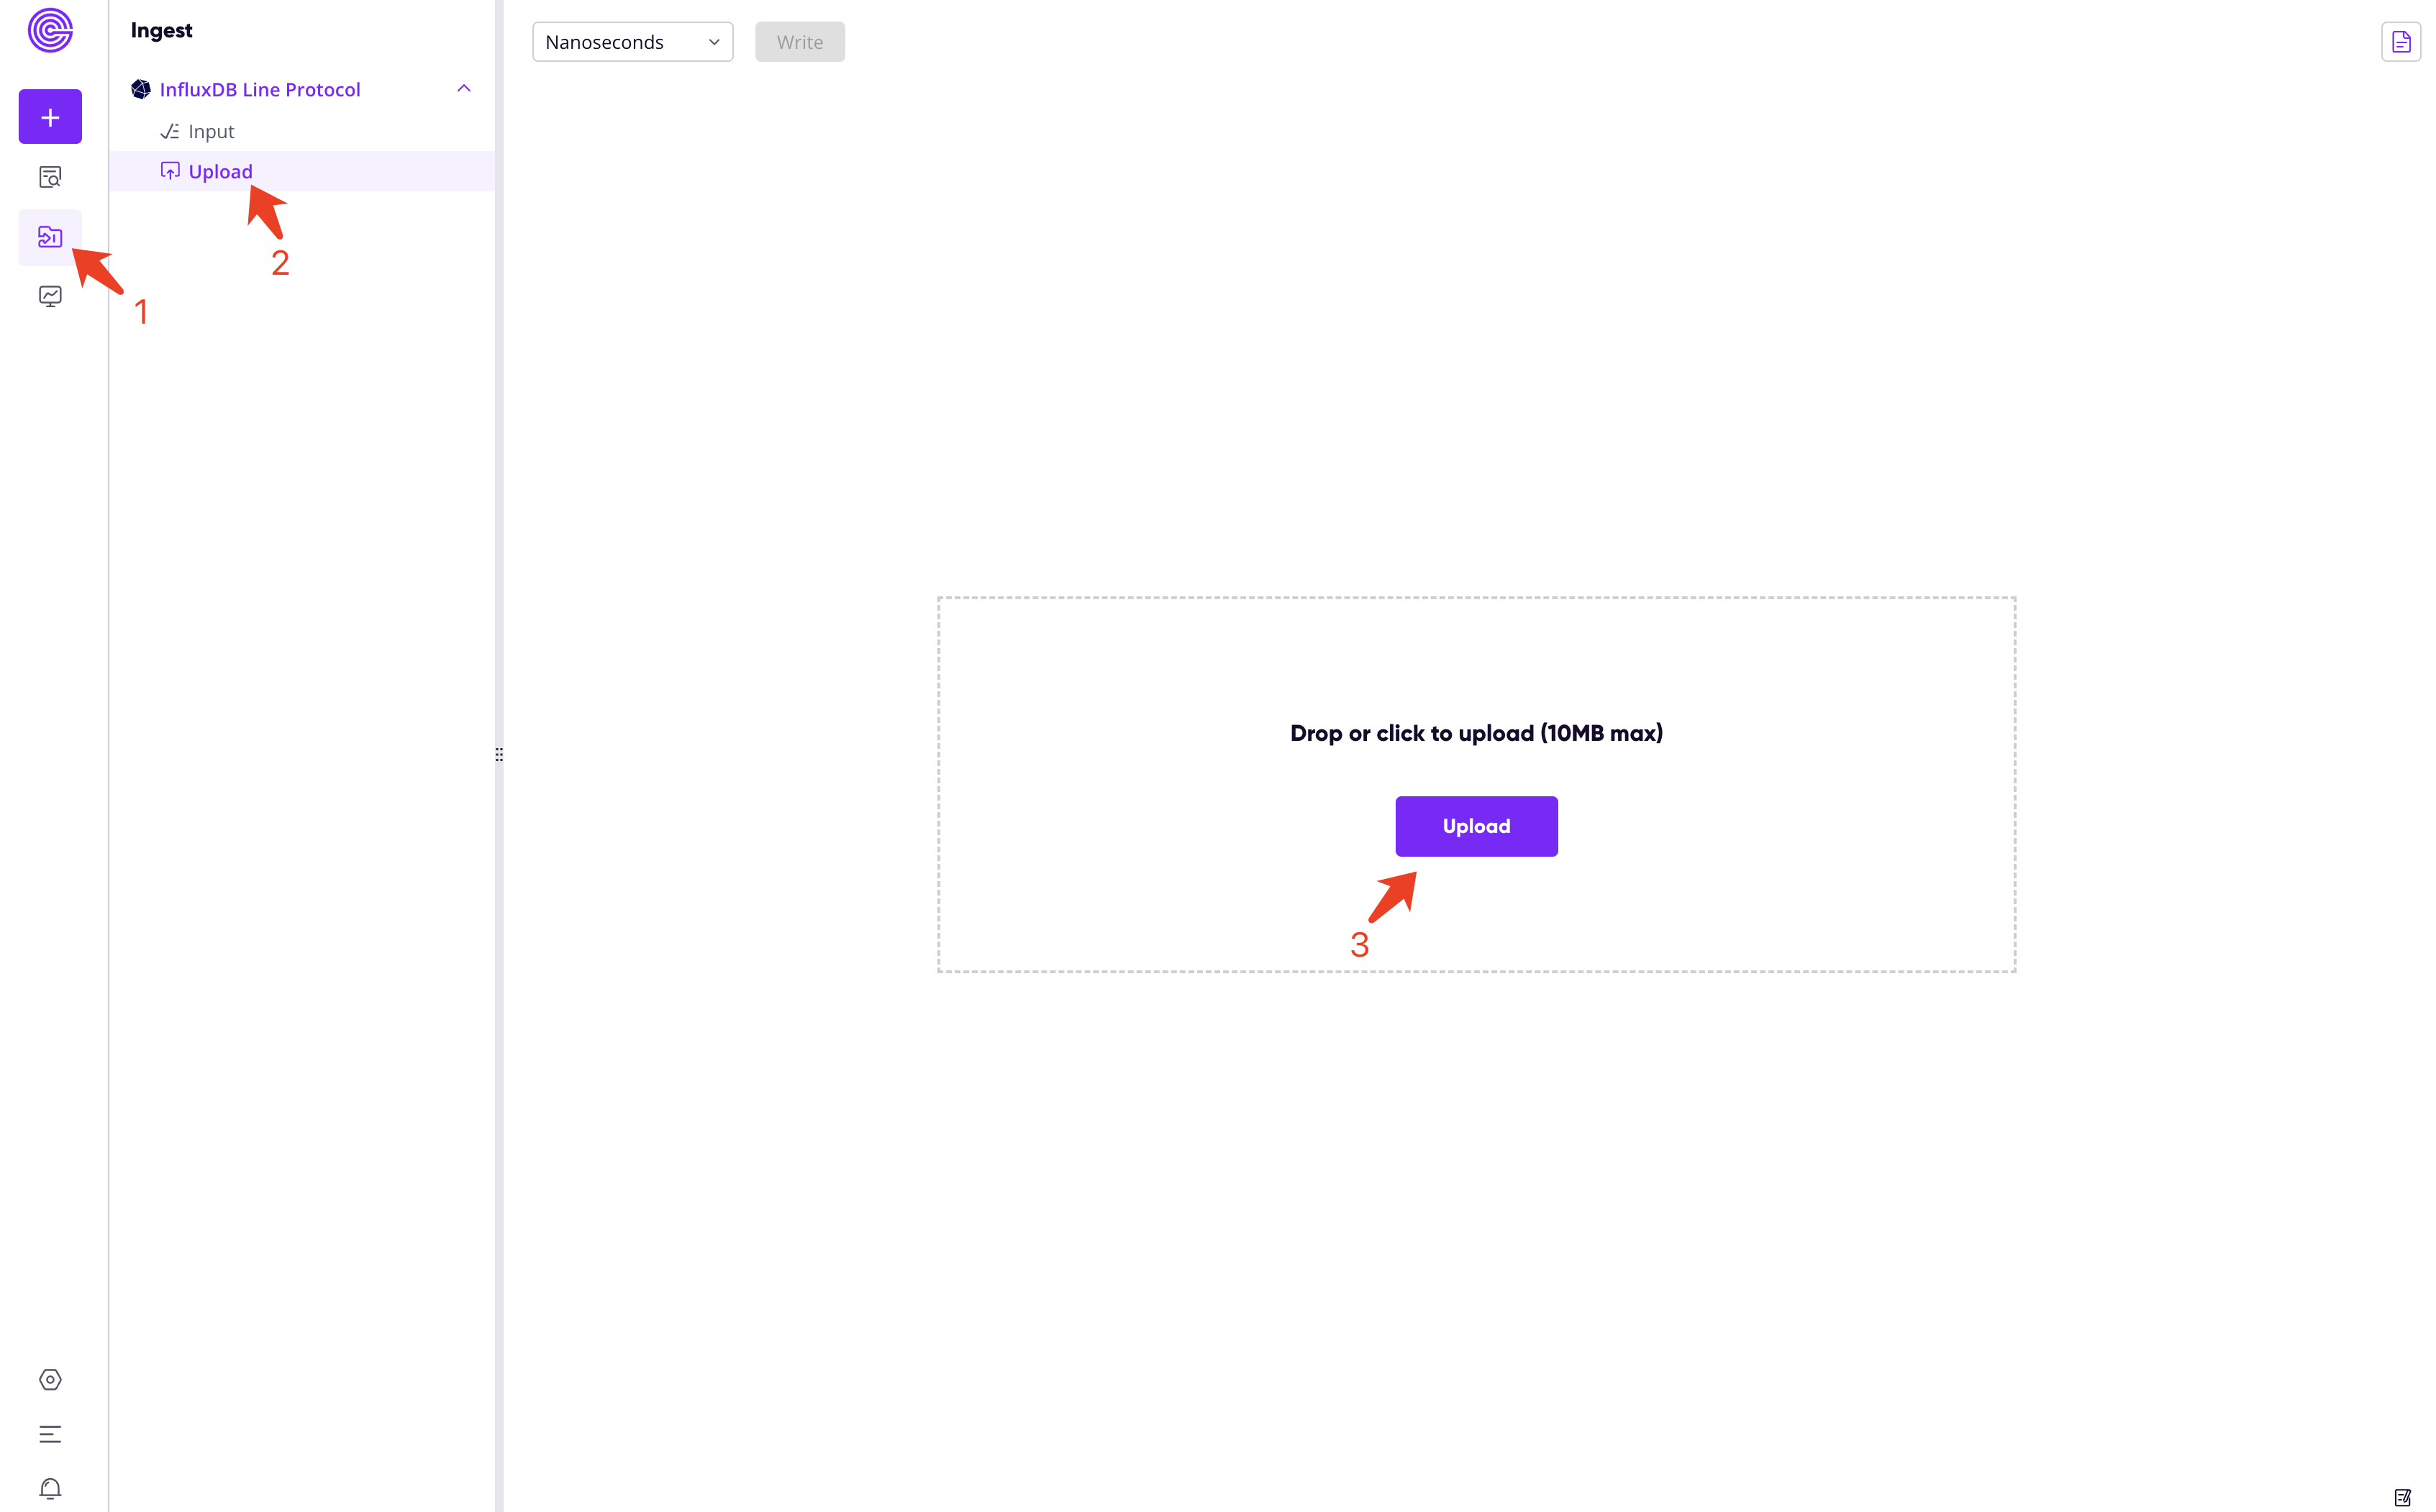
Instead, you can import the line protofol file via Web Dashboard.
Once file uploaded, click the "Write" button next to the precision box to ingest data. The line protocol file downloaded above is in nanoseconds (default), so we don't need to change the precision.
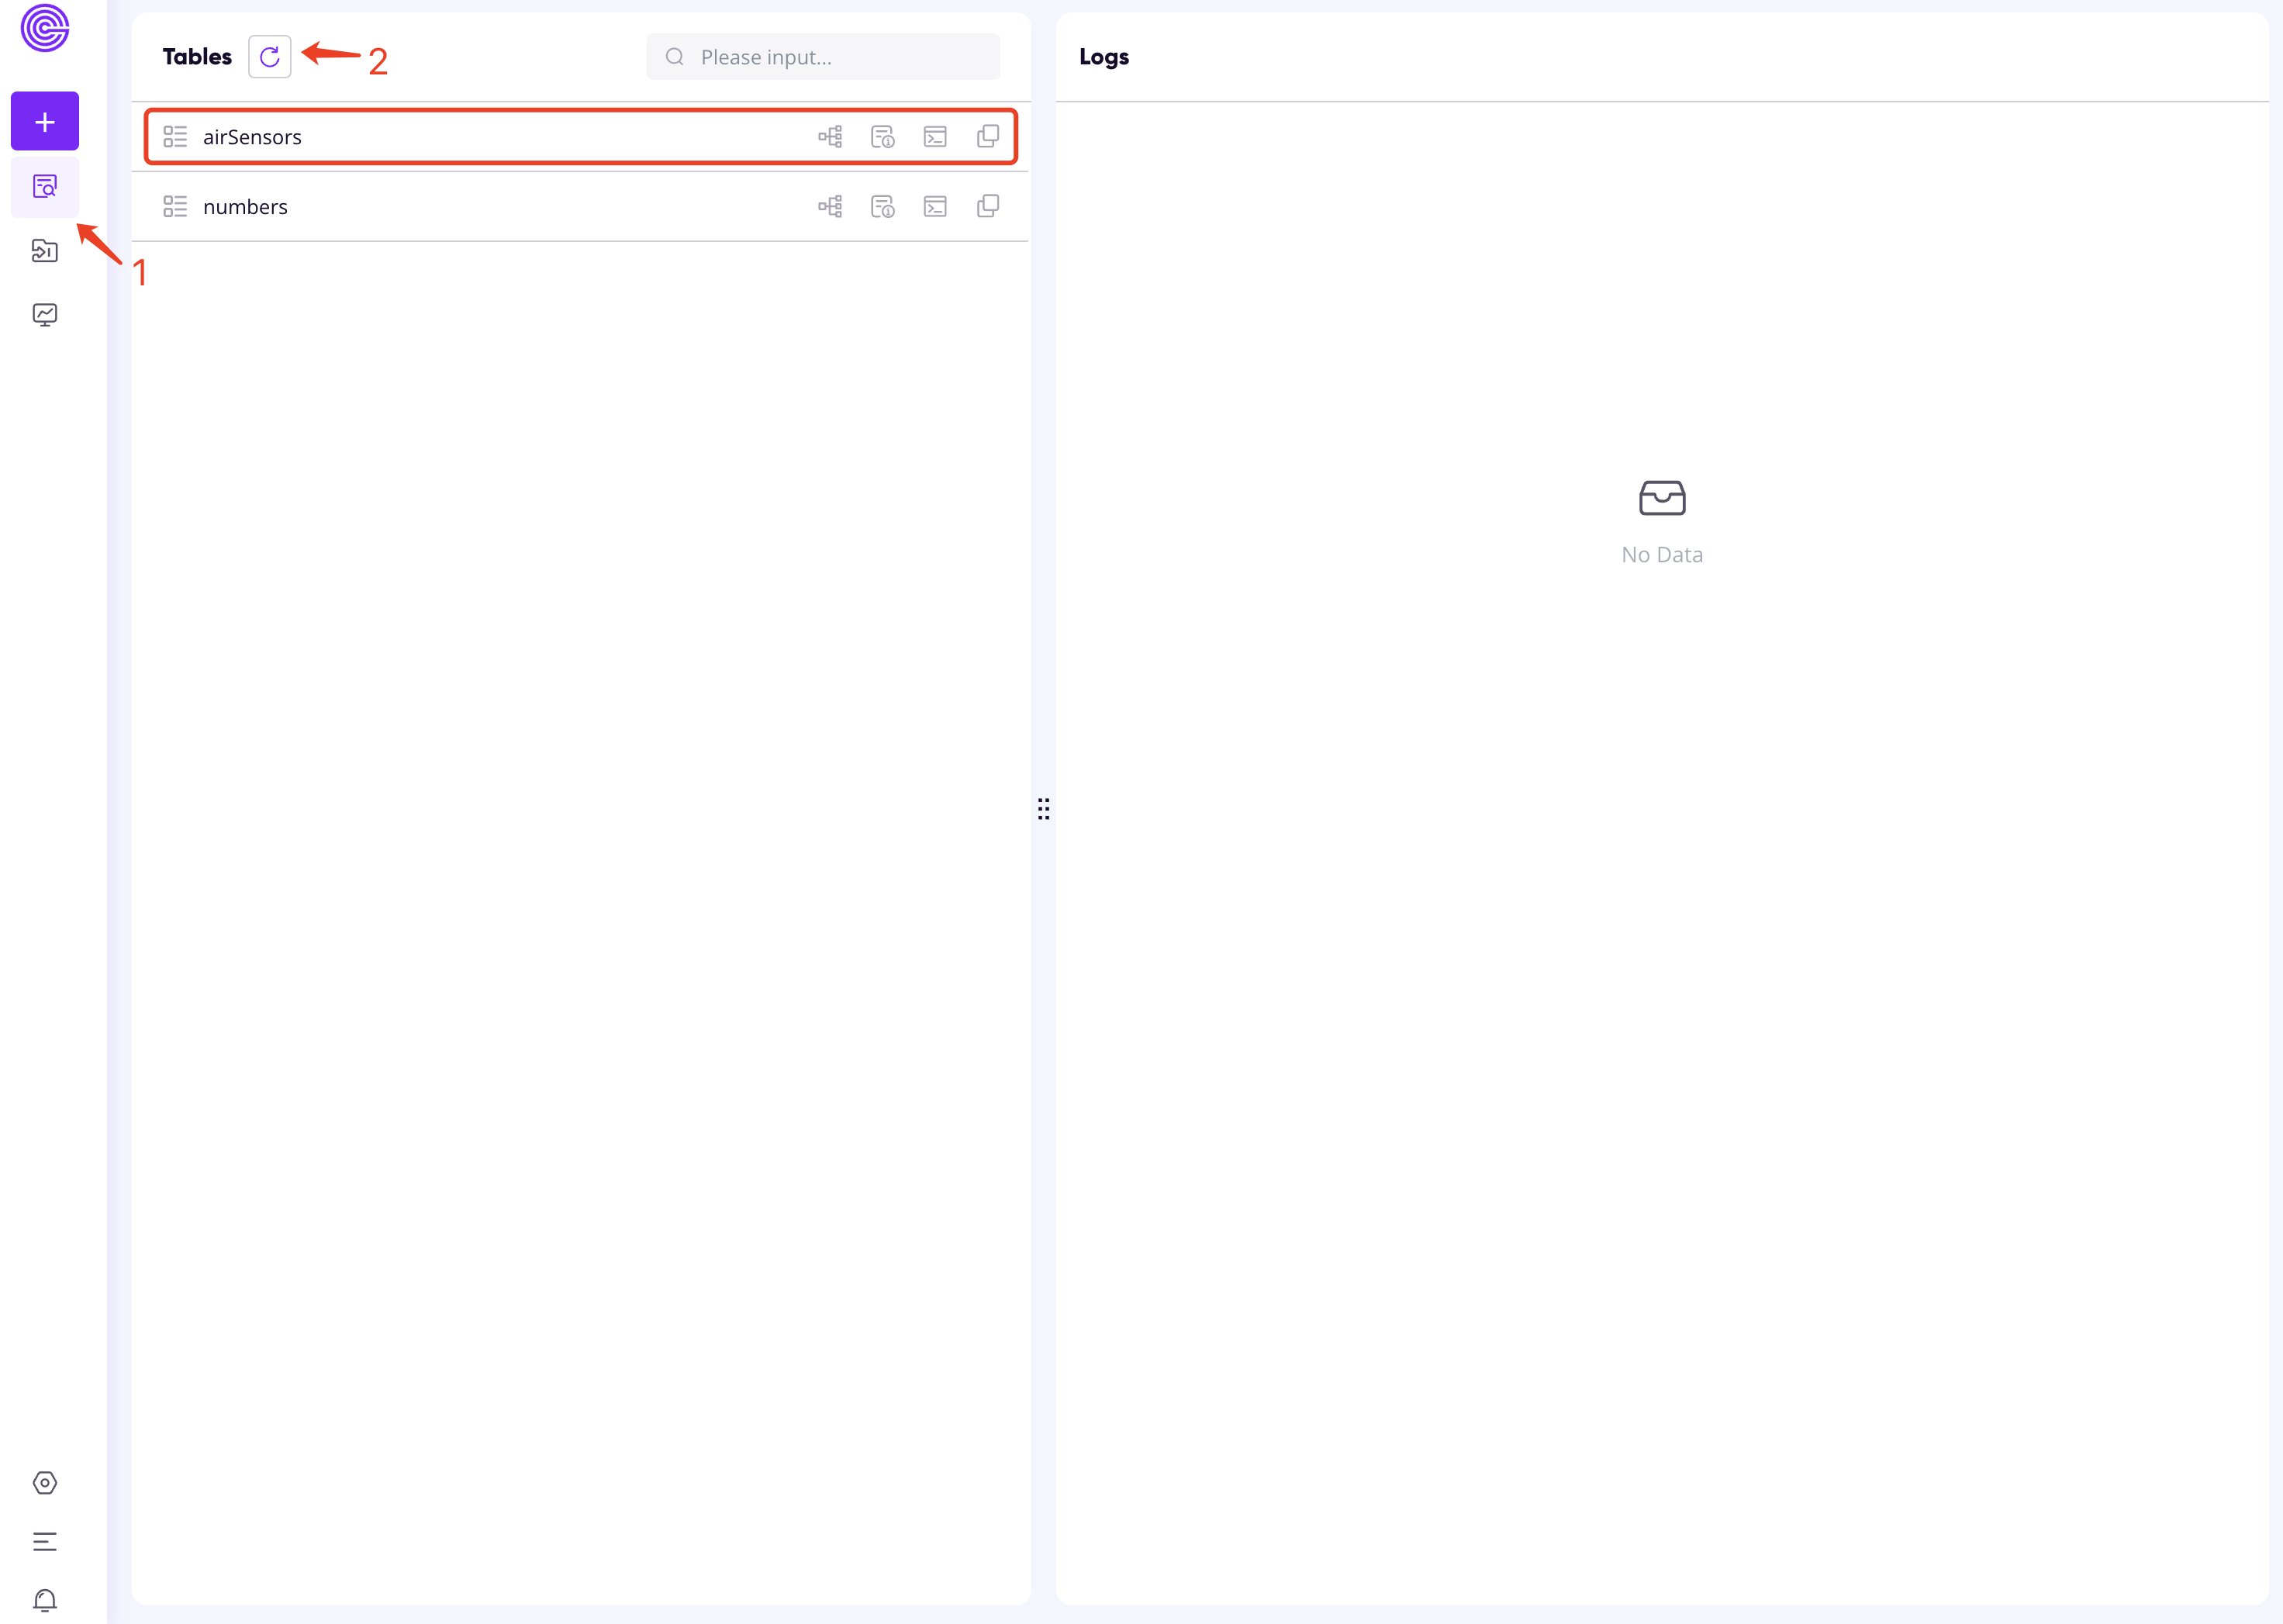
The data should be written immediately. Then you can go to the "Tables" tab, reload tables, and find the airSensors table.
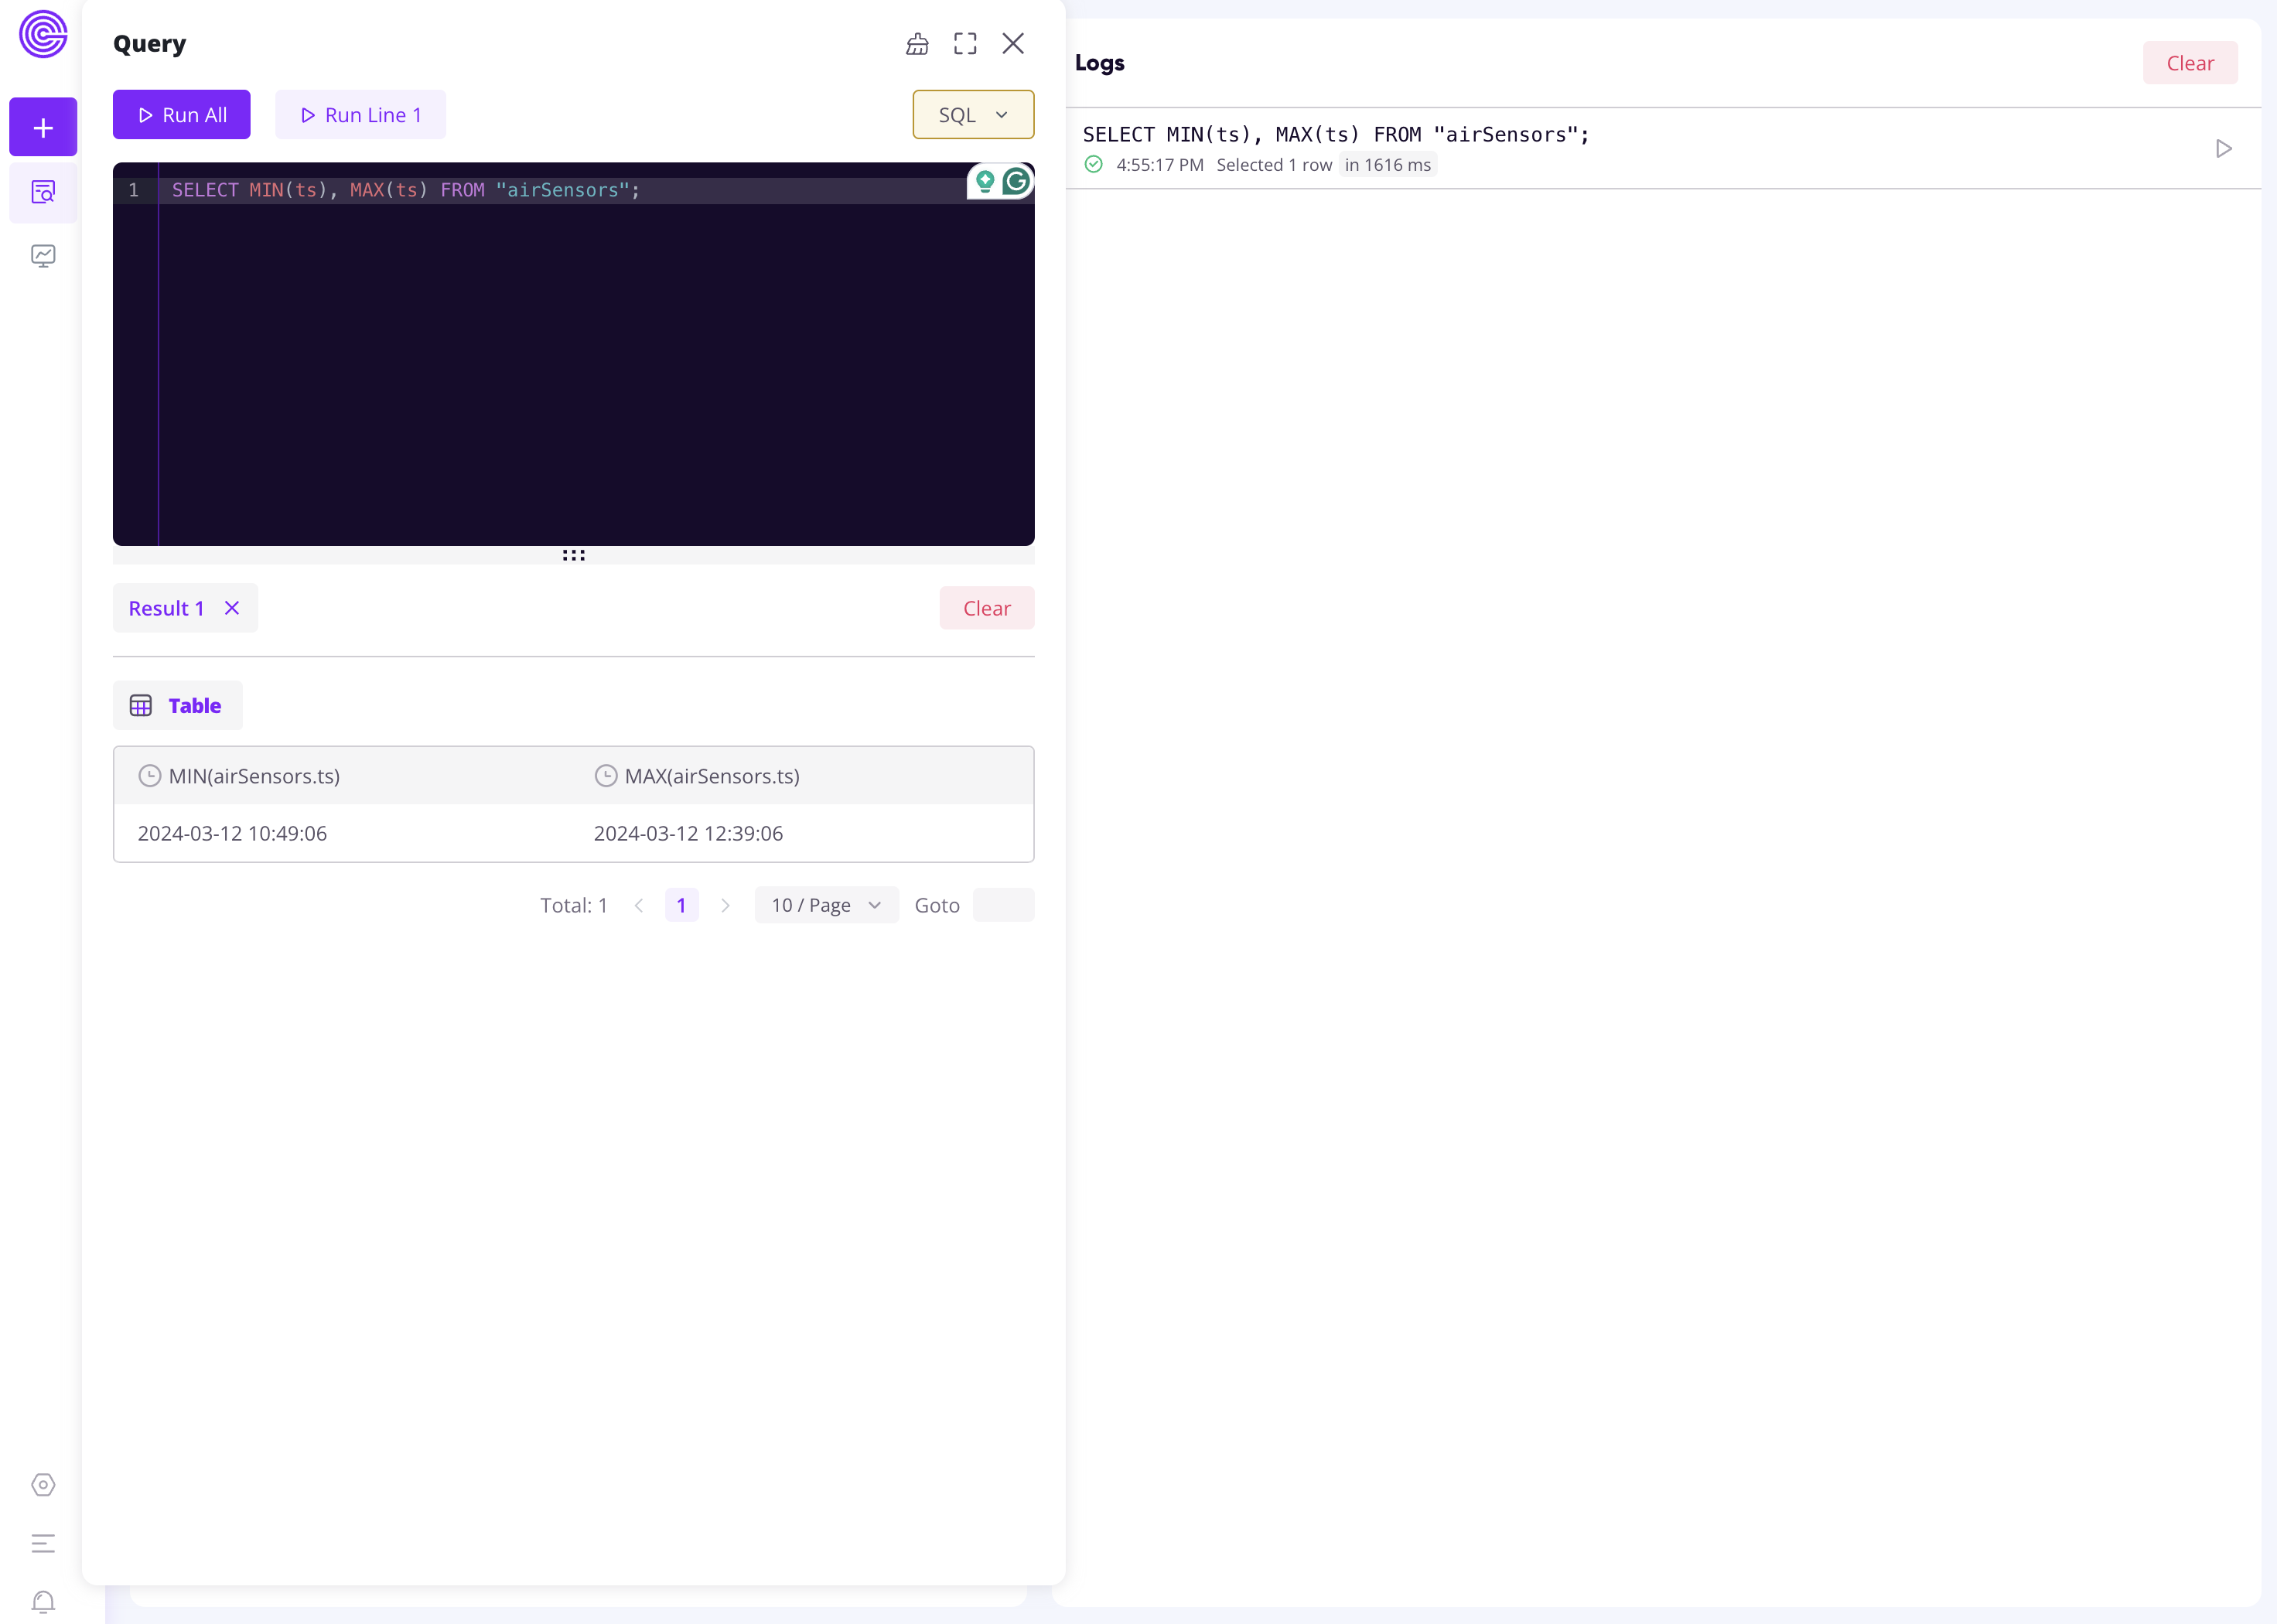
The following sample queries are executed from the Web Dashboard.
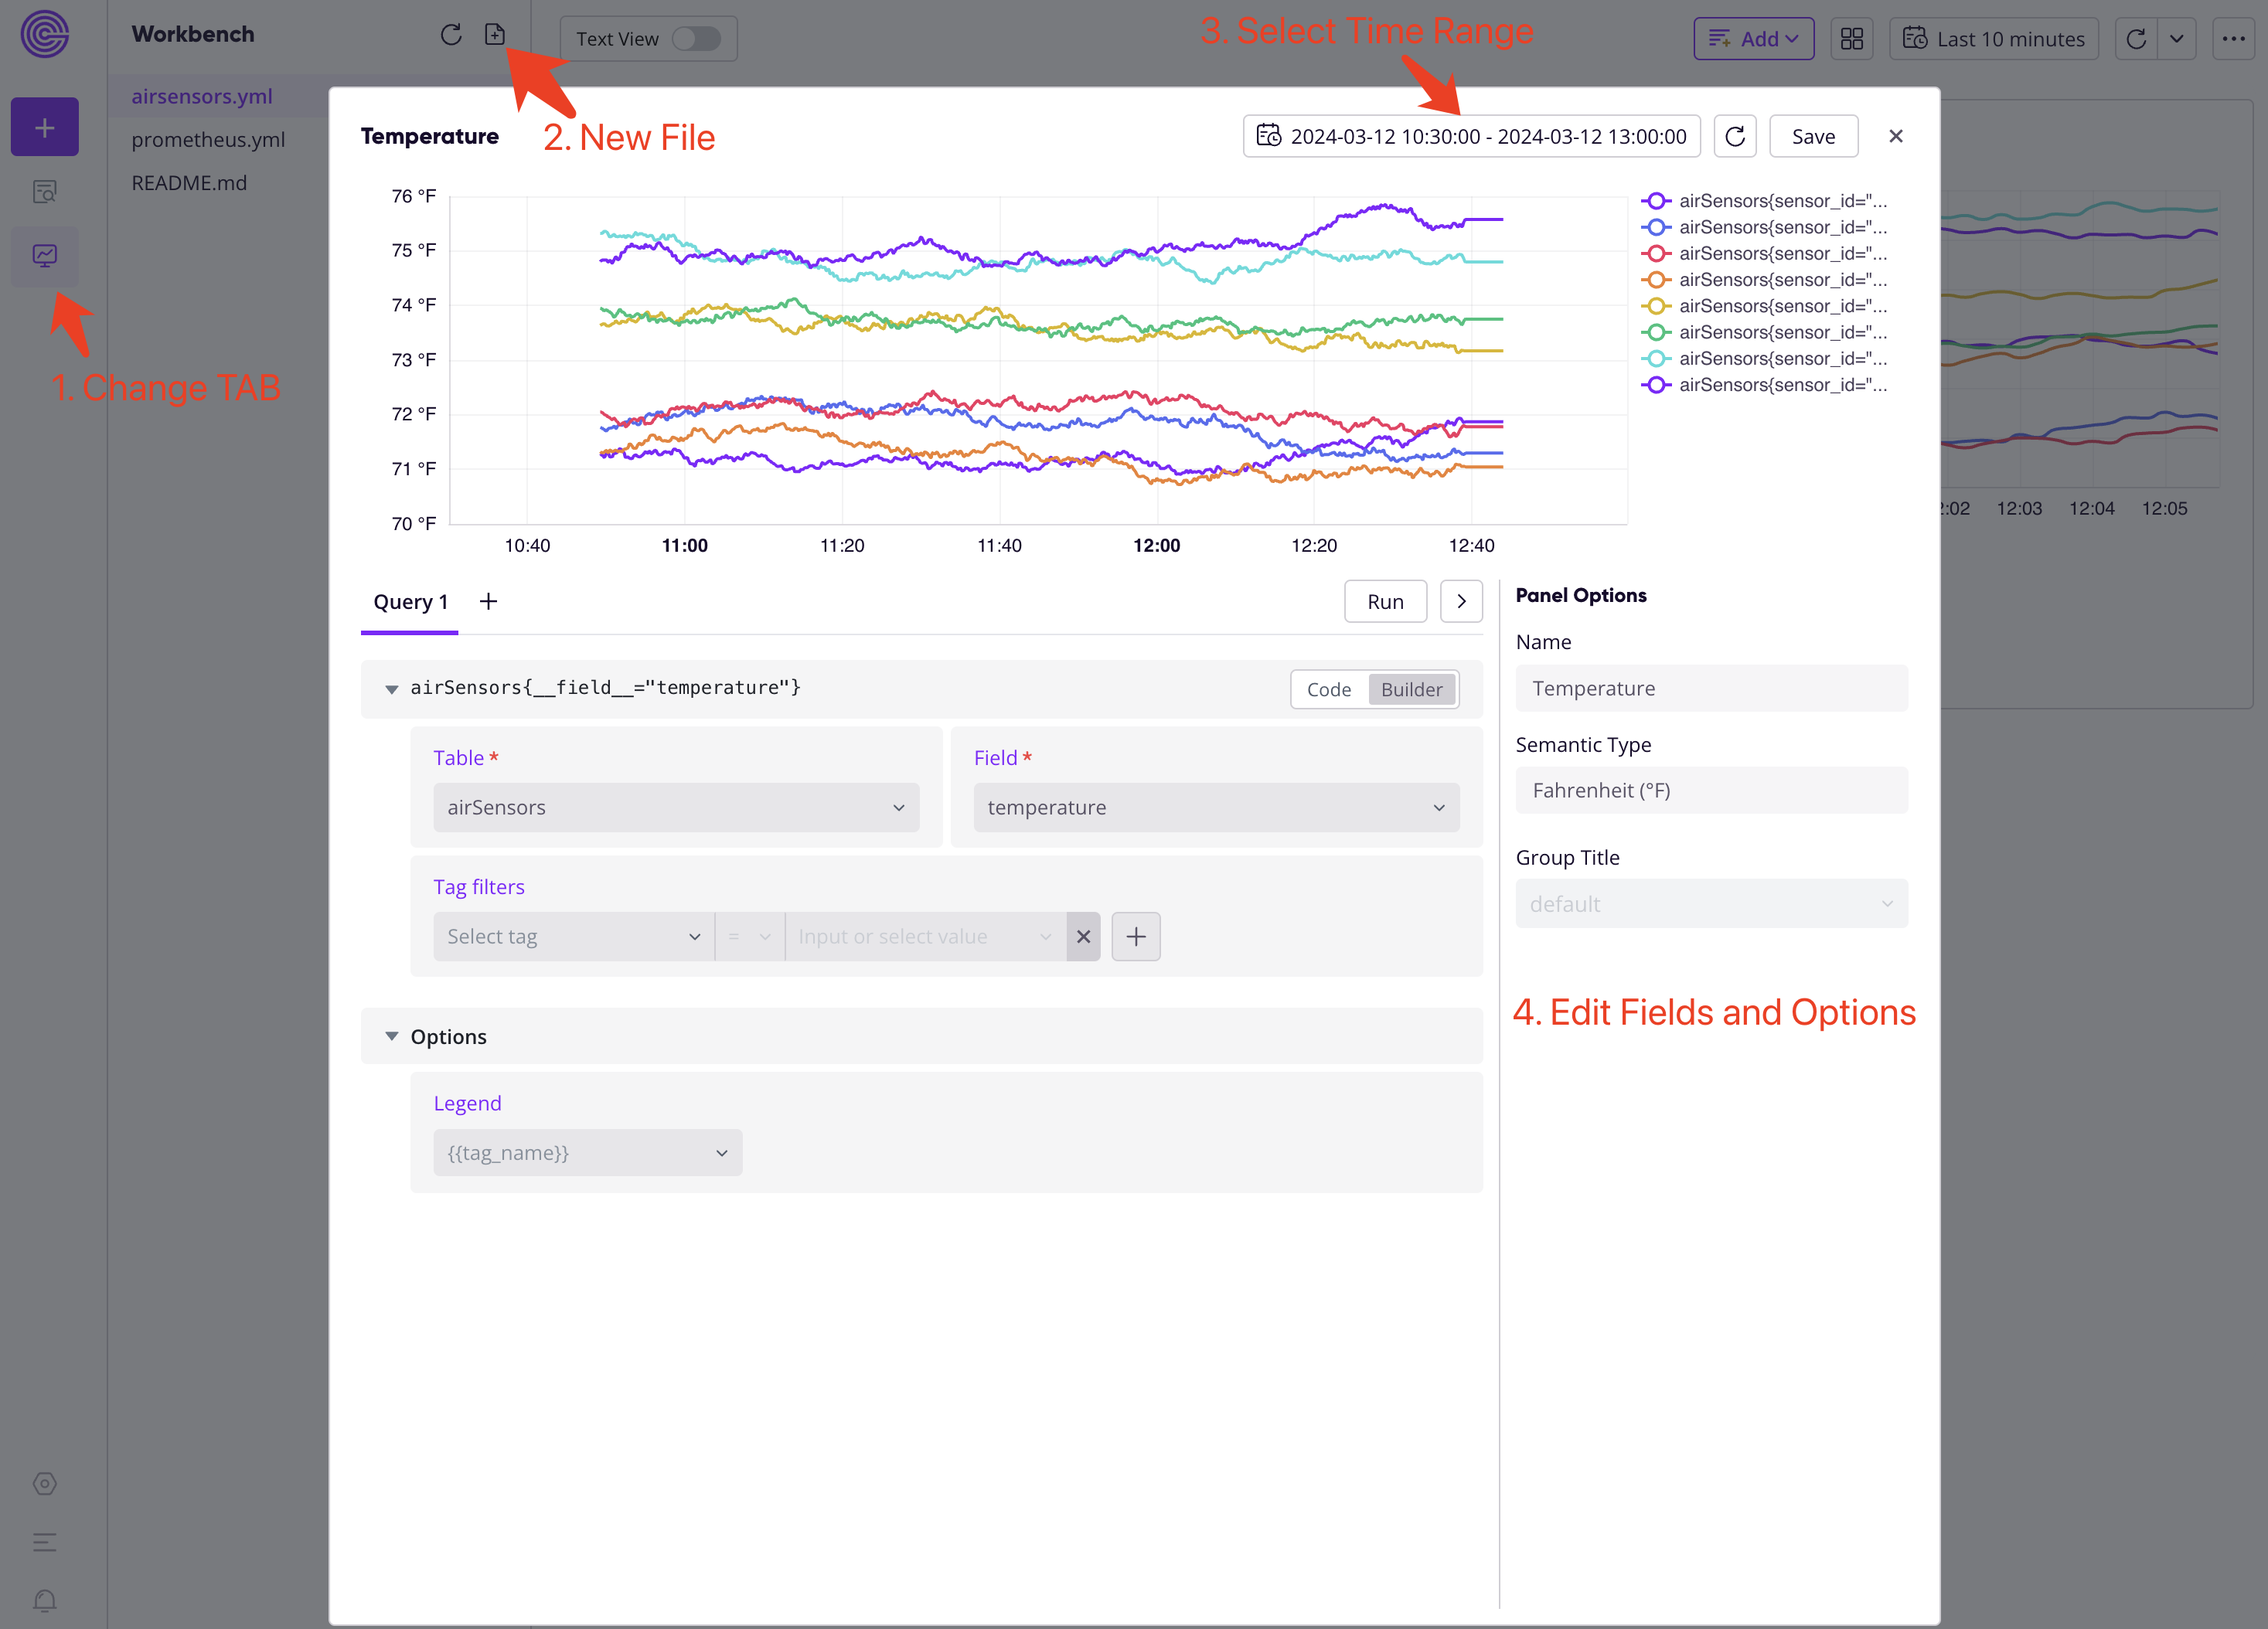
SELECT MIN(ts), MAX(ts) FROM "airSensors";- Click the second icon in the sidebar; go to the workbench page.
- Click "+" to create a new panel file
airsensors.yml. - Start your dashboard by "+Add panel".
- Select time range and fill the fields.
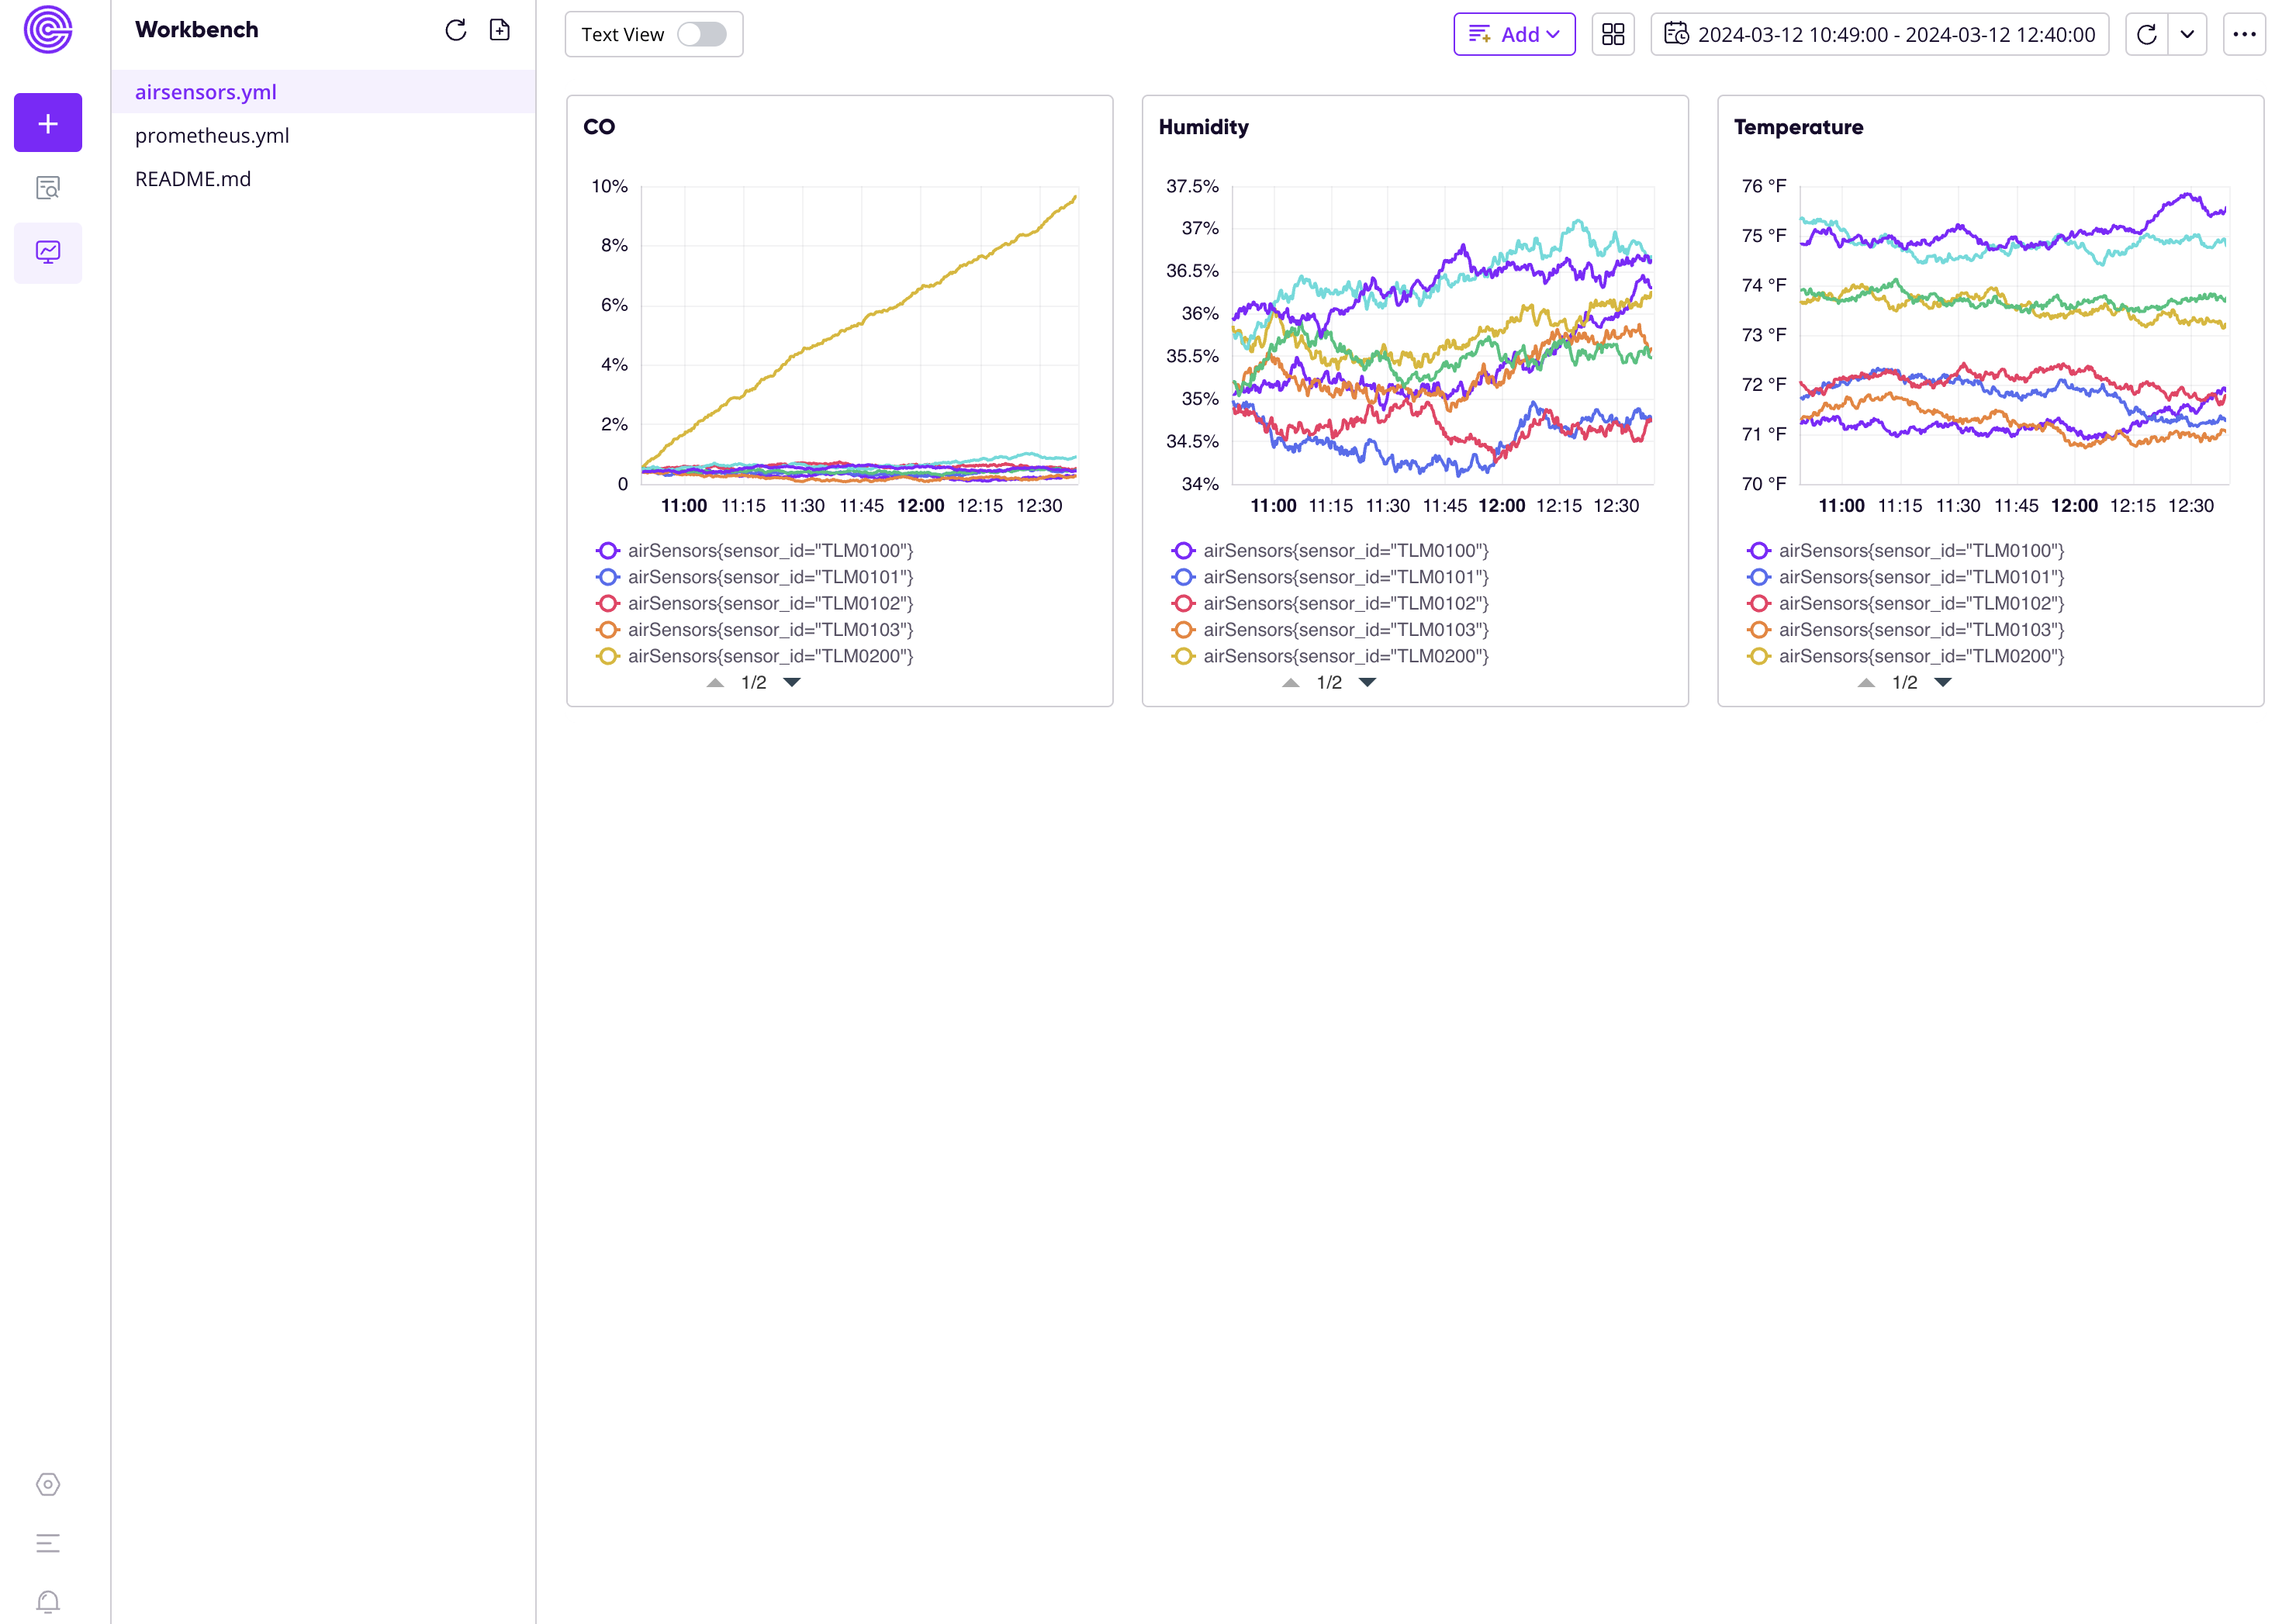
The final panels would be like:
