A dashboard providing Ruby on Rails performance insights based on Free Software, ready to run inside your data-center.
By default it measures (in various forms) performance of:
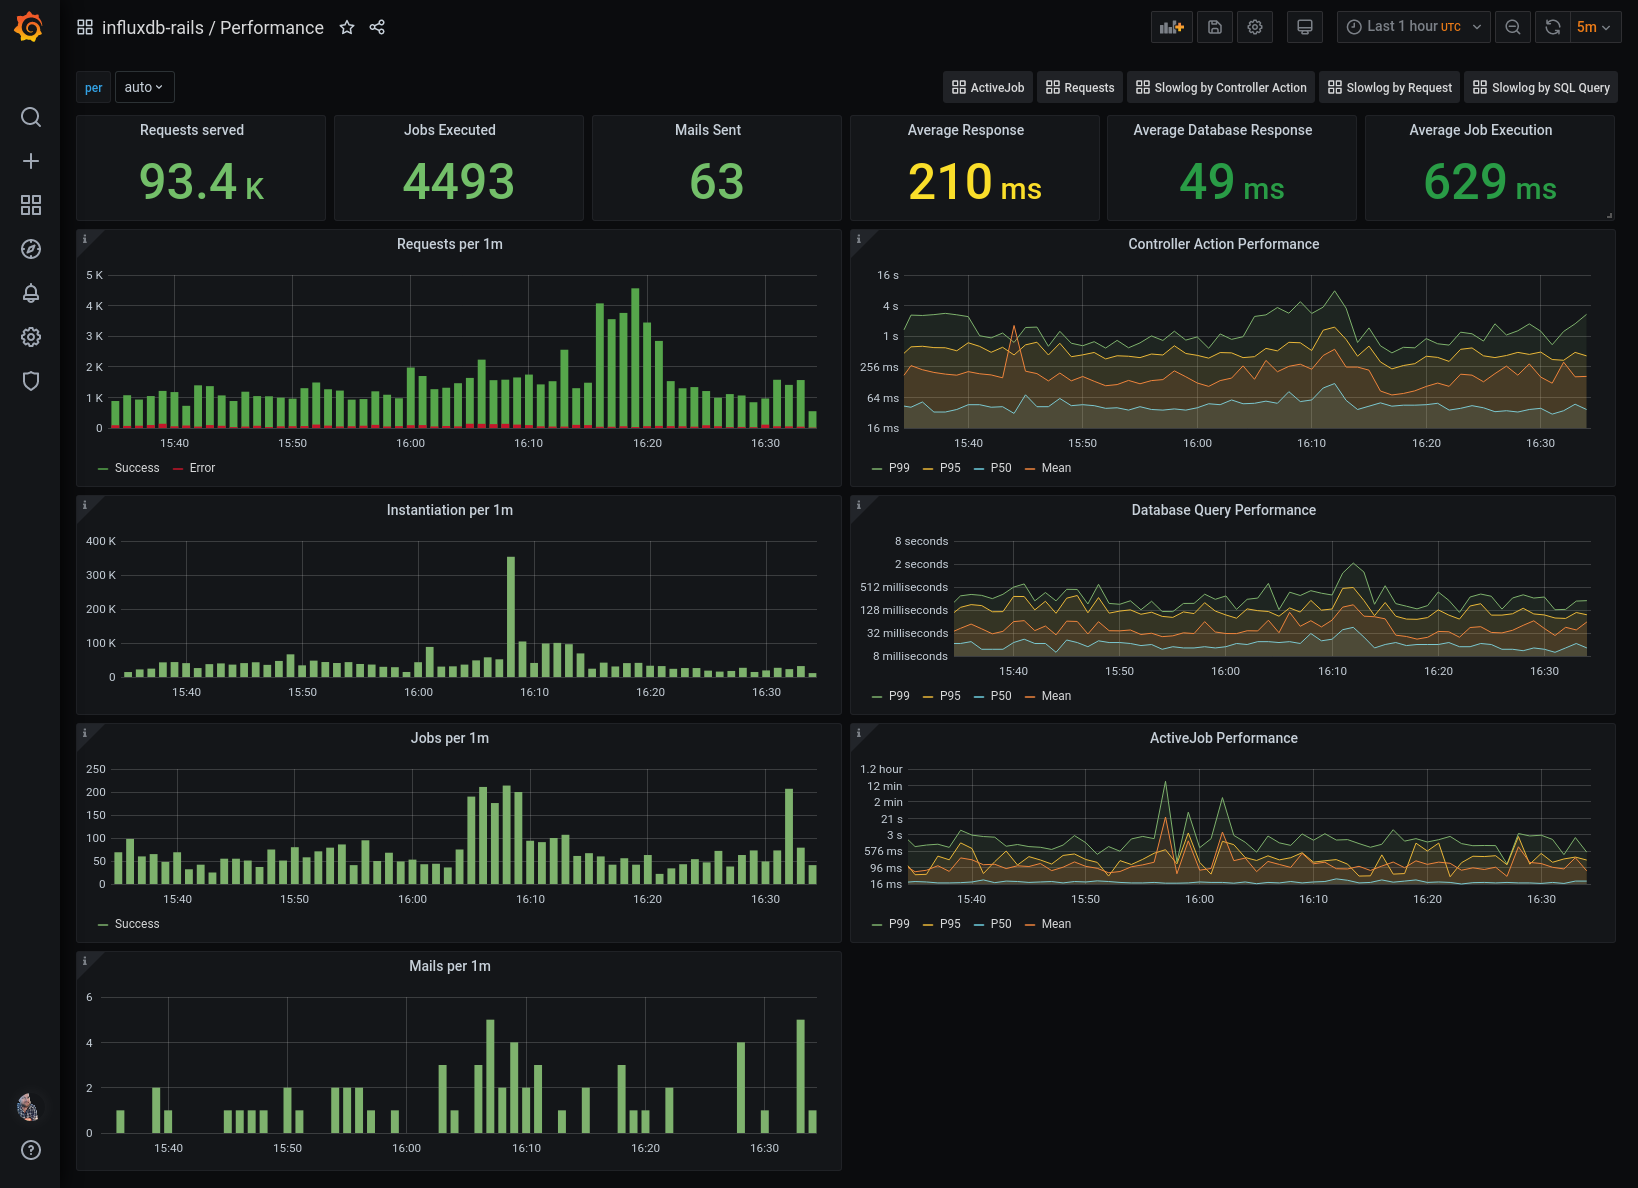
- Controller Actions
- View/Partial Rendering
- Database Queries
- ActiveJobs
- ActionMailers
The dashboards provide an overview and various ways to drill down into numbers on a per request or per action basis. Of course you can use all the awesome features that Influx (Downsampling/Data Retention), Grafana (Alerts, Annotations) and influxdb-rails (custom tags) provide and extend this to your needs. Use your freedom and run, copy, distribute, study, change and improve this software!
To be able to measure performance of your Ruby on Rails application you need to have the following things available:
- InfluxDB 1.x
- Grafana
- A Ruby On Rails application with influxdb-rails enabled
Once you have influx/grafana instances running in your infrastructure just import the dashboards from grafana.com.
- Ruby On Rails Performance Overview
- Performance insights into individual requests, see Ruby On Rails Performance per Request
- Performance of individual actions, see Ruby On Rails Performance per Action
- Ruby On Rails Health Overview
- Ruby on Rails ActiveJob Overview
- Ruby on Rails Slowlog by Request
- Ruby on Rails Slowlog by Action
- Ruby on Rails Slowlog by SQL
You can also paste the .json files from this repository.
This repository includes a docker-compose demo setup that brings a simple rails app, influxdb and grafana.
Clone this repository and run
docker-compose upGo to http://0.0.0.0:4000 and do some things. Every request to the rails app will generate performance data in the demo.
You can also use the dashboard with any other rails app you already have. Follow our install instructions, the default configuration works with the demo InfluxDB running on localhost:8086.
Just go to http://0.0.0.0:3000 and log in with admin/admin.
Enjoy! ❤️