To clone this project you can follow the steps on MathWorks Documentation
You can also download the Add-on from MatLab Toolstrip, on the Home tab, in the Environment section, click the Add-Ons icon:
- Find the add-on by browsing through available categories on the left side of the Add-On Explorer window. Use the search bar to search for an add-on using a keyword.

- Click the add-on to open its detailed information page.

- On the information page, click Add to install the add-on.
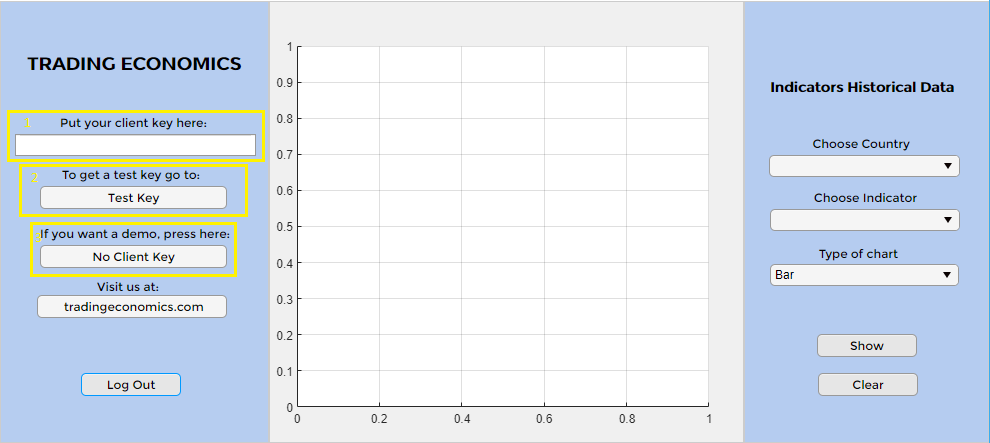
1 - Put your client key.
2 - A test key will only give you access to a sample of countries.
3 - Press "No Client Key" to just see a demo.
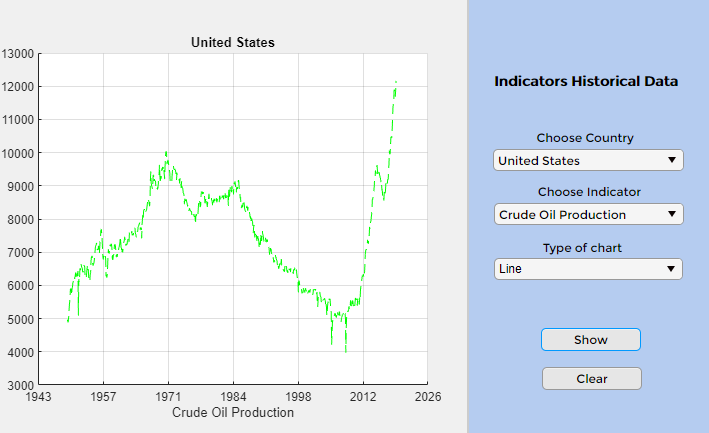
Choose one country and one indicator, press "Show" to see the chart
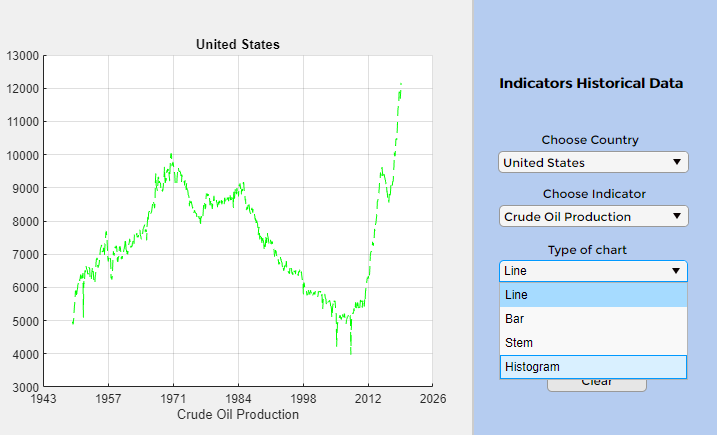
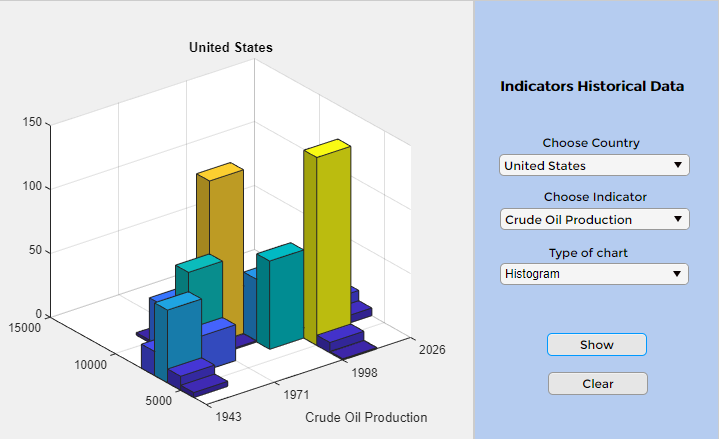
Choose type of chart
Press "Show"


