The multicluster global hub is a set of components that enable the management of multiple hub clusters from a single hub cluster. You can complete the following tasks by using the multicluster global hub:
- Deploy managed hub clusters
- List the managed clusters that are managed by all of the managed hub clusters
The multicluster global hub is useful when a single hub cluster cannot manage the large number of clusters in a high-scale environment. The multicluster global hub designates multiple managed clusters as multiple managed hub clusters. The global hub cluster manages the managed hub clusters.
- Multicluster Global Hub
You can read about the use cases for multicluster global hub in Use Cases.
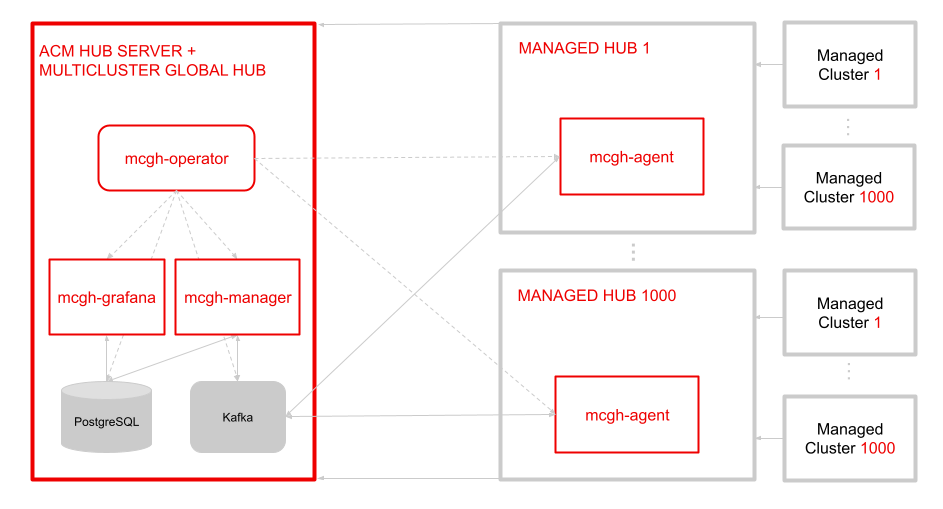
The Multicluster Global Hub Operator contains the components of multicluster global hub. The Operator deploys all of the required components for global multicluster management. The components include multicluster-global-hub-manager, multicluster-global-hub-grafana and built-in kafka and postgres in the global hub cluster and multicluster-global-hub-agent in the managed hub clusters.
The Operator also leverages the manifestwork custom resource to deploy the Red Hat Advanced Cluster Management for Kubernetes Operator on the managed cluster. After the Red Hat Advanced Cluster Management Operator is deployed on the managed cluster, the managed cluster becomes a standard Red Hat Advanced Cluster Management Hub cluster. This hub cluster is now a managed hub cluster.
The Multicluster Global Hub Manager is used to persist the data into the postgreSQL database. The data is from Kafka transport. The manager also posts the data to the Kafka transport, so it can be synchronized with the data on the managed hub clusters.
The Multicluster Global Hub Agent runs on the managed hub clusters. It synchronizes the data between the global hub cluster and the managed hub clusters. For example, the agent synchronizes the information of the managed clusters from the managed hub clusters to the global hub cluster and synchronizes the policy or application from the global hub cluster to the managed hub clusters.
Grafana runs on the global hub cluster as the main service for Global Hub Observability. The Postgres data collected by the Global Hub Manager is its default DataSource. By exposing the service using the route called multicluster-global-hub-grafana, you can access the global hub Grafana dashboards by accessing the Red Hat OpenShift Container Platform console.
To understand how Global Hub functions, see How global hub works.
The following sections provide the steps to start using the Multicluster Global Hub.
-
Red Hat Advanced Cluster Management for Kubernetes version 2.7 or later must be installed and configured. Learn more details about Red Hat Advanced Cluster Management
The managed hub is also a managed cluster of global hub in Red Hat Advanced Cluster Management. The network configuration in Red Hat Advanced Cluster Management is necessary. See Networking for Red Hat Advanced Cluster Management networking details.
- Global hub networking requirements
| Direction | Protocol | Connection | Port (if specified) | Source address | Destination address |
|---|---|---|---|---|---|
| Inbound from browser of the user | HTTPS | User need to access the Grafana dashboard | 443 | Browser of the user | IP address of Grafana route |
| Outbound to Kafka Cluster | HTTPS | Global hub manager need to get data from Kafka cluster | 443 | multicluster-global-hub-manager-xxx pod | Kafka route host |
| Outbound to Postgres database | HTTPS | Global hub manager need to persist data to Postgres database | 443 | multicluster-global-hub-manager-xxx pod | IP address of Postgres database |
- Managed hub networking requirements
| Direction | Protocol | Connection | Port (if specified) | Source address | Destination address |
|---|---|---|---|---|---|
| Outbound to Kafka Cluster | HTTPS | Global hub agent need to sync cluster info and policy info to Kafka cluster | 443 | multicluster-global-hub-agent pod | Kafka route host |
Multicluster global hub has two main components:
- A server component called the "global hub cluster" where the management tools and user interface run
- A client component that is installed on RHACM called the "managed hub" that can be managed by the "global hub cluster"
Supported platform for MCGH:
| Platform | Support for global hub cluster | Support for managed hub clusters |
|---|---|---|
| Red Hat Advanced Cluster Management (RHACM) 2.9, and later 2.9.x releases | Y | Y |
| Red Hat Advanced Cluster Management (RHACM) 2.8, and later 2.8.x releases | Y | Y |
| Red Hat Advanced Cluster Management (RHACM) 2.7, and later 2.7.x releases | Y | Y |
| Red Hat Advanced Cluster Management (RHACM) 2.6, and former release | N | N |
Supported middleware for MCGH:
| Middleware | Support for multicluster global hub |
|---|---|
| Kafka 3.3, and later 3.3.x releases | Y |
| Postgres 14+ | Y |
-
Install the multicluster global hub operator on a disconnected environment
-
Install the multicluster global hub operator from the Red Hat OpenShift Container Platform console:
- Log in to the Red Hat OpenShift Container Platform console as a user with the
cluster-adminrole. - Click Operators > OperatorHub icon in the navigation.
- Search for and select the
multicluster global hub operator. - Click
Installto start the installation. - After the installation completes, check the status on the Installed Operators page.
- Click multicluster global hub operator to go to the Operator page.
- Click the multicluster global hub tab to see the
multicluster global hubinstance. - Click Create multicluster global hub to create the
multicluster global hubinstance. - Enter the required information and click Create to create the
multicluster global hubinstance.
Notes:
- The multicluster global hub is only available for the x86 platform.
- Log in to the Red Hat OpenShift Container Platform console as a user with the
You must disable the cluster self-management in the existing Red Hat Advanced Cluster Management hub cluster. Set disableHubSelfManagement=true in the multiclusterhub custom resource to disable the automatic importing of the hub cluster as a managed cluster.
Import the managed hub cluster by completing the steps in Import cluster.
After the managed hub cluster is imported, check the global hub agent status to ensure that the agent is running in the managed hub cluster by running the following command:
oc get managedclusteraddon multicluster-global-hub-controller -n ${MANAGED_HUB_CLUSTER_NAME}
The Grafana data is exposed through the route. Run the following command to display the login URL:
oc get route multicluster-global-hub-grafana -n <the-namespace-of-multicluster-global-hub-instance>
The authentication method of this URL is same as authenticating to the Red Hat OpenShift Container Platform console.
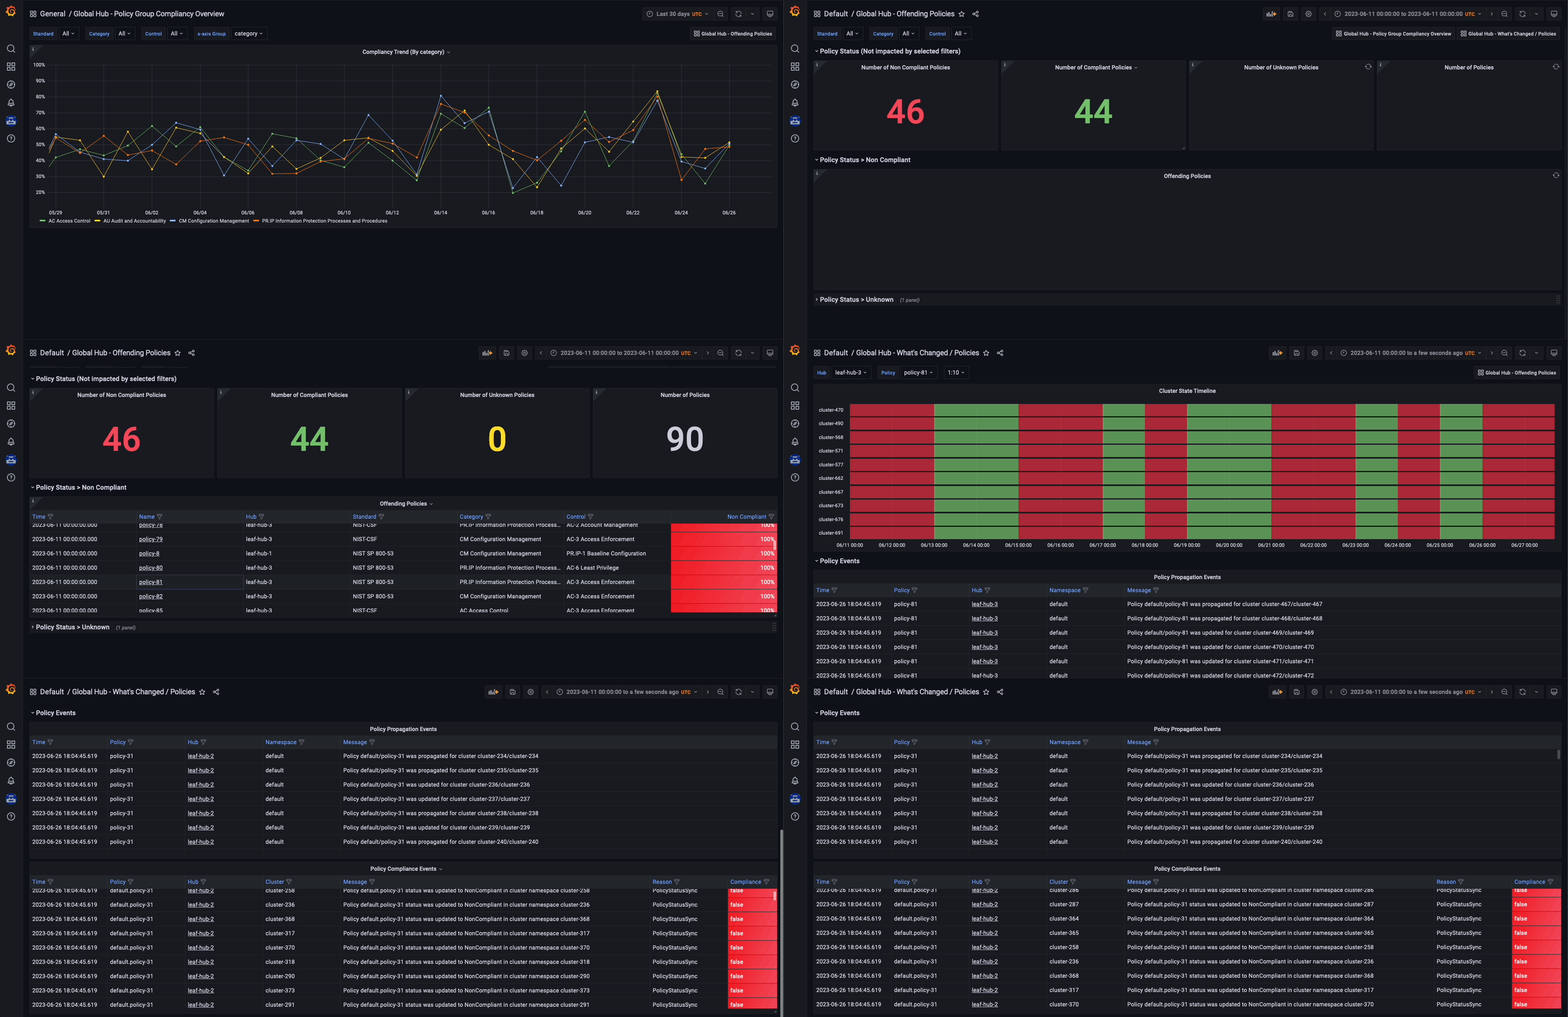
After accessing the global hub Grafana data, you can begin monitoring the policies that were configured through the hub cluster environments that are managed. From the global hub dashboard, you can identify the compliance status of the policies of the system over a selected time range. The policy compliance status is updated daily, so the dashboard does not display the status of the current day until the following day.
To navigate the global hub dashboards, you can choose to observe and filter the policy data by grouping them either by policy or cluster. If you prefer to examine the policy data by using the policy grouping, you should start from the default dashboard called Global Hub - Policy Group Compliancy Overview. This dashboard allows you to filter the policy data based on standard, category, and control. After selecting a specific point in time on the graph, you are directed to the Global Hub - Offending Policies dashboard, which lists the non-compliant or unknown policies at that time. After selecting a target policy, you can view related events and see what has changed by accessing the Global Hub - What's Changed / Policies dashboard.
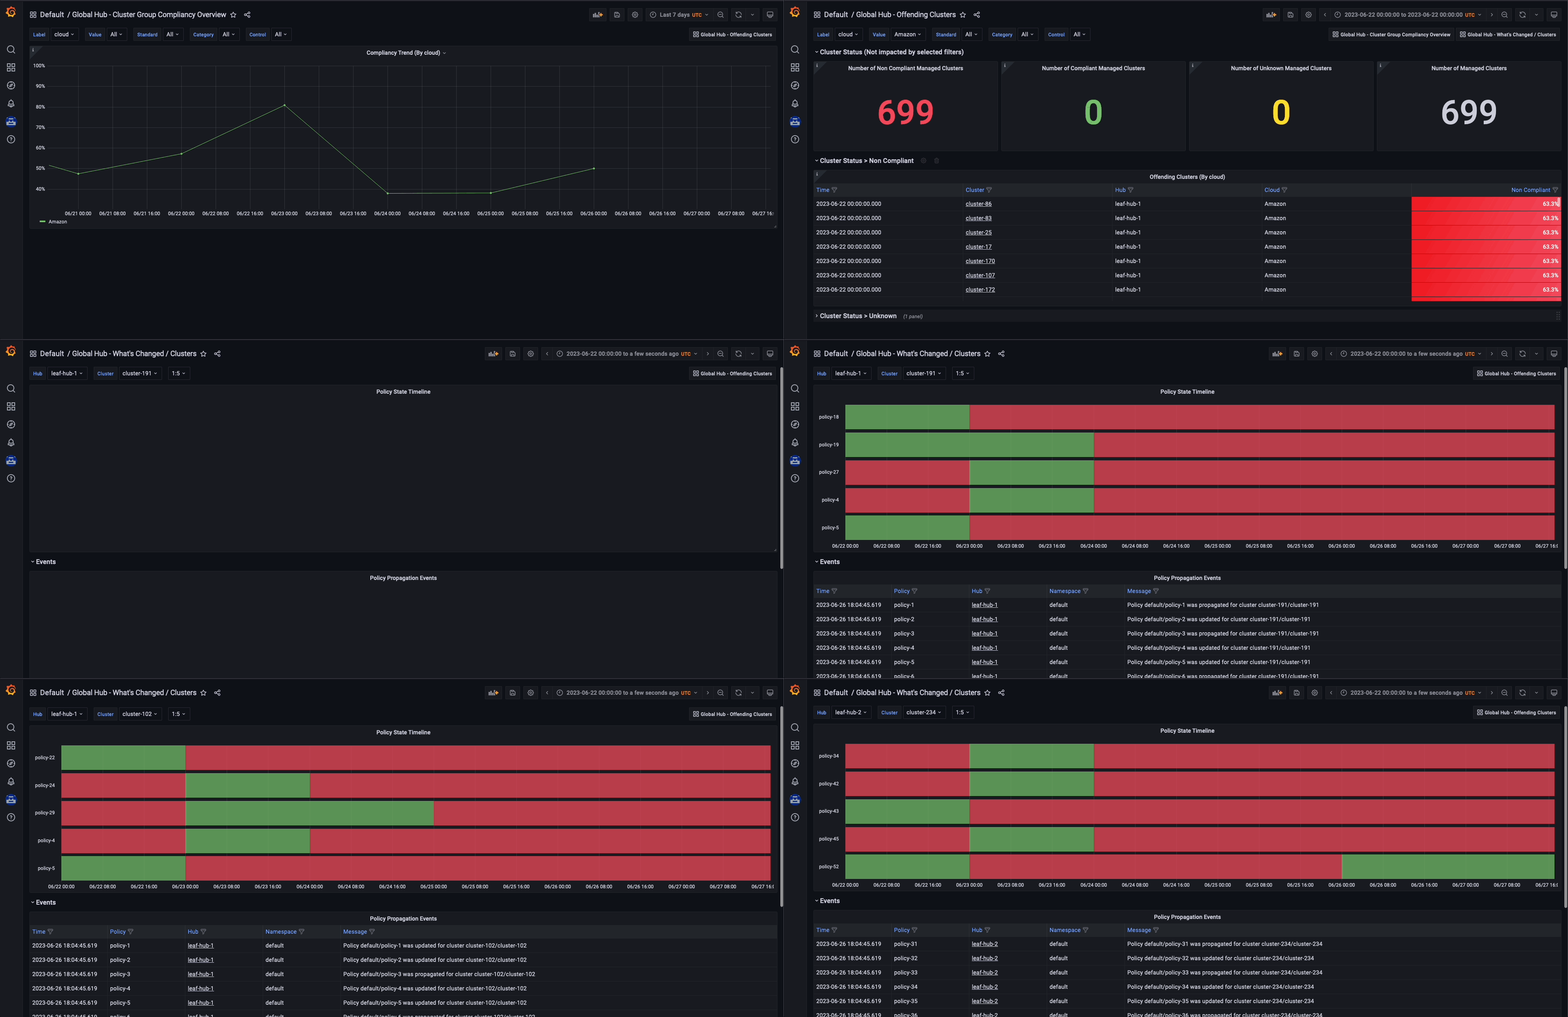
Similarly, if you want to examine the policy data by cluster grouping, begin by using the Global Hub - Cluster Group Compliancy Overview dashboard. The navigation flow is identical to the policy grouping flow, but you select filters that are related to the cluster, such as managed cluster labels and values. Instead of viewing policy events for all clusters, after reaching the Global Hub - What's Changed / Clusters dashboard, you can view policy events related to an individual cluster.
We have three alerts by default. These alerts are stored in configmap multicluster-global-hub-default-alerting. They will watch suspicious policies, suspicious clusters compliance status change and failed cron jobs.
-
Suspicious Policy Change
This Alert rule watches the suspicious policies change, if the following events occur more than 5 times in 1 hour, it becomes a firing alert.
- A policy was enabled/disabled
- A policy was updated
-
Suspicious Cluster Compliance Status Change
This alert watches the cluster compliance status and policy events for a cluster. There are two rules in this alert.
-
Cluster compliance status change frequently If a cluster compliance status changes from
compliancetonon-compliancemore than 3 times in 1 hour, it becomes a firing alert. -
Too many policy events in a cluster For a policy in a cluster, if there are more than 20 events in 5 minutes, it becomes a firing alert. If this alert is always firing, the data in the
event.local_policiestable will increase too fast.
-
-
Cron Job Failed
This alert watch the [Cron jobs](#Cronjobs and Metrics) failed events. There are two rules in this alert.
-
Local Compliance Job Failed
If this alert rule becomes firing, it means the Local compliance status sync job failed. It may cause the data to be lost in the
history.local_compliancetable. Please check it and manually run the job -
Data Retention Job Failed
If this alert rule becomes firing, it means the Data retention job failed and you can also run it manually.
-
If you want to delete a default grafana alert rule, you need to create the Customize Grafana Alerting Resources and include the deleteRules.
For deleting all default alerting, the config should be like:
    deleteRules:
      - orgId: 1
        uid: globalhub_suspicious_policy_change
      - orgId: 1
        uid: globalhub_cluster_compliance_status_change_frequently
      - orgId: 1
        uid: globalhub_high_number_of_policy_events
      - orgId: 1
        uid: globalhub_data_retention_job
      - orgId: 1
uid: globalhub_local_compliance_jobGlobal hub support customize the grafana.ini files. You just need to create a secret in namespace multicluster-global-hub, and the secret name must be: multicluster-global-hub-custom-grafana-config, the secret data key must be: grafana.ini. The following is an example:
apiVersion: v1
kind: Secret
metadata:
  name: multicluster-global-hub-custom-grafana-config
  namespace: multicluster-global-hub
type: Opaque
stringData:
  grafana.ini: |
    [smtp]
    enabled = true
    host = smtp.google.com:465
    user = [email protected]
    password = xxx
    ;cert_file =
    ;key_file =
    skip_verify = true
    from_address = [email protected]
    from_name = Grafana
    # EHLO identity in SMTP dialog (defaults to instance_name)
    ;ehlo_identity = dashboard.example.com
Note: you can not configure the section which already in multicluster-global-hub-default-grafana-config secret
Global hub support customize the alerting resources which grafana support. You just need to create a configmap in namespace multicluster-global-hub, and the configmap name must be: multicluster-global-hub-custom-alerting, the configmap data key must be: alerting.yaml. The following is an example:
apiVersion: v1
data:
  alerting.yaml: |
    contactPoints:
      - orgId: 1
        name: globalhub_policy
        receivers:
          - uid: globalhub_policy_alert_email
            type: slack
            type: email
            settings:
              addresses: [email protected]
              singleEmail: false
          - uid: globalhub_policy_alert_slack
            type: slack
            settings:
              url: <Slack Webhook URL>
              title: |
                {{ template "globalhub.policy.title" . }}
              text: |
                {{ template "globalhub.policy.message" . }}
    policies:
      - orgId: 1
        receiver: globalhub_policy
        group_by: ['grafana_folder', 'alertname']
        matchers:
          - grafana_folder = Policy
        repeat_interval: 1d
    deleteRules:
      - orgId: 1
        uid: <Alert Rule Uid>
    muteTimes:
      - orgId: 1
        name: mti_1
        time_intervals:
          - times:
              - start_time: '06:00'
                end_time: '23:59'
                location: 'UTC'
            weekdays: ['monday:wednesday', 'saturday', 'sunday']
            months: ['1:3', 'may:august', 'december']
            years: ['2020:2022', '2030']
            days_of_month: ['1:5', '-3:-1']
kind: ConfigMap
metadata:
  name: multicluster-global-hub-custom-alerting
  namespace: multicluster-global-hub
After installing the global hub operand, the global hub manager starts running and pull ups a job scheduler to schedule two cronjobs:
At 0 o'clock every day, based on the policy status and events collected by the manager on the previous day. Running the job to summarize the compliance status and change frequency of the policy on the cluster, and store them to the history.local_compliance table as the data source of grafana dashboards. Please refer to here for more details.
Some data tables in global hub will continue to grow over time. So we have the corresponding working to avoid the negative effects of the large data tables. The main approaches primarily involve the following two methods:
-
Limiting the growth of the table by deleting data that was stored a long time ago, and is no longer needed
-
Partitioning on the large table to execute queries/deletions on a large table faster
Specifically, We run a cronjob process to implement the above procedure. For the event tables, like the event.local_policies and history.local_compliance growing every day, we use range partitioning to break down the large tables into small partitions. Furthermore, it's important to note that this process also creates the partition tables for the next month each time it is executed. And For the policy and cluster tables, like local_spec.policies and status.managed_clusters, we add deleted_at indexes on these tables to obtain better performance for hard deleting.
It's also worth noting that the time for which the data is retained can be configured through the retention on the global hub operand. it's recommended minimum value is 1 month, default value is 18 months. Therefore, the execution interval of this job should be less than one month.
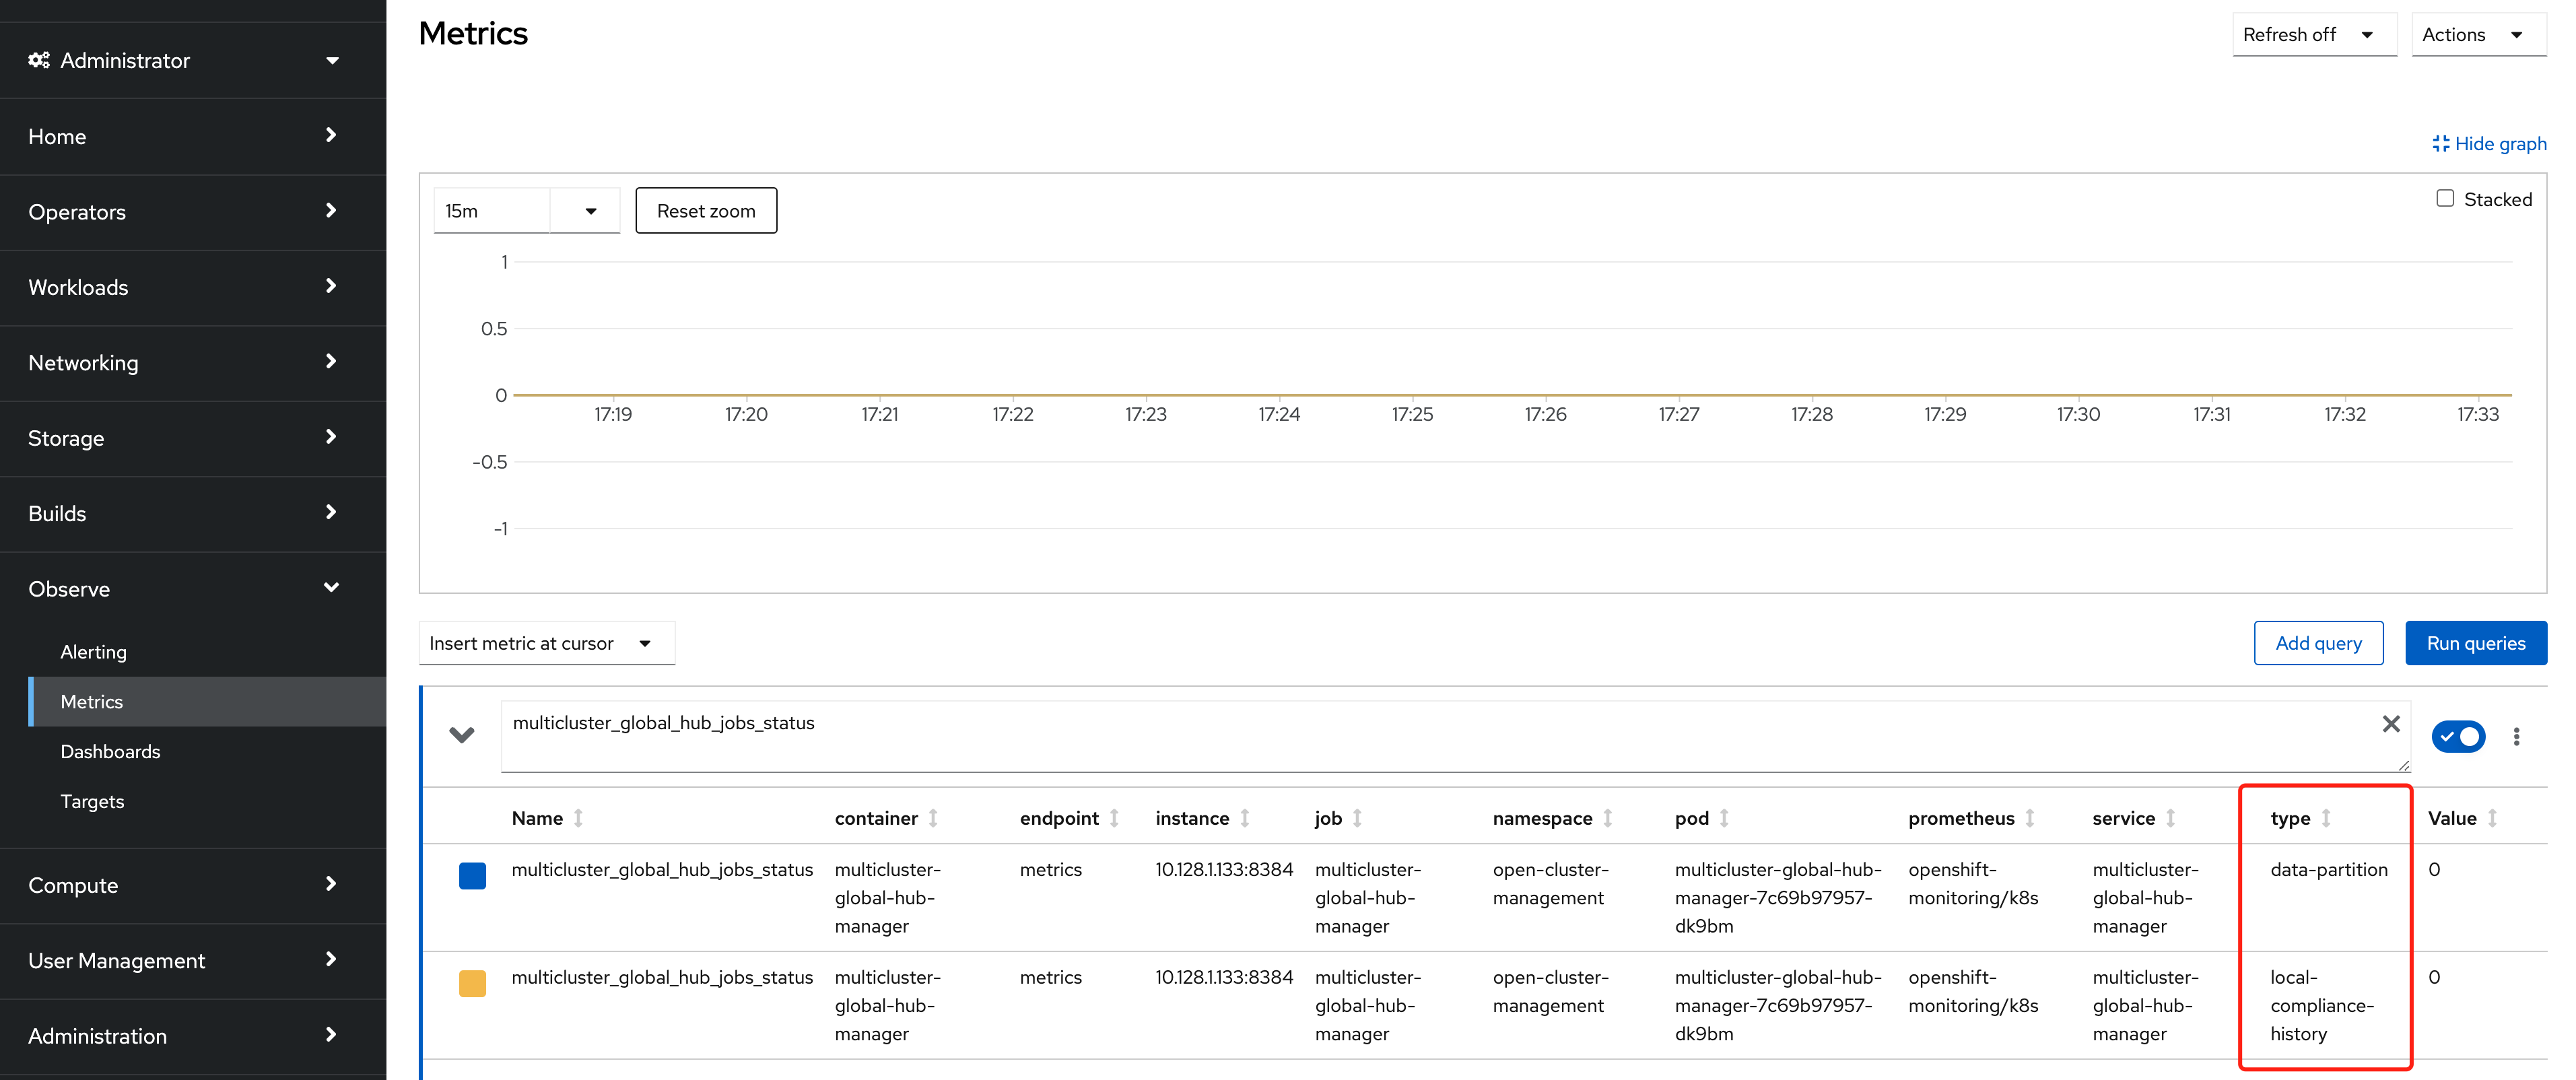
These two jobs' status are saved in the metrics named multicluster_global_hub_jobs_status, as shown in the figure below from the console of the Openshift cluster. Where 0 means the job runs successfully, otherwise 1 means failure.
If there is a failed job, then you can dive into the log tables(history.local_compliance_job_log, event.data_retention_job_log) for more details and decide whether to running it manually.
For common Troubleshooting issues, see Troubleshooting.
If you do not successfully create a managed cluster, you cannot find it in the global hub policy compliance dashboards, but you can see it in the Red Hat Advanced Cluster Management policy console. When you create your managed cluster, note that the clusterclaim, id.k8s.io, does not exist in the managed cluster.
If you install the global hub operator in OCP 4.13, the links to the RHACM managed clusters dashboard pages might redirect you to the RHACM dashboard home page page instead. For more details on this issue, see the open issue
In Global Hub - Policy Group Compliancy Overview dashboards, check your data point by clicking View Offending Policies for standard group: xxx. When you get to the offending page, the standard group filter does not continue to the new page. This same issue exists for the Global Hub - Cluster Group Compliancy Overview dashboard.
There are 3 topics named spec, status and event in your kafka cluster. However the kafka topics can be configured after upgrading it to 1.3. Notably, we will only keep 2 topics in the for the system: one for spec path and the other for status path. The default external topic will be gh-spec and gh-status. So ensure these are aligned between your Kafka clusters and the Global Hub operand. You can either create these two topics in your Kafka cluster or modify the operand to use the existing topics in your Kafka cluster. For example, updating the operand using existing spec and event topics.
apiVersion: operator.open-cluster-management.io/v1alpha4
kind: MulticlusterGlobalHub
...
spec:
  availabilityConfig: Basic
  dataLayer:
    kafka:
      topics:
        specTopic: spec
        statusTopic: event
    postgres:
      retention: 18m
  enableMetrics: false


