Do not run the development server, or enable the built-in debugger, in a production environment. The debugger allows executing arbitrary Python code from the browser. It's protected by a pin, but that should not be relied on for security.
Use an error logging tool, such as Sentry, as described in :ref:`error-logging-tools`, or enable logging and notifications as described in :doc:`/logging`.
If you have access to the server, you could add some code to start an
external debugger if request.remote_addr matches your IP. Some IDE
debuggers also have a remote mode so breakpoints on the server can be
interacted with locally. Only enable a debugger temporarily.
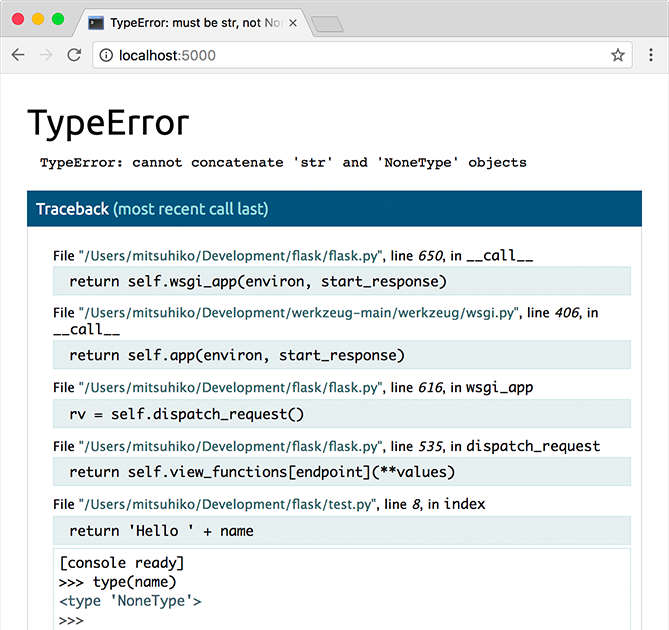
The built-in Werkzeug development server provides a debugger which shows an interactive traceback in the browser when an unhandled error occurs during a request. This debugger should only be used during development.
Warning
The debugger allows executing arbitrary Python code from the browser. It is protected by a pin, but still represents a major security risk. Do not run the development server or debugger in a production environment.
The debugger is enabled by default when the development server is run in debug mode.
$ flask --app hello run --debug
When running from Python code, passing debug=True enables debug mode, which is
mostly equivalent.
app.run(debug=True):doc:`/server` and :doc:`/cli` have more information about running the debugger and debug mode. More information about the debugger can be found in the Werkzeug documentation.
External debuggers, such as those provided by IDEs, can offer a more powerful debugging experience than the built-in debugger. They can also be used to step through code during a request before an error is raised, or if no error is raised. Some even have a remote mode so you can debug code running on another machine.
When using an external debugger, the app should still be in debug mode, otherwise Flask turns unhandled errors into generic 500 error pages. However, the built-in debugger and reloader should be disabled so they don't interfere with the external debugger.
$ flask --app hello run --debug --no-debugger --no-reload
When running from Python:
app.run(debug=True, use_debugger=False, use_reloader=False)Disabling these isn't required, an external debugger will continue to work with the following caveats.
If the built-in debugger is not disabled, it will catch unhandled exceptions before the external debugger can.
If the reloader is not disabled, it could cause an unexpected reload if code changes during a breakpoint.
The development server will still catch unhandled exceptions if the built-in debugger is disabled, otherwise it would crash on any error. If you want that (and usually you don't) pass
passthrough_errors=Truetoapp.run.app.run( debug=True, passthrough_errors=True, use_debugger=False, use_reloader=False )
