The entire PyQSPICE consists of a Python class clsQSPICE, let's load it as pqs. ...and load some standard modules those used in this example.
from PyQSPICE import clsQSPICE as pqs

import os
import math
import pandas as pd
import matplotlib as mpl
import matplotlib.pyplot as pltThere are some class methods and class variables those available without having class instances. Mostly those are path names of QSPICE executable (.exe) and working directory information.
Let's move our working directory to "10_DC" under "tests".
NOTE: Here, we don't want to move down to "tests/10_DC/tests/10_DC...." every time we run this JupyterLab step, so we have this "if" statement.
if not os.getcwd().rstrip().replace('/','\\').endswith(r'tests\10_DC'):
    pqs.chdir('tests/10_DC')
print(pqs.gpath)
{'cwd': 'C:\\Users\\Masashi\\Documents\\vp\\Masashi\\PyQSPICE\\tests\\10_DC', 'home': 'C:\\Users\\Masashi', 'QUX': 'C:\\Users\\Masashi/QSPICE/QUX.exe', 'QSPICE64': 'C:\\Users\\Masashi/QSPICE/QSPICE64.exe'}
By providing an actual file name or a base file name (without file-extension/suffix), we can generate a PyQSPICE instnace.
- The "path" is a list of auto-generated target file names, based on the file name initiating this PyQSPICE instance.
- The "ts" is a list of time stamp of each target files.
- The "date" is a list of modified date/time of each target files.
NOTE: The "ts" element is zero (0) for files not existing. And "date" is empty for non-existing files.
run = pqs("UJ3N065080")
print(run.path)
print(run.ts)
print(run.date)
{'user': 'UJ3N065080', 'base': 'UJ3N065080', 'qsch': 'UJ3N065080.qsch', 'qraw': 'UJ3N065080.qraw', 'cir': 'UJ3N065080.cir'}
{'qsch': 1696704204.0, 'qraw': 1697208347.42511, 'cir': 1697208347.1637833}
{'qsch': datetime.datetime(2023, 10, 7, 14, 43, 24), 'qraw': datetime.datetime(2023, 10, 13, 10, 45, 47, 425110), 'cir': datetime.datetime(2023, 10, 13, 10, 45, 47, 163783)}
The qsch2cir() PyQSPICE method runs the QSPICE simulator to convert a .qsch schematic file into a .cir netlist file.
run.qsch2cir()
print(run.ts)
print(run.date)
{'qsch': 1696704204.0, 'qraw': 1697208347.42511, 'cir': 1697208382.4912722}
{'qsch': datetime.datetime(2023, 10, 7, 14, 43, 24), 'qraw': datetime.datetime(2023, 10, 13, 10, 45, 47, 425110), 'cir': datetime.datetime(2023, 10, 13, 10, 46, 22, 491272)}
the cir2qraw() PyQSPICE method runs the QSPICE simulator to get your result .qraw file.
run.cir2qraw()
print(run.ts)
print(run.date)
{'qsch': 1696704204.0, 'qraw': 1697208386.0651138, 'cir': 1697208382.4912722}
{'qsch': datetime.datetime(2023, 10, 7, 14, 43, 24), 'qraw': datetime.datetime(2023, 10, 13, 10, 46, 26, 65114), 'cir': datetime.datetime(2023, 10, 13, 10, 46, 22, 491272)}
The LoadQRAW() PyQSPICE method loads specified signal(s) information into Python memory as a Pandas DataFrame object. This method reads all the signal names in the given "list".
NOTE: The PyQSPICE module identifies the first column of data based on the simulation result .qraw file. Such info is stored in sim variable.
df = run.LoadQRAW(["Id(J1)"])
print(df)
print(run.sim)
V2 Id(J1) Step
0 0.000000 1.160000e-12 0
1 0.002000 3.885333e-03 0
2 0.004001 7.770666e-03 0
3 0.006001 1.165600e-02 0
4 0.008002 1.554133e-02 0
... ... ... ...
29995 9.991998 9.254473e+01 5
29996 9.993999 9.255042e+01 5
29997 9.995999 9.255612e+01 5
29998 9.998000 9.256181e+01 5
29999 10.000000 9.256751e+01 5
[30000 rows x 3 columns]
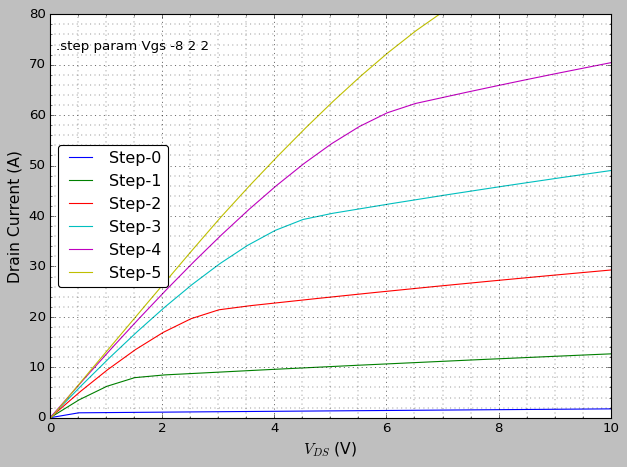
{'Nline': 4999, 'Nstep': 6, 'Type': 'DC Transfer Characteristic', 'Xlbl': 'V2', 'Xmin': 0.0, 'Xmax': 10.0, 'StepInfo': '.step param Vgs -8 2 2 \n'}
From this point, you can do your own operation on your simulation results.
mpl.rcParams.update([['font.sans-serif', ["Arial Rounded MT Bold", 'Arial Unicode MS', 'Arial', 'sans-serif']], ["mathtext.default", "rm"], ["legend.labelspacing", 0.1], ["legend.columnspacing", 0.2], ["legend.handletextpad", 0.3], ['axes.formatter.useoffset', False], ['xtick.minor.visible', True], ['ytick.minor.visible', True], ['grid.linewidth', 1],["savefig.dpi", 300], ["axes.unicode_minus", False]])

plt.close('all')

#['Solarize_Light2', '_classic_test_patch', '_mpl-gallery', '_mpl-gallery-nogrid', 'bmh', 'classic', 'dark_background', 'fast', 'fivethirtyeight', 'ggplot', 'grayscale', 'seaborn-v0_8', 'seaborn-v0_8-bright', 'seaborn-v0_8-colorblind', 'seaborn-v0_8-dark', 'seaborn-v0_8-dark-palette', 'seaborn-v0_8-darkgrid', 'seaborn-v0_8-deep', 'seaborn-v0_8-muted', 'seaborn-v0_8-notebook', 'seaborn-v0_8-paper', 'seaborn-v0_8-pastel', 'seaborn-v0_8-poster', 'seaborn-v0_8-talk', 'seaborn-v0_8-ticks', 'seaborn-v0_8-white', 'seaborn-v0_8-whitegrid', 'tableau-colorblind10']

for stl in ['ggplot', 'Solarize_Light2', 'classic', 'dark_background', 'grayscale']:
    plt.style.use(stl)

    fig, ax = plt.subplots(tight_layout=True)

    for i in range(run.sim['Nstep']):
        df[df.Step == i].plot(ax=ax, x=run.sim['Xlbl'],  y="Id(J1)", label="Step-" + str(i))

    ax.set_xlim(run.sim['Xmin'],run.sim['Xmax'])
    ax.set_ylim(0,80)
    ax.set_ylabel('Drain Current (A)', fontsize=14)
    ax.set_xlabel('$V_{DS}$ (V)', fontsize=14)
    ax.minorticks_on()

    ax.grid(which='major', linewidth="0.5")
    ax.grid(which='minor', linewidth="0.35")

    ax.text(0.1, 70, run.sim['StepInfo'])
    plt.legend(ncol=1, loc="center left",fancybox=True)

    plt.show()

    run.tstime(['png'])
    plt.savefig(run.path['png'], format='png', bbox_inches='tight')
plt.close('all')The clean() PyQSPICE method cleans up files generated by the script.
NOTE: If you specify the schematic .qsch in your cleaning list, it deletes it as you ordered with no warning.
run.tstime(['png'])
print(run.ts)
print(run.date)
run.clean(['cir','qraw','png'])
print(run.ts)
print(run.date)
{'qsch': 1696704204.0, 'qraw': 1697208386.0651138, 'cir': 1697208382.4912722, 'png': 1697208396.8097184}
{'qsch': datetime.datetime(2023, 10, 7, 14, 43, 24), 'qraw': datetime.datetime(2023, 10, 13, 10, 46, 26, 65114), 'cir': datetime.datetime(2023, 10, 13, 10, 46, 22, 491272), 'png': datetime.datetime(2023, 10, 13, 10, 46, 36, 809718)}
{'qsch': 1696704204.0, 'qraw': 0, 'cir': 0, 'png': 0}
{'qsch': datetime.datetime(2023, 10, 7, 14, 43, 24)}


