NanoMethViz is a toolkit for visualising methylation data from Oxford Nanopore sequencing.
You can install NanoMethViz from Bioconductor with:
if (!requireNamespace("BiocManager", quietly = TRUE))
    install.packages("BiocManager")

BiocManager::install("NanoMethViz")
To install the latest developmental version, use:
if (!requireNamespace("BiocManager", quietly = TRUE))
    install.packages("BiocManager")

BiocManager::install(version='devel')

BiocManager::install("NanoMethViz")This package currently works with data from megalodon, nanopolish and f5c, to import your data please see the following vignette
vignette("ImportingData", package = "NanoMethViz")An introductory example for plotting can be found in the package vignette:
vignette("Introduction", package = "NanoMethViz")Other vignettes are provided for various features:
# how to use dimensionality reduction plots
vignette("DimensionalityReduction", package = "NanoMethViz")

# how to import external annotations
vignette("ExonAnnotations", package = "NanoMethViz")The MDS plot is used to visualise differences in the methylation profiles of multiple samples.
The feature aggregation plot can average the methylation profiles across a set of features.
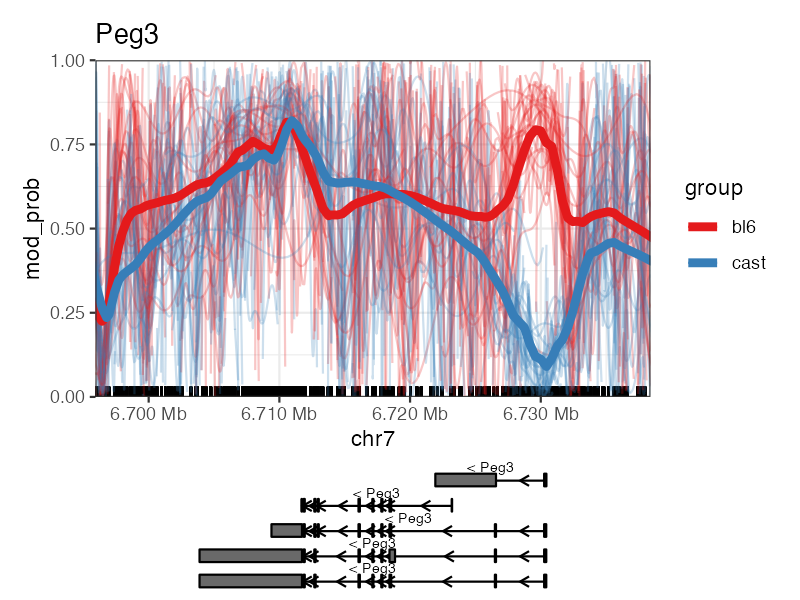
The spaghetti plot shows the smoothed methylation probabilities over a specific region, along with the methylation probabilities along individual long reads.
The heatmap shows methylation probabilities on individual sites along stacked reads.
This project is licensed under Apache License, Version 2.0.


