v1.0.1

Simple HTML5 Charts using chart-x tag powered by omi and chart.js.
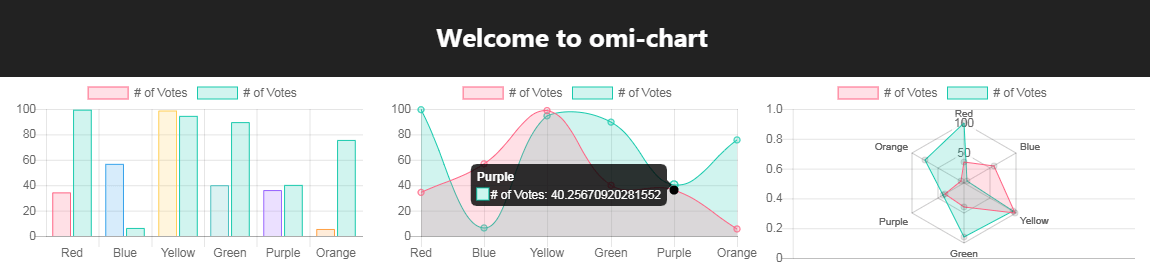
- Bar charts
- Line charts
- Scatter charts
- Other charts
<chart-bar /><chart-line /><chart-scatter /><chart-pie /><chart-doughnut /><chart-radar /><chart-polar-area /><chart-bubble />
npm i omi-chartimport { define, WeElement, render } from 'omi'
import 'omi-chart'
define('my-app', class extends WeElement {
install(){
this.chartData = {
labels: ["Red", "Blue", "Yellow", "Green", "Purple", "Orange"],
datasets: [{
label: '# of Votes',
data: [12, 19, 3, 5, 2, 3],
backgroundColor: '#f391a9',
borderColor: '#ef5b9c',
borderWidth: 1
}]
}
this.chartOptions = {
scales: {
yAxes: [{
ticks: {
beginAtZero: true
}
}]
}
}
}
render(props, data) {
return (
<div>
<chart-bar width={600} data={this.chartData} options={this.chartOptions} />
</div>
)
}
})
render(<my-app />, 'body')For detailed options and data formats, see the chart.js document.
import { WeElement, define } from 'omi'
import Chart from 'chart.js'

class ChartBase extends WeElement {
  receiveProps(props) {
    this.chart.data = props.data
    this.chart.options = props.options
    this.chart.update()
  }

  render(props) {
    return (
      <div style={{ width: props.width + 'px', height: props.height + 'px' }}>
        <canvas ref={(e) => { this.canvas = e }}>
        </canvas>
      </div>
    )
  }
}

define('chart-bar', class extends ChartBase {
  installed() {
    this.chart = new Chart(this.canvas.getContext('2d'), {
      type: this.props.horizontal ? 'horizontalBar' : 'bar',
      data: this.props.data,
      options: this.props.options
    })
  }
})


define('chart-line', class extends ChartBase {
  installed() {
    this.chart = new Chart(this.canvas.getContext('2d'), {
      type: 'line',
      data: this.props.data,
      options: this.props.options
    })
  }
})


define('chart-scatter', class extends ChartBase {
  installed() {
    this.chart = new Chart.Scatter(this.canvas.getContext('2d'), {
      data: this.props.data,
      options: this.props.options
    })
  }
})MIT