This is the methodology for an article about populism in Europe: Europeans sour on elites and the EU, but agree on little else?
The data used for this analysis came from a variety of sources. They can be examined here.
-
Data for the ideological ratings of European political parties came from the Chapel Hill Expert Survey (CHES). Every four years or so, CHES asks political scientists from various countries to rate active parties on numerical scales, according to their stances on various policy issues. The variables used in this analysis are:
- Integration with the European Union (1 = strongly opposed, 7 = strongly in favour). The variable is called
EU_integration. - State intervention in the economy (0 = extreme left, 10 = extreme right). The variable is called
lrecon. - Civil liberties (0 = libertarian, 10 = authoritarian). The variable is called
galtan. - Immigration (0 = fully oppose restrictive policy, 10 = fully support restrictive policy). The variable is called
immigrate_policy. - Importance of anti-elite rhetoric (0 = not important at all, 10 = very important). The variable is called
antielite_salience.
- Integration with the European Union (1 = strongly opposed, 7 = strongly in favour). The variable is called
-
The data and codebook for the 2017 edition of CHES are available online at: https://www.chesdata.eu/1999-2014-chapel-hill-expert-survey-ches-trend-file-1
-
The data and codebook for the 2014 edition of CHES are available online at: https://www.chesdata.eu/2014-chapel-hill-expert-survey
-
Data for the vote shares of European political parties in parliamentary elections came from Parlgov.org. For the 31 European countries that had ideological scores in the 2014 edition of CHES, we collected voting data in two cycles:
- The latest nationwide parliamentary election between 2011 and 2014 (in Britain we used the 2015 general election).
- The latest nationwide parliamentary election between 2015 and 2018 (Belgium has not held an election in that period).
-
We collected the Parlgov data into a single spreadsheet, named
parlgov_party_vote_shares.csv. This spreadsheet uses the CHES unique ID numbers for each party, which are contained in the columnparty_id.- For parties that operated in coalition between 2011 and 2014, we divided the votes gained by the coalition among the parties, weighting them by the share of seats that they gained (where that information is available).
- In Croatia, for example, the Social Democratic Party (SDP), Croatian People’s Party (HNS), Croatian Party of Pensioners (HSU) and Democratic Assembly (IDS) formed a coalition in 2011, which gained 41.1% of votes. Because the SDP received 69% of the seats awarded to the coalition, we assigned it that share of the coalition's votes (which came to 28.5%).
- For parties that have merged since 2015, we have divided the votes gained by the new coalition among the old parties, weighting them by the share of votes won by the old parties in the previous election.
- In Portugal, for example, the Social Democratic Party (PSD) and the Democratic and Social Centre (CDS-PP) formed a coalition in 2015, which gained 39.8% of votes. In 2011 PSD received 40.3% of votes, and CDS-PP received 12.2%. So the 39.8% that they collectively received in 2015 was split according to the 2011 ratio, ending up with 30.6% for PSD and 9.2% for CDS-PP.
- These calculations are described in the columns
previous_election_notesandlatest_election notes.
Our aim was to create a dataframe containing ideological ratings for each party, and its change in vote share between the two cycles. Then we could analyse which ideological positions were associated with gaining votes, and explore the relationships between parties on various spectrums.
- In a Python script called
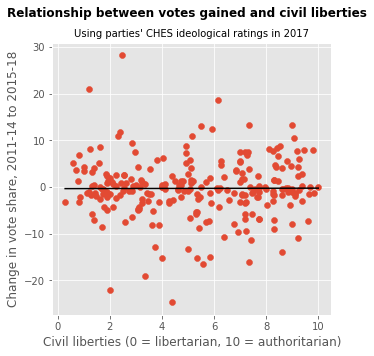
european_populism_script.ipynb, we imported and joined the dataframes for a party's ideological positions and for its vote shares over the two electoral cycles. We rescaled the CHES measure of EU integration: 0 = strongly in favour, 10 = strongly opposed. - We then explored the correlations between these ideological positions and changes in vote shares. We found clear linear relationships between a party's change in votes and both its anti-elite rhetoric and opposition to the EU. By contrast, a party's change in votes bore no association with its position on immigration, civil liberties or economic policy.
-
The chart is based on the CHES survey data responses on four measures: left/right economic, left/right social, anti-EU sentiment, and anti-immigration sentiment. To generate the chart, we calculated the Euclidean distance between each pair of parties on all four coordinates (weighted equally). These distances were classed as close, very close, or extremely close.
-
We then plotted the parties on the two left-right axes, and used a physics model (
d3.js’s force layout) to arrange the parties into a chart. The model makes all parties repel one another slightly, attracts parties to one another based on their distance classifications, and prevents them overlapping or being pushed off the chart entirely. Once the physics model settled into a shape, we did a few small tweaks (for example, AKP is not particularly close on these measures to far-right populist parties, but was boxed in to their cluster, so we shifted its position manually), and this led to our final chart. -
This method is not analytical, but allowed us to create a meaningful two-dimensional representation of a four-dimensional relationship.
The code that generated this plot (apart from our few manual tweaks) is viewable in populism-chart.html and main.js. It should run well in any modern browser, but has been tested in Chrome and Firefox. For technical reasons, to run it in Chrome you will need to use a basic HTTP server, like Python's basic http server:
- navigate to this directory in your terminal
- run
python -m SimpleHTTPServer 8080(orpython3 -m http.server 8080) - then navigate to
http://localhost:8080/populism-chart.html.


