This recipe shows how to use the Debugger for Chrome extension with VS Code to debug Vue.js applications generated by the Vue CLI.
Notice: Please be aware that we have found issues with the sourcemaps generated by vue-cli, which are causing problems for the debugging experience in VS Code. See vuejs/vue-loader#1163
-
Make sure to have Google Chrome installed in its default location.
-
Make sure to the latest version of Debugger for Chrome extension installed in VS Code.
-
npm install -g vue-cli -
Use Vue CLI to create a new Vue.js app.
vue init webpack vuejs-webpack-project -
Change to the newly created application directory and open VS Code.
cd vuejs-webpack-project
code .
Before you can debug your Vue components from VS Code you need to update the generated webpack config to build sourcemaps that contains more information for our debugger.
- Go to
config/index.jsand find thedevtoolproperty. Update it to:
devtool: 'source-map',Make sure you updated both your build and dev configuration!
-
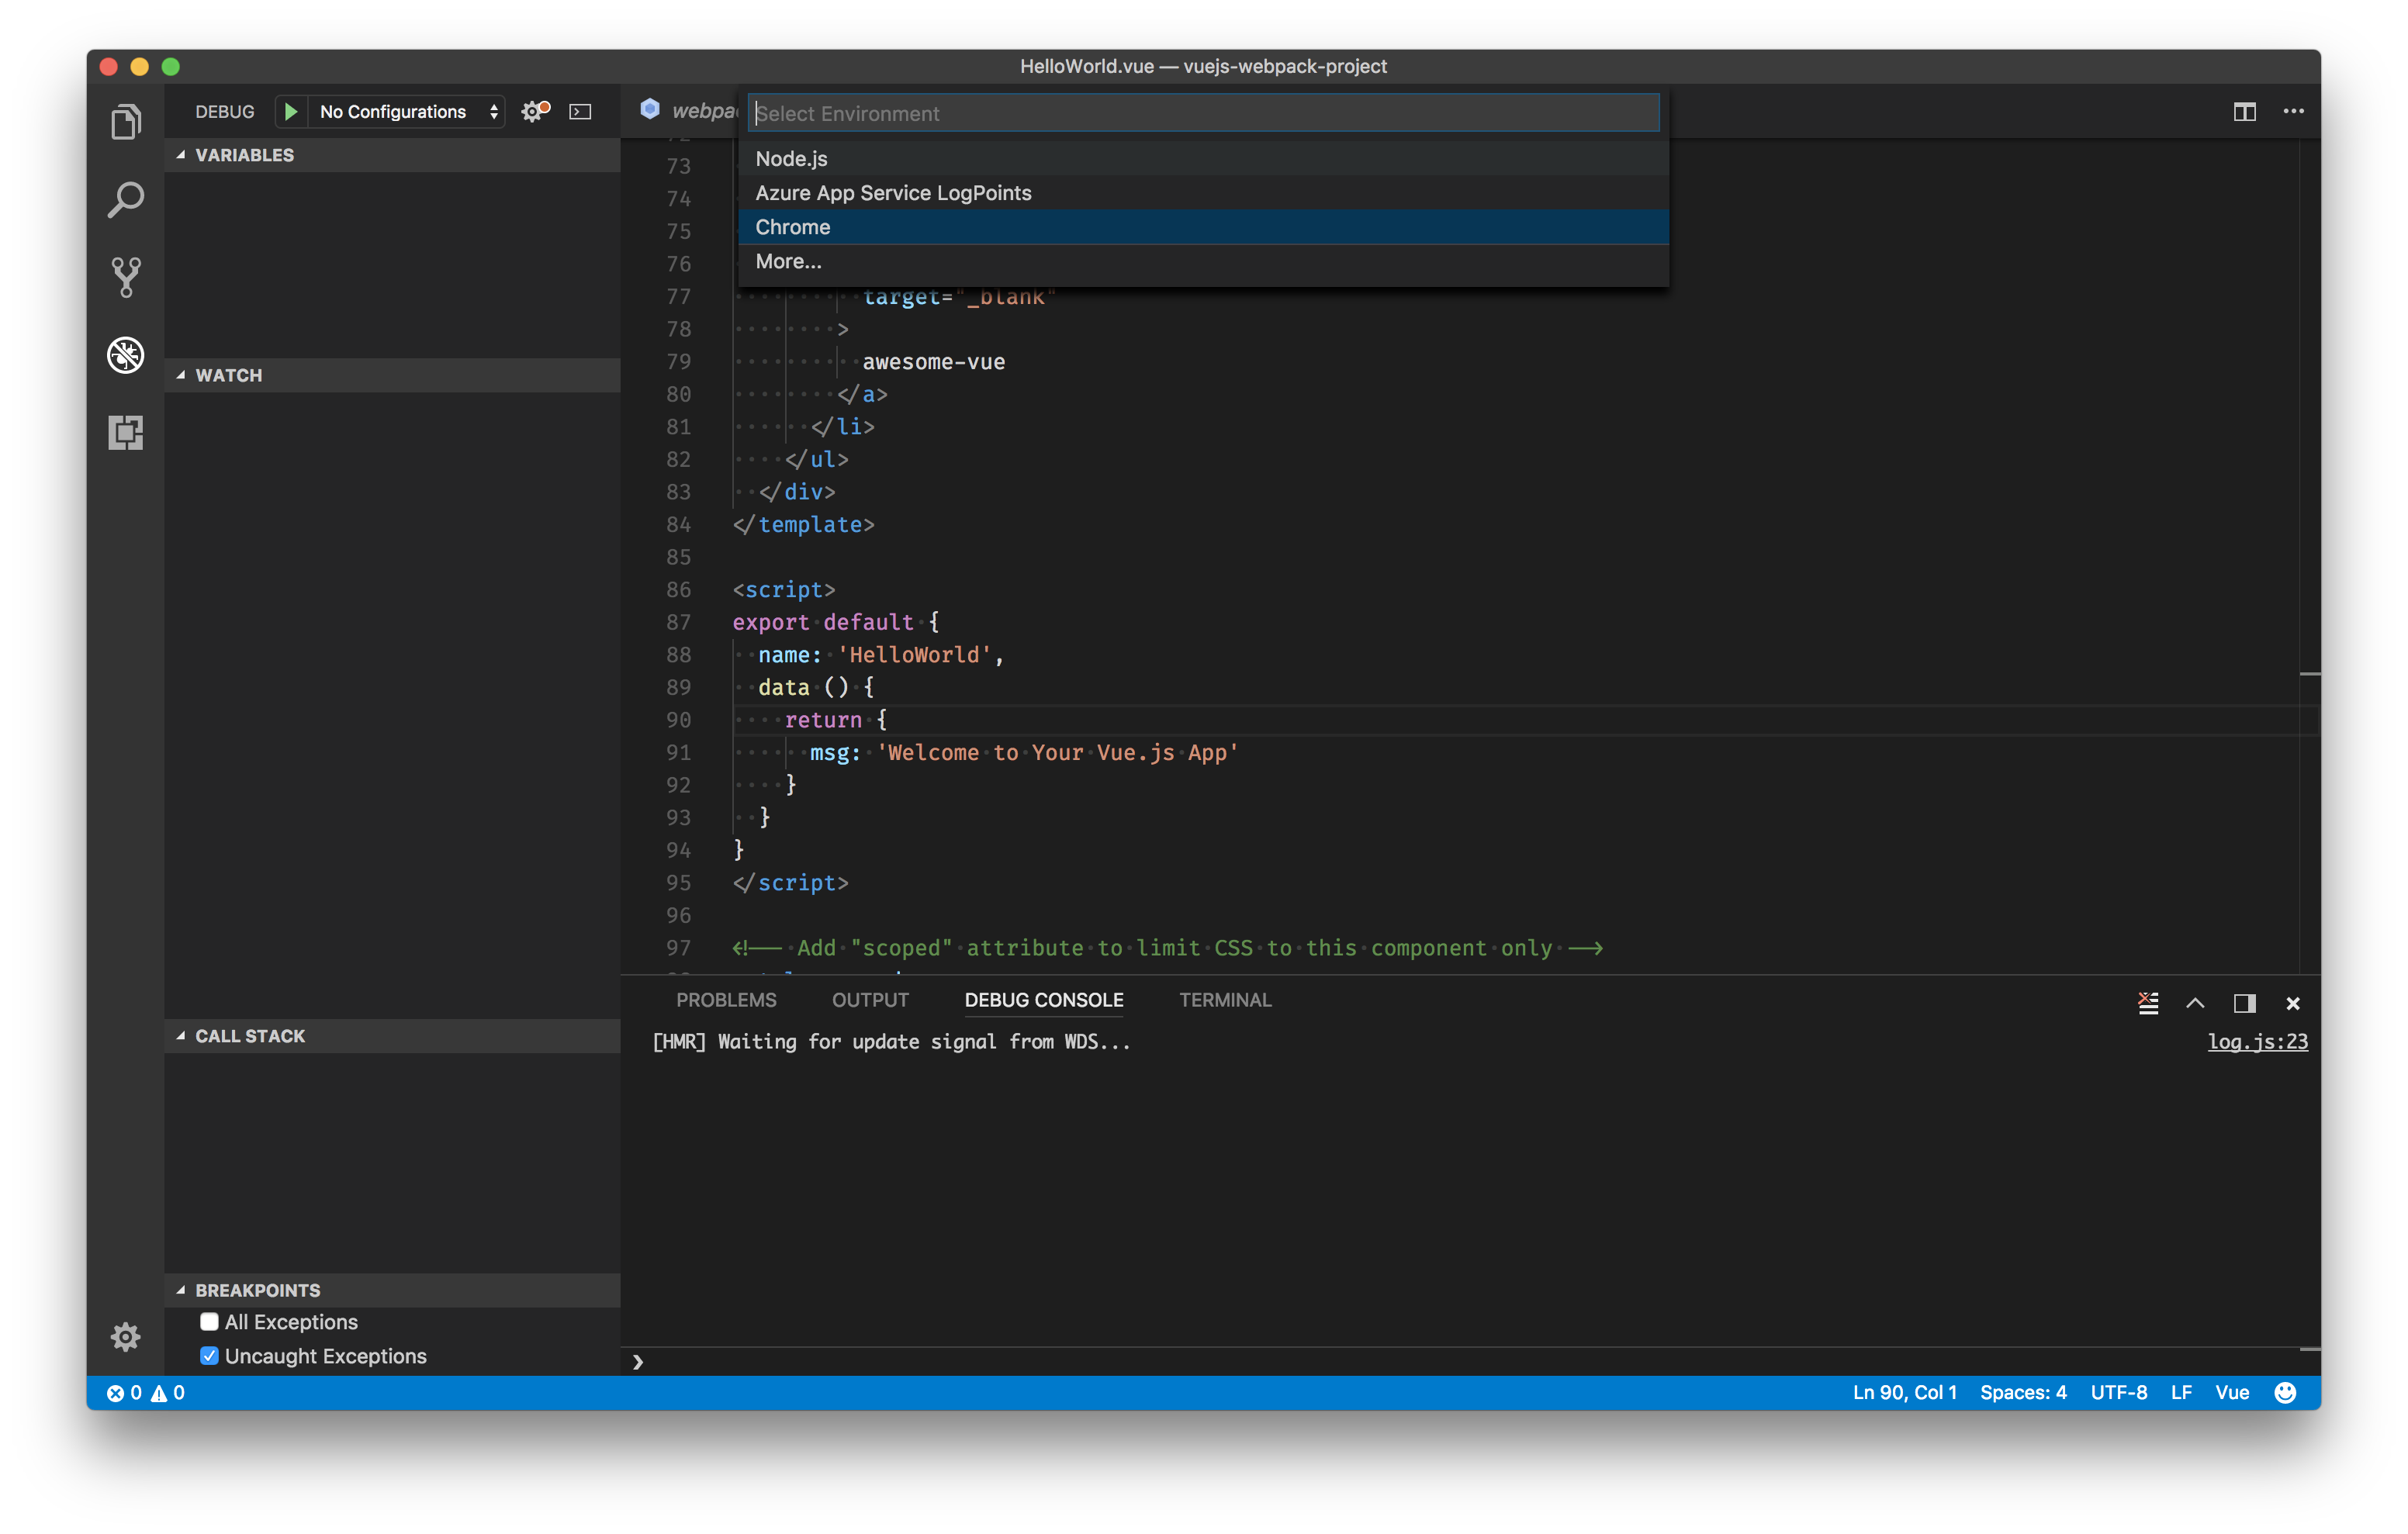
Click on the Debugging icon in the Activity Bar to bring up the Debug view. Then click on the gear icon to configure a launch.json file, selecting Chrome for the environment:
-
Replace content of the generated launch.json with the following two configurations:
  {
    "version": "0.2.0",
    "configurations": [
        {
            "type": "chrome",
            "request": "launch",
            "name": "vuejs: chrome",
            "url": "http://localhost:8080",
            "webRoot": "${workspaceFolder}/src",
            "breakOnLoad": true,
            "sourceMapPathOverrides": {
                "webpack:///src/*": "${webRoot}/*"
            }
        }
    ]
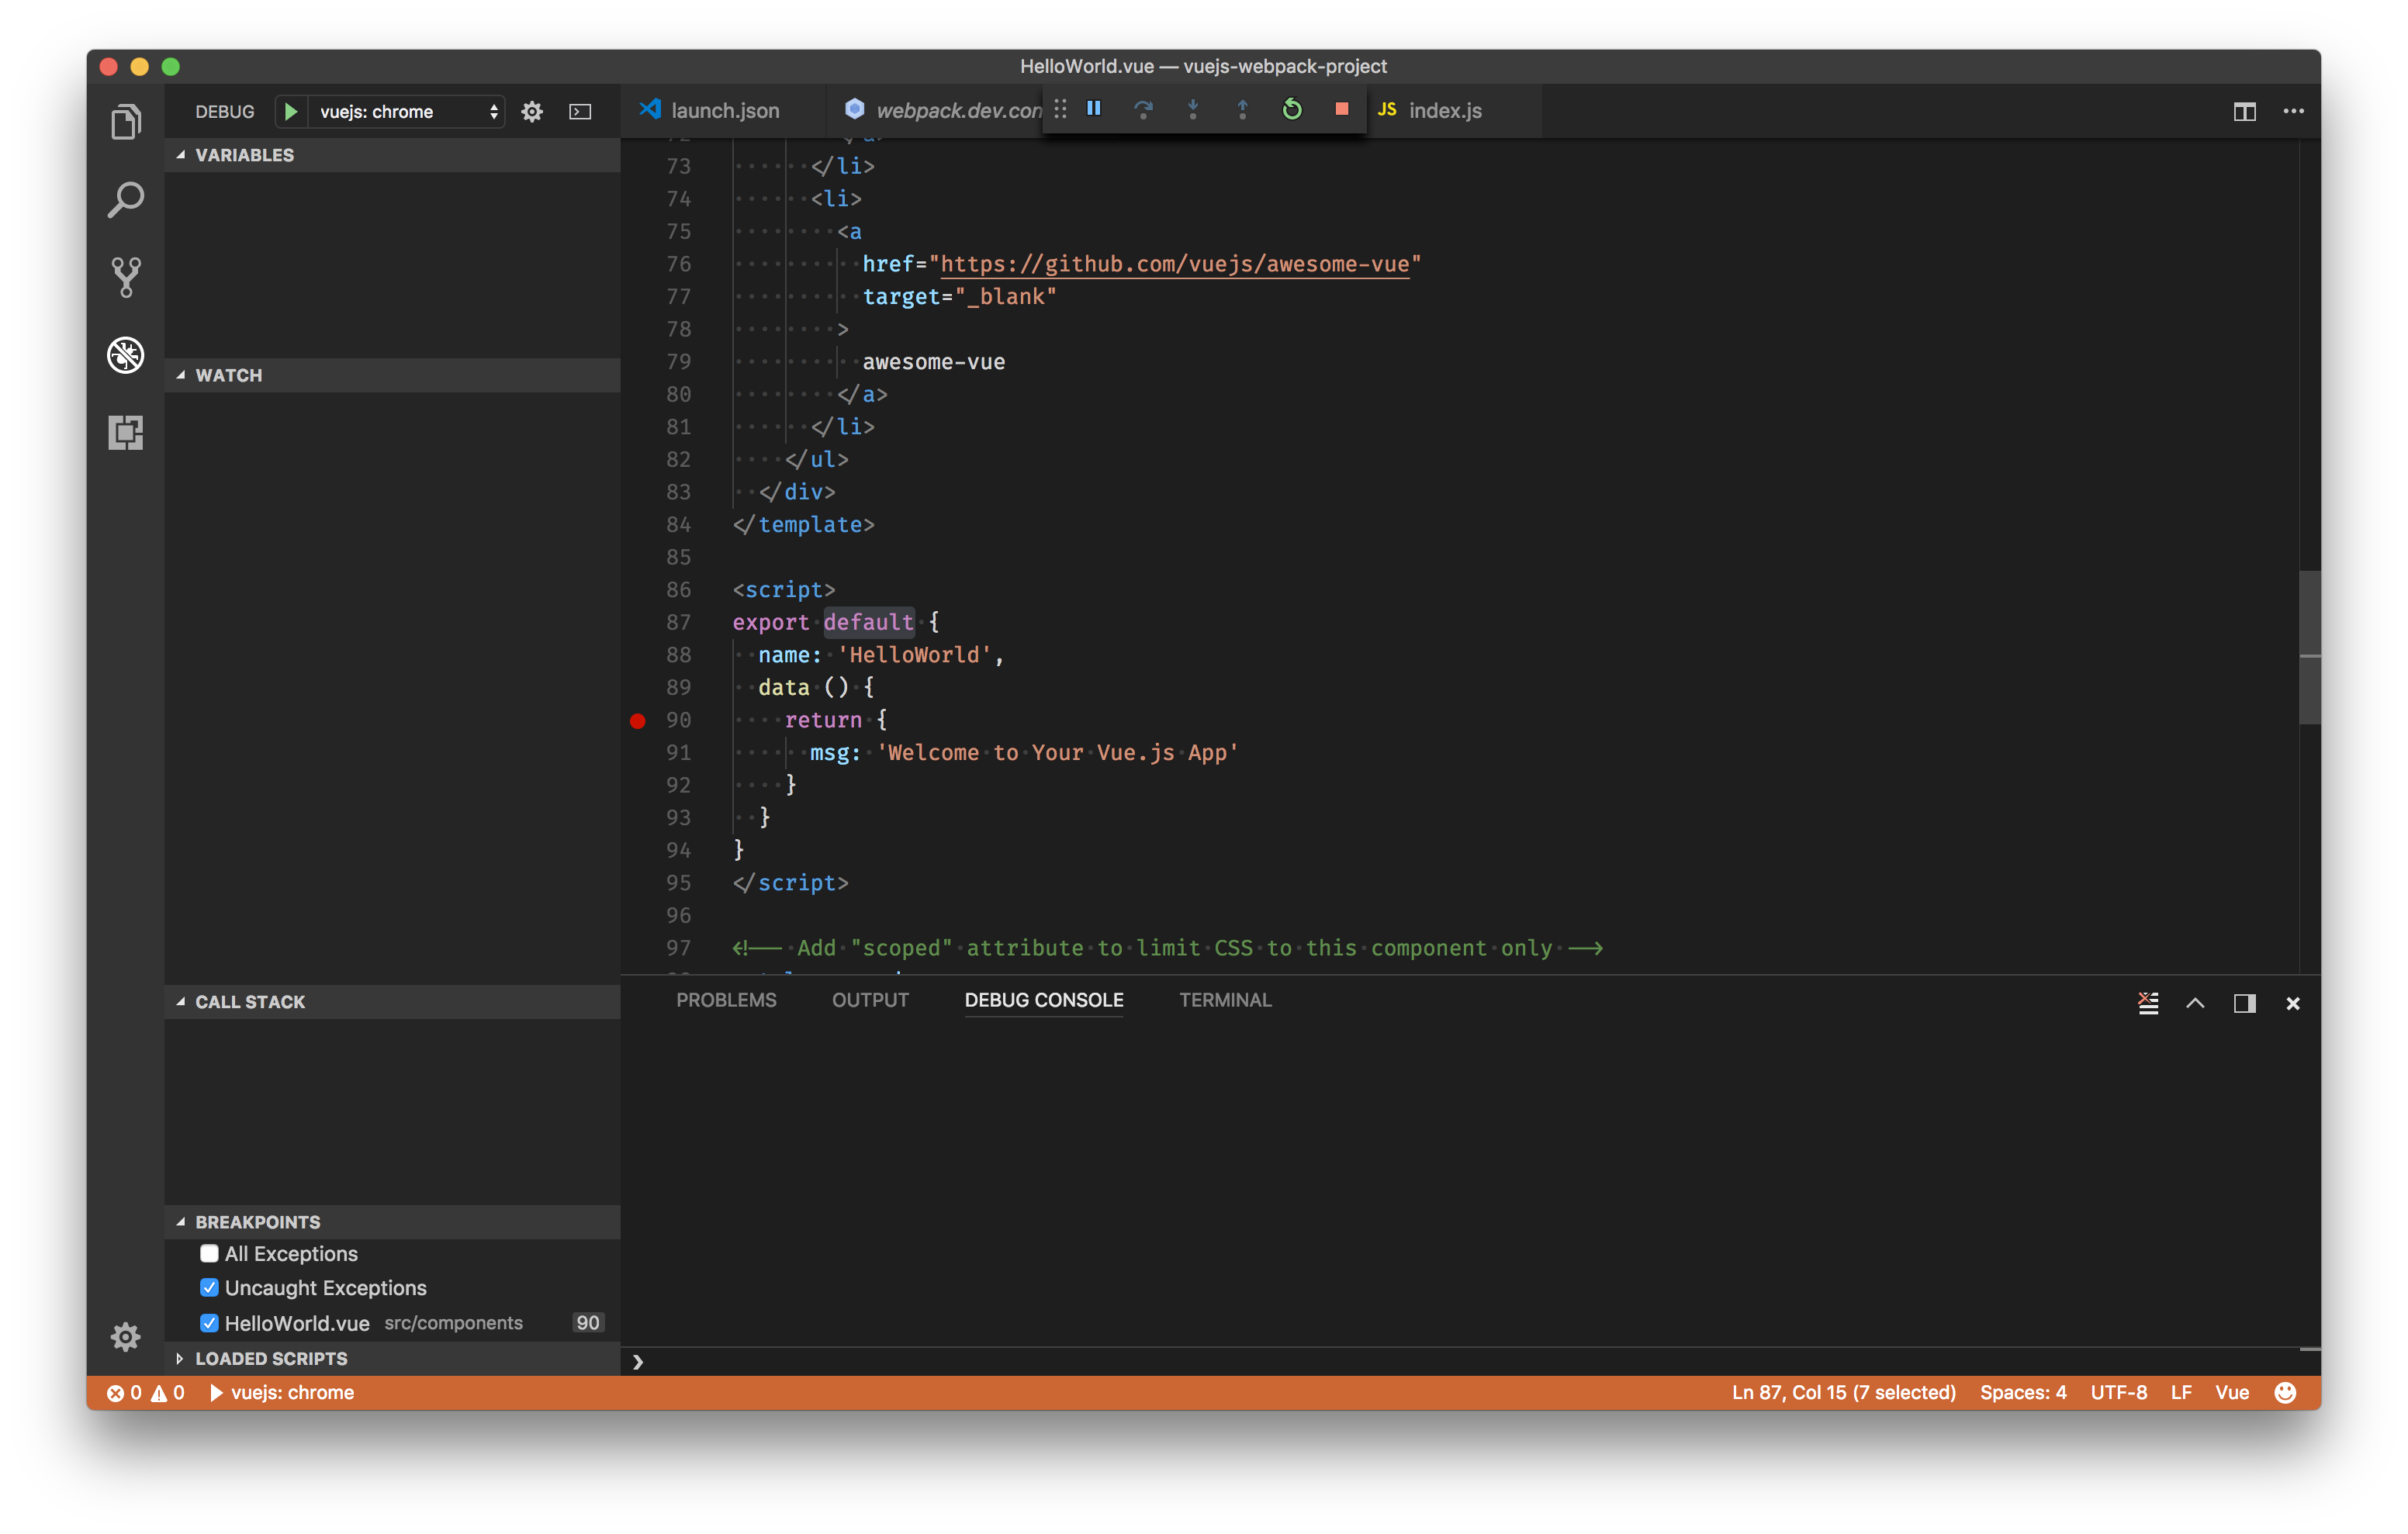
}- Set a breakpoint in src/components/HelloWorld.vue on
line 90where thedatafunction returns a string.
- Open your favorite terminal at the root folder and serve the app using Vue CLI:
npm start
-
Go to the Debug view, select the 'vuejs: chrome' configuration, then press F5 or click the green play button.
-
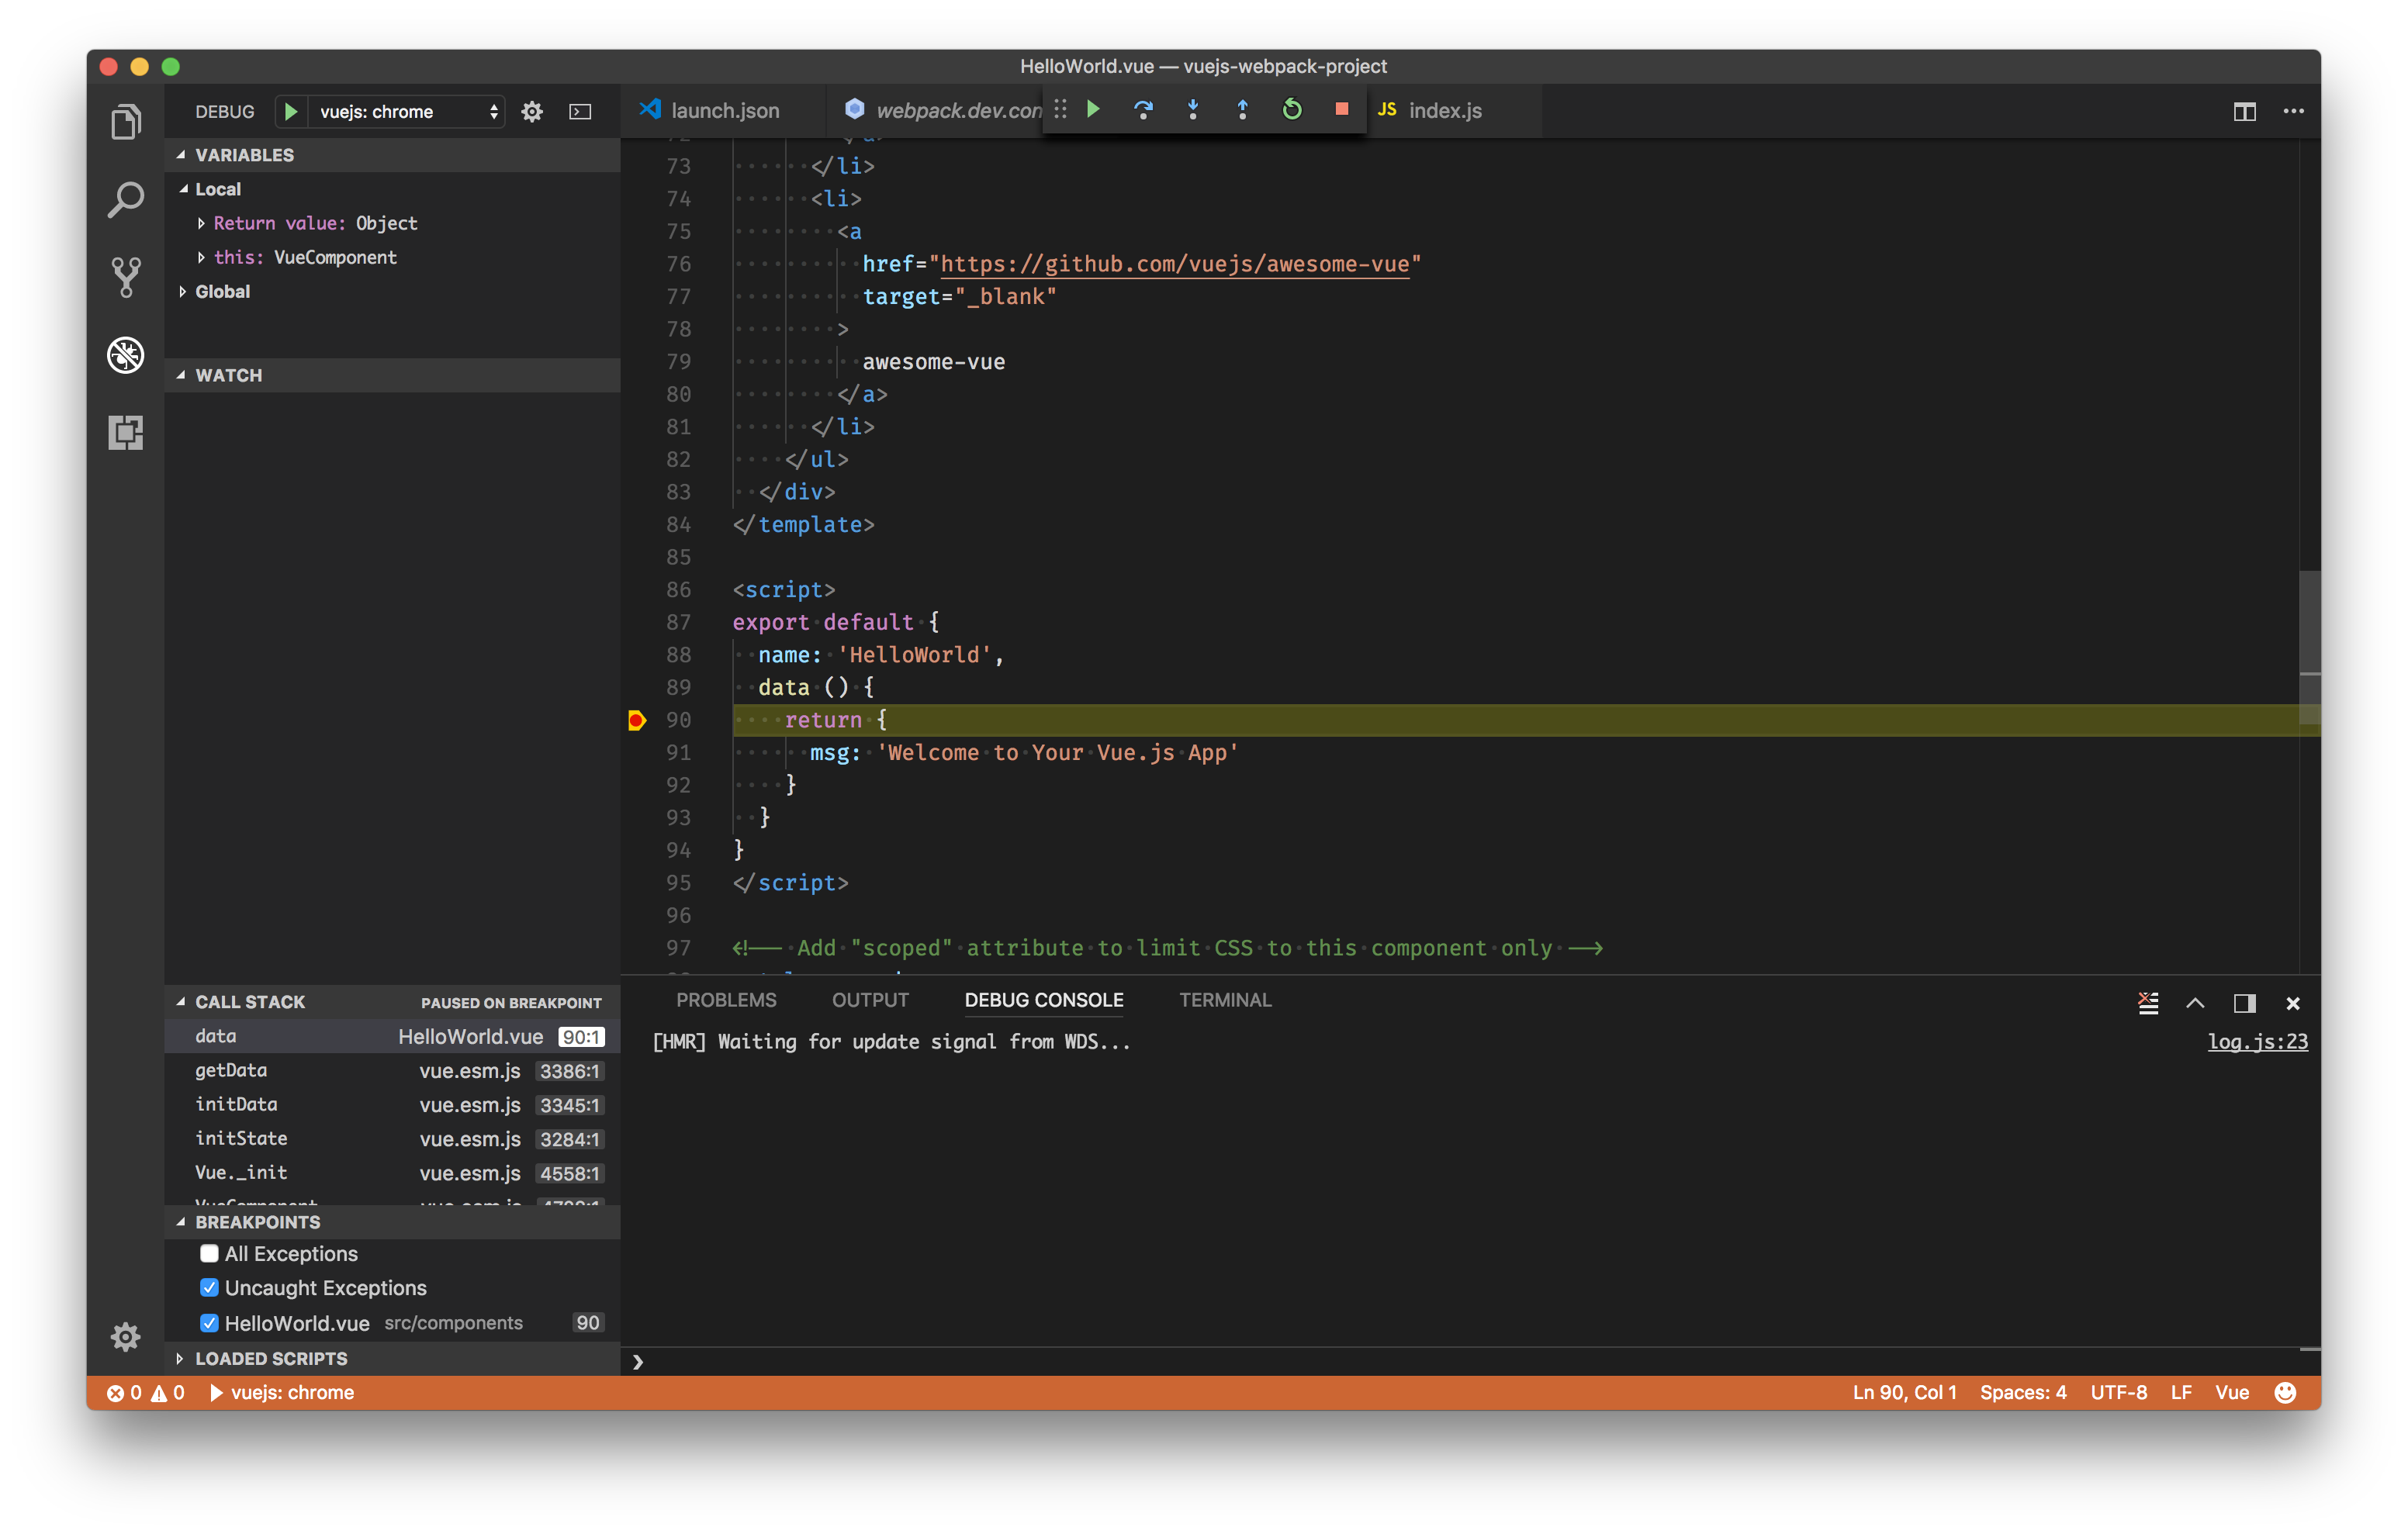
Your breakpoint should now be hit as the new instance of Chrome opens
http://localhost:8080.
- Party 🎉🔥


