< Previous Module - Home - Next Module >
Azure Purview administrators can use Azure Monitor to track the operational state of an Azure Purview account instance. This information, for example, can be the number of scans completed or cancelled. Metrics are collected to provide data points for you to track potential problems, troubleshoot, and improve the reliability of the Purview platform.
- An Azure account with an active subscription.
- An Azure Azure Purview account (see module 01).
- Your subscription must have the Microsoft.Insights resource provider registered.
- View Azure Purview metrics.
- Send Azure Purview diagnostic logs to Azure Storage.
- Provide a User Access to Azure Purview Metrics
- Visualize Azure Purview Metrics
- Send Diagnostic Logs to Azure Storage
Metrics can be accessed from the Azure Portal for an Azure Purview account instance. Access to the metrics can be granted via a role assignment.
- The person who created the Purview account automatically gets permissions to view metrics.
- Other individuals can be provided access by adding them to the Monitoring Reader role.
-
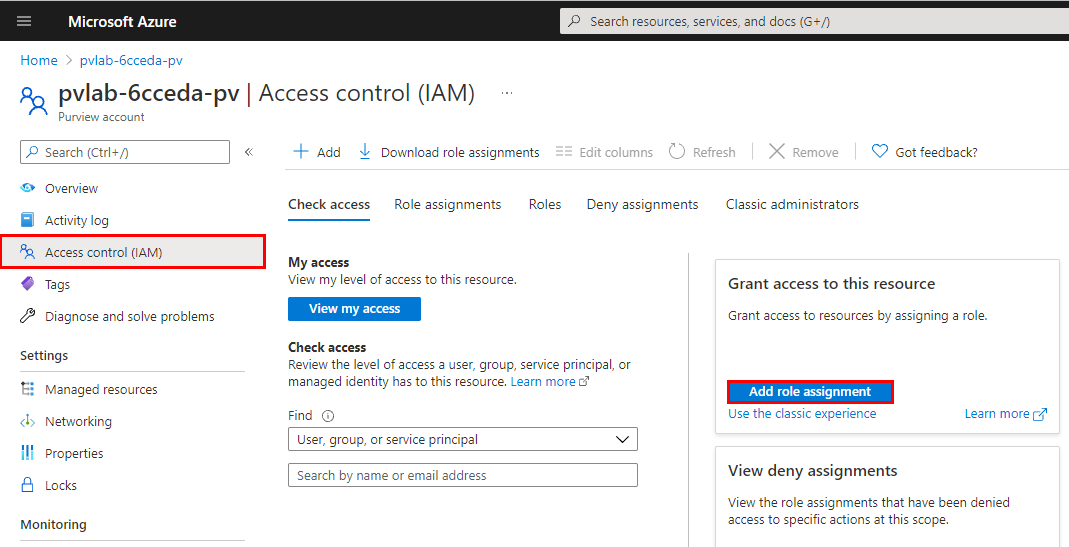
Sign in to the Azure portal, navigate to your Azure Purview account (e.g.
pvlab-{randomId}-pv), select Access Control and click Add role assignment. -
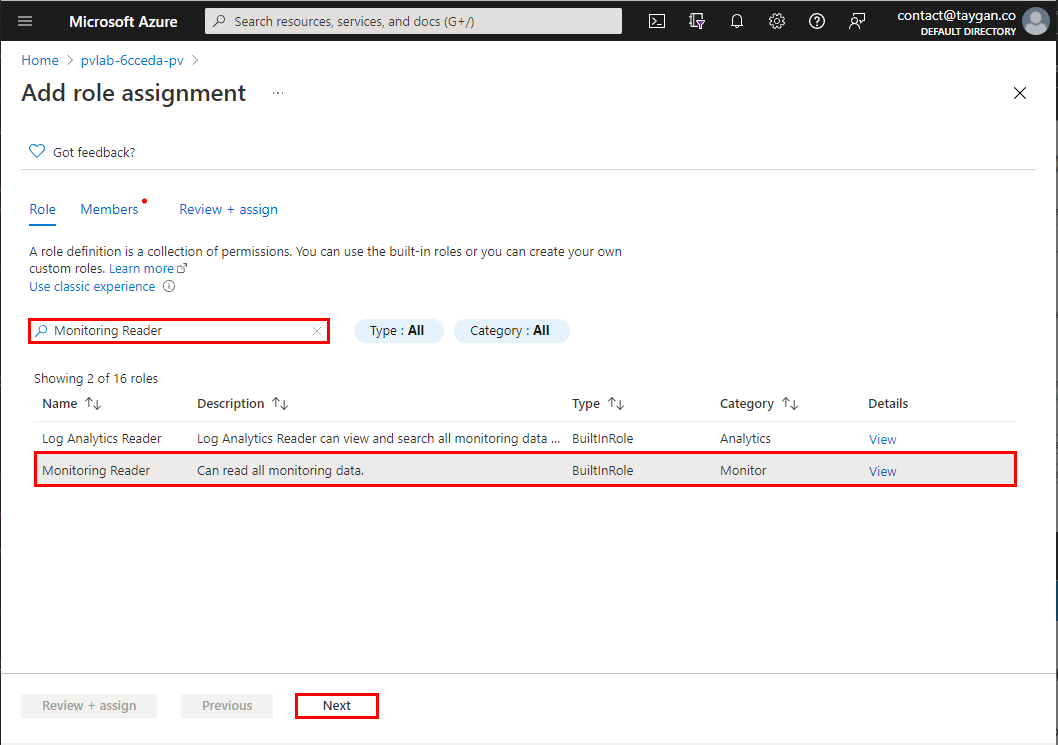
Filter the list of roles by searching for
Monitoring Reader, select the Monitoring Reader role and then click Next. -
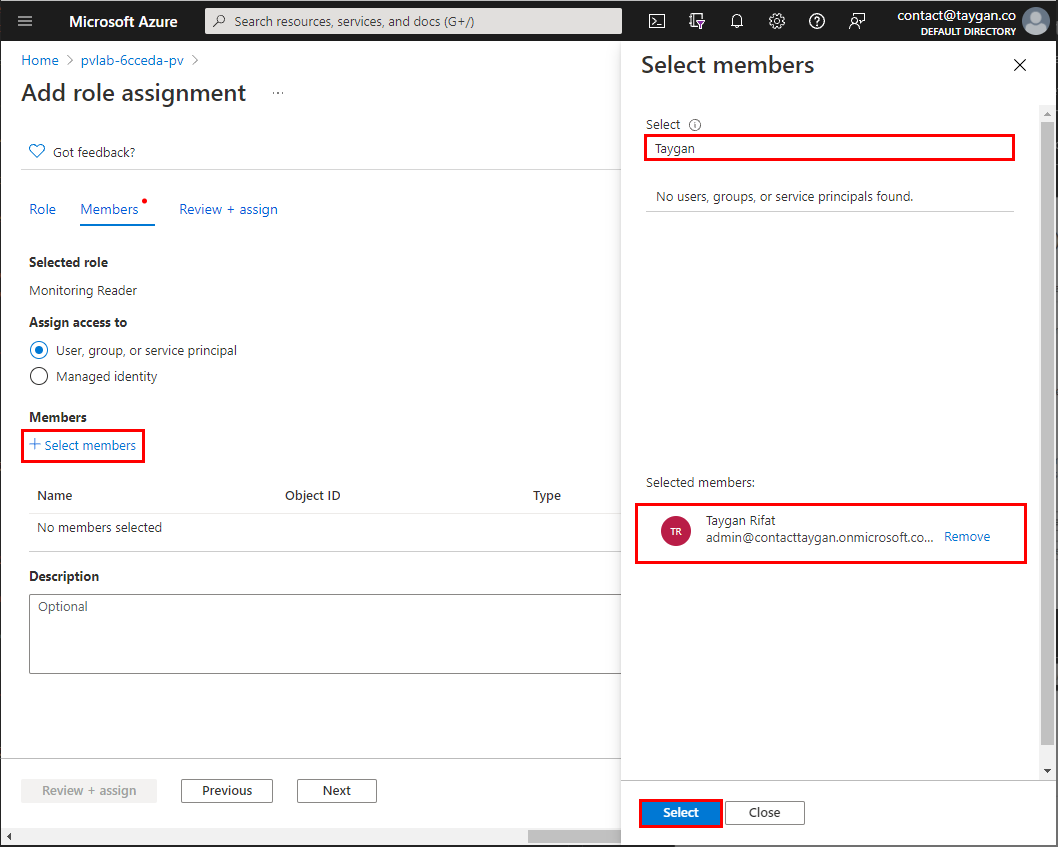
Click Select members, search for a user within your Azure Active Directory, select that user from the list, and then click Select.
💡 Did you know?
Monitoring Reader role can view all monitoring data but cannot modify any resource or edit any settings related to monitoring resources. This role is appropriate for users in an organization such as Azure Purview administrators.
-
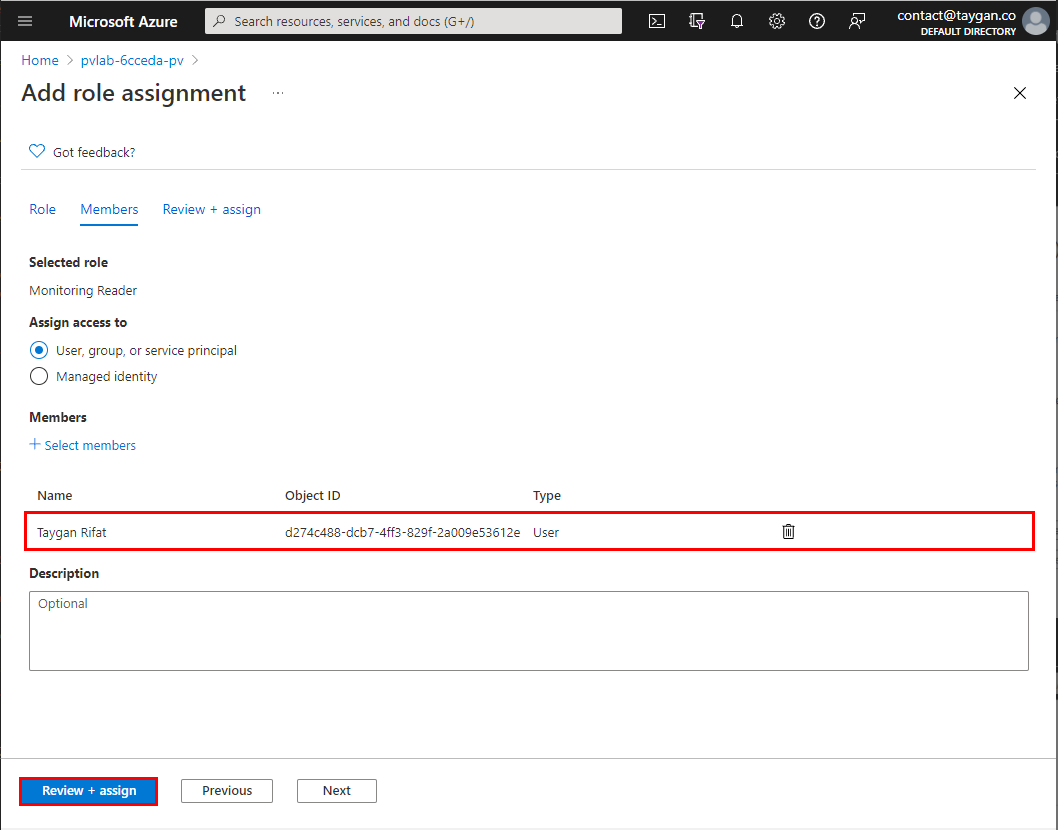
Click Review + assign to progress to the final screen, then click Review + assign once more to add the role assignment.
-
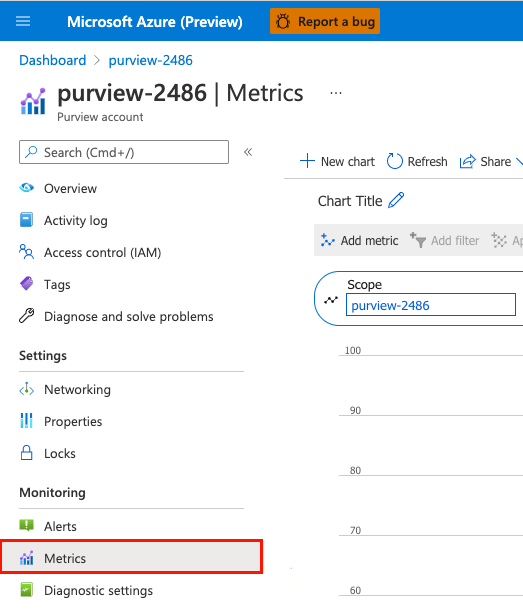
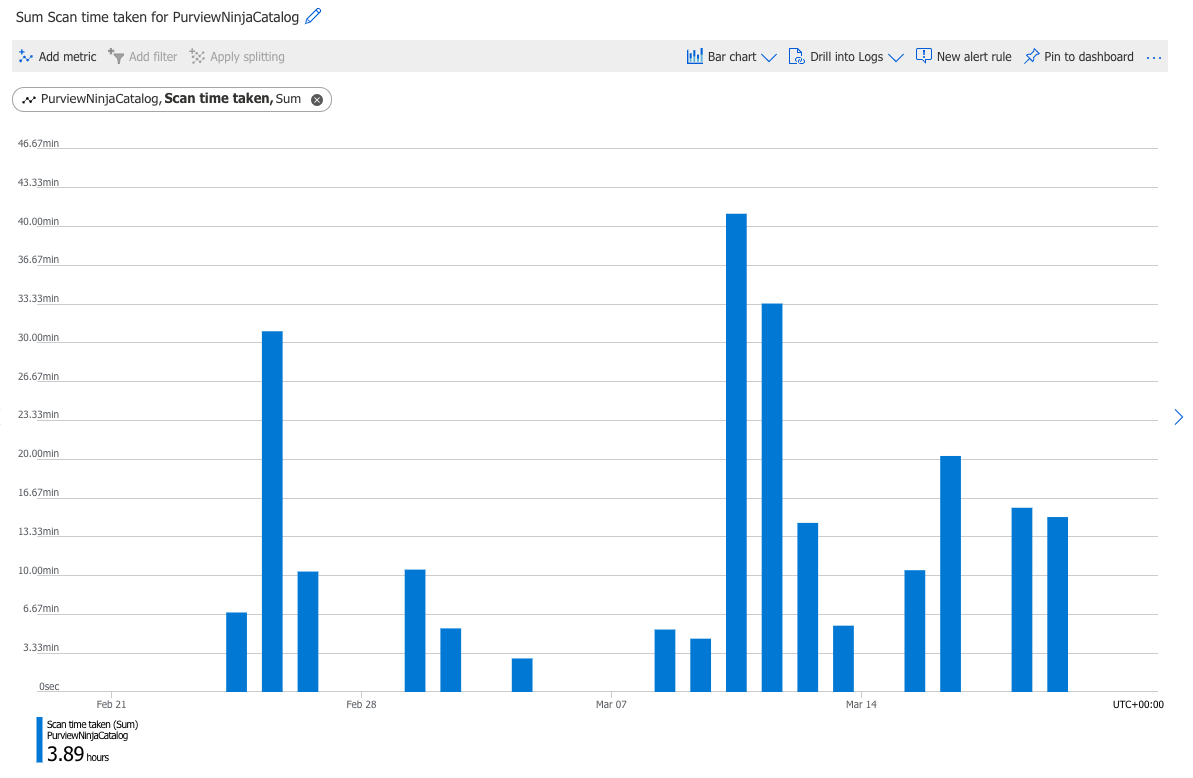
Navigate to your Azure Purview account instance and click Metrics.
-
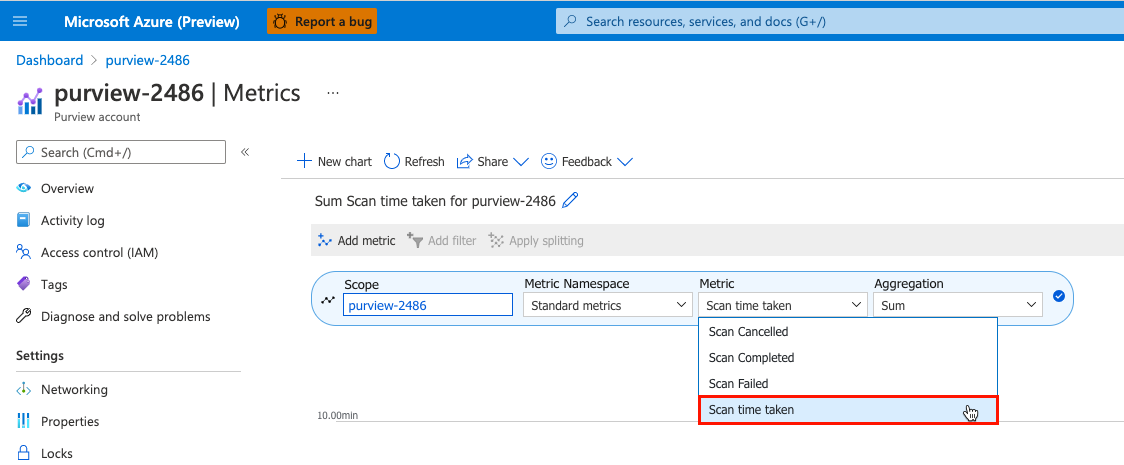
Click to open the Metric drop-down menu and select one of the metrics (e.g.
Scan time taken).Available Metrics
Metric ID Metric Name Metric Description DataMapCapacityUnits Data Map Capacity UnitsIndicates the number of capacity units consumed. DataMapStorageSize Data Map Storage SizeIndicates the data map storage size. ScanCancelled Scan CancelledIndicates the number of scans cancelled. ScanCompleted Scan CompletedIndicates the number of scans completed successfully. ScanFailed Scan FailedIndicates the number of scans failed. ScanTimeTaken Scan Time TakenIndicates the total scan time in seconds. -
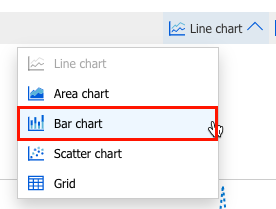
Click on the chart type to change the graph to a Bar chart.
-
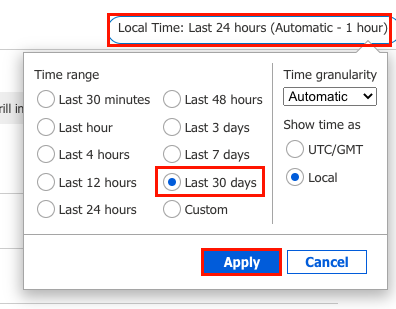
Click on the time range to change the duration to Last 30 Days and click Apply.
-
Below is an example. Note: The account instance would need some historical scan activity in order to visualize the metric.
-
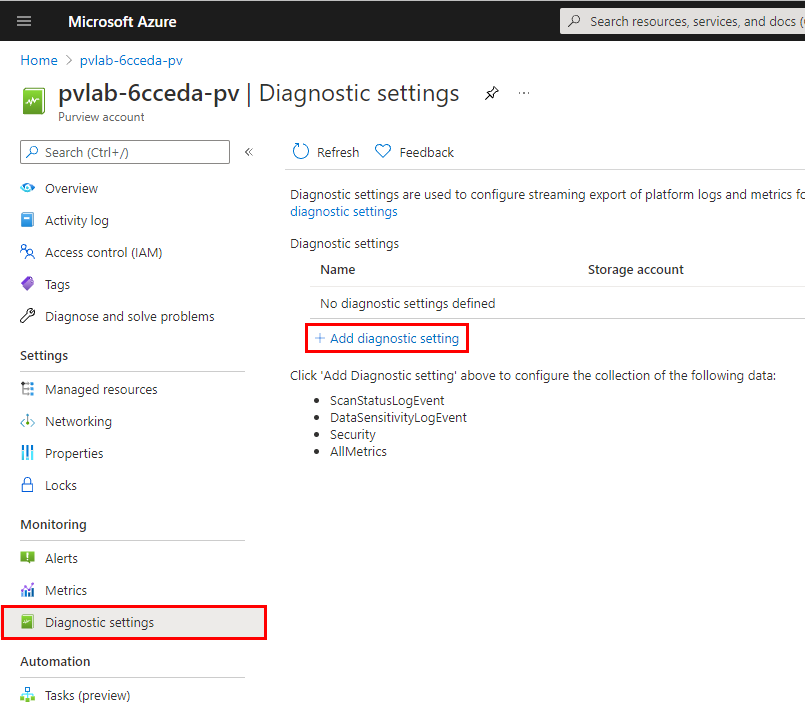
Navigate to your Azure Purview account instance, click Diagnostic settings and select Add diagnostic setting.
💡 Did you know?
Diagnostic settings can be used to send platform logs and metrics to one or more destinations (Log Analytics Workspace, Storage Account, an Event Hub).
-
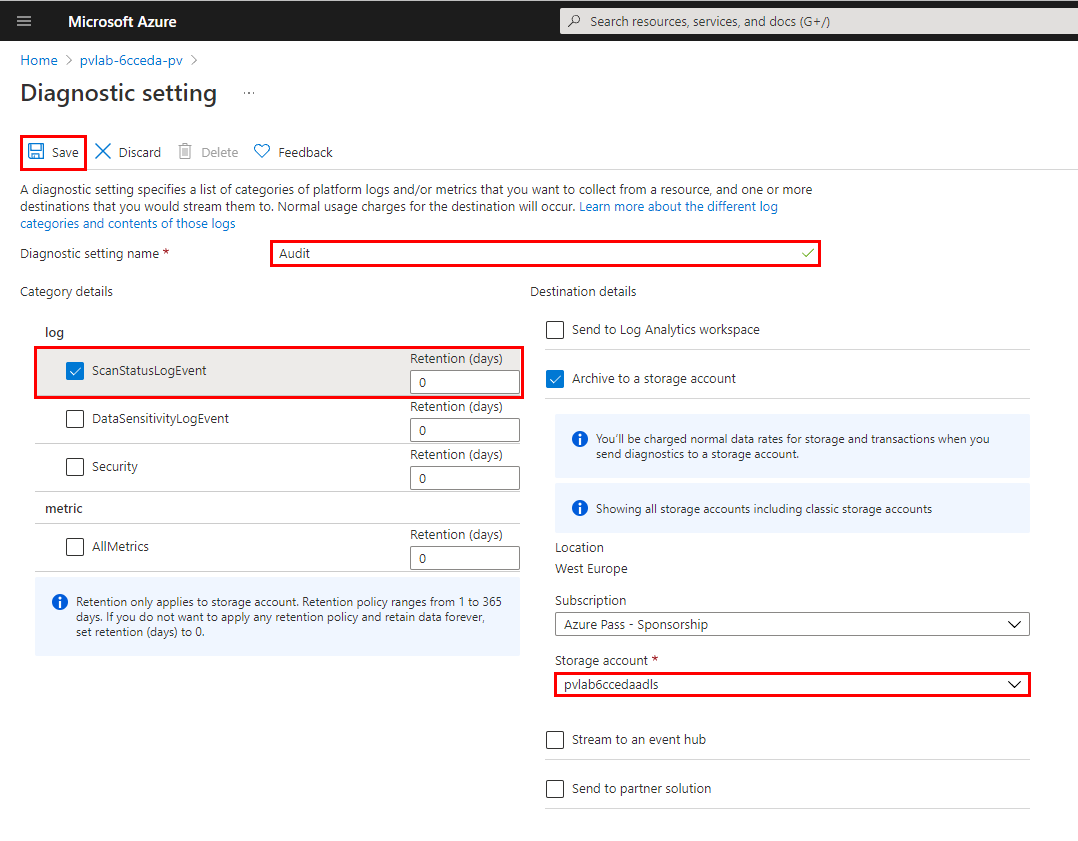
Provide the diagnostic setting a name (e.g.
Audit), select ScanStatusLogEvent, select Archive to a storage account, select an existing storage account (e.g.pvlab{randomId}adls) and click Save.💡 Did you know?
ScanStatusLogEvent tracks the scan life cycle. A scan operation follows progress through a sequence of states, from Queued, Running and finally a terminal state of Succeeded | Failed | Canceled. An event is logged for each state transition.
-
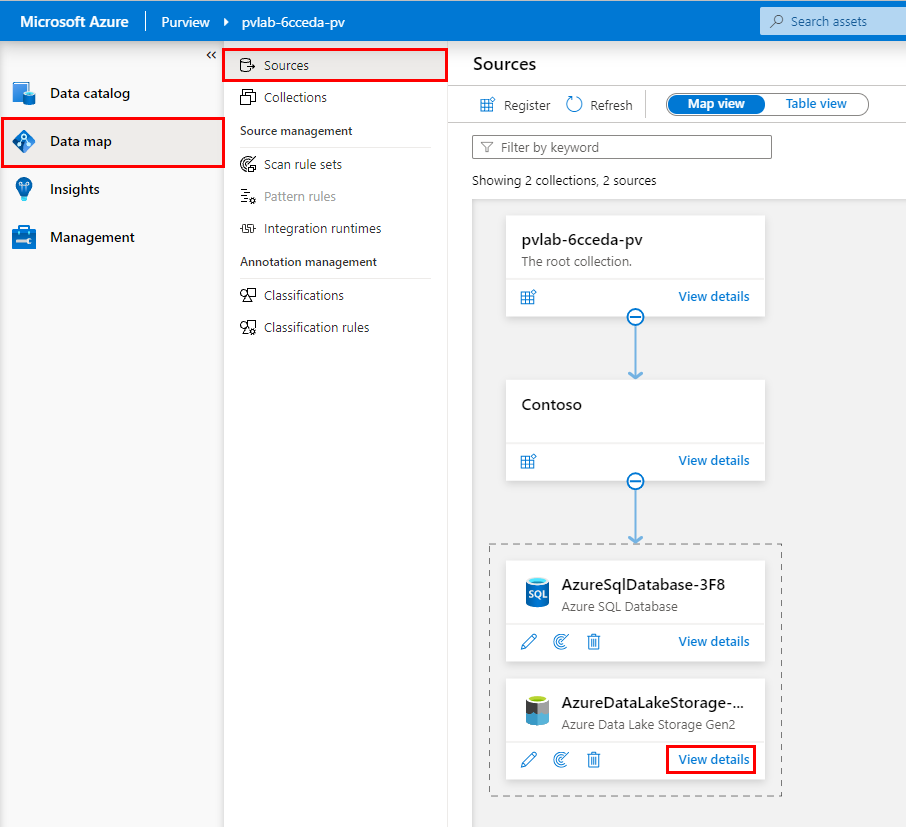
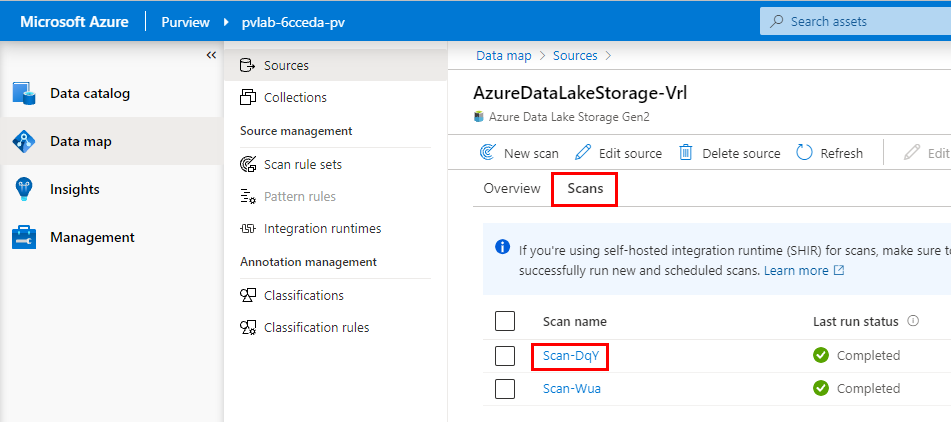
To test the capture of raw events, trigger a full scan by navigating to Azure Purview Studio > Data map > Sources and click View details on an existing source.
-
Navigate to the Scans tab and click the name of a previously run scan.
-
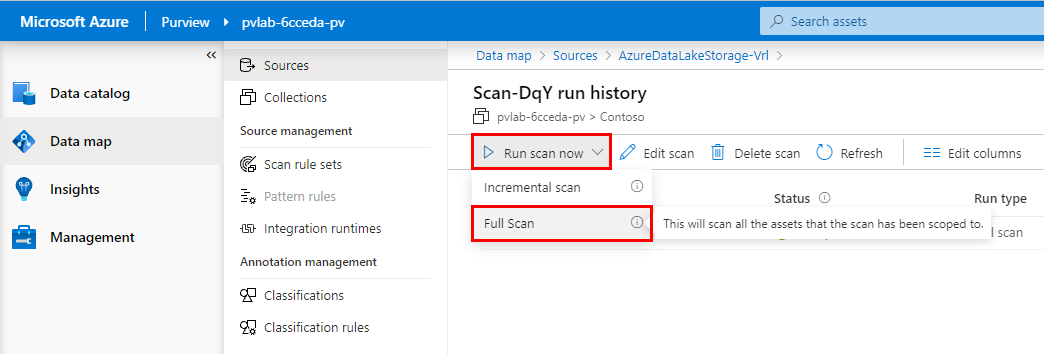
Open the Run scan now drop-down menu and select Full Scan.
-
Monitor the scan status by periodically clicking the Refresh button.
-
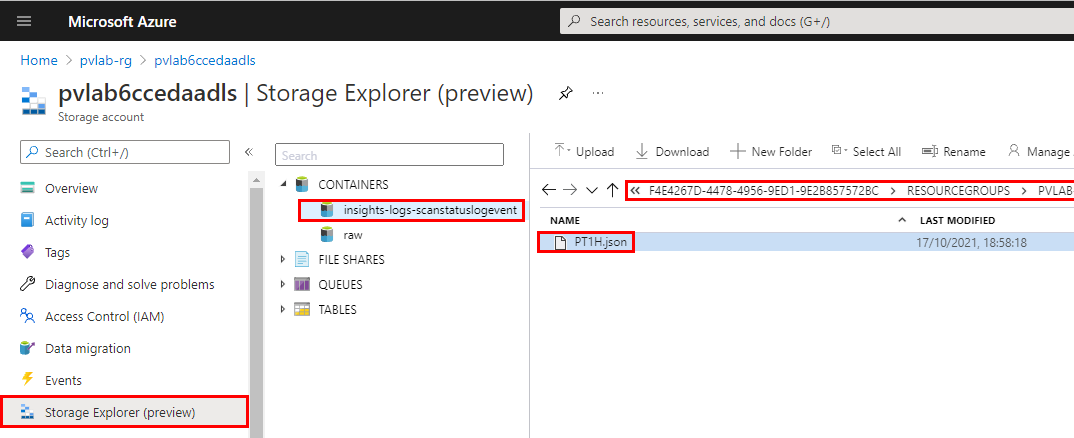
Once the scan is complete, navigate to your storage account within the Azure Portal, select Storage Explorer, expand CONTAINERS and select insights-logs-scanstatuslogevent, navigate down the folder hierarchy until you reach a JSON document (e.g.
PT1H.json). -
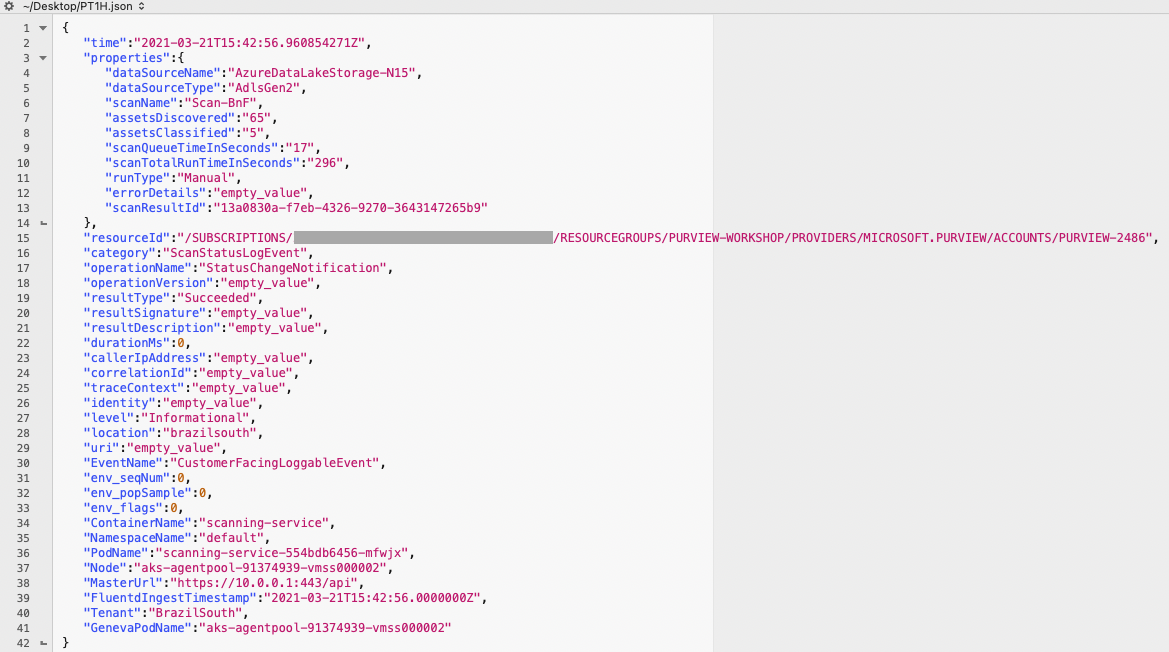
Download and open a local copy of the JSON document to see the details (e.g. dataSourceName, dataSourceType, assetsDiscovered, scanTotalRunTimeInSeconds, etc).
-
Which built-in role is needed to provide users access to view monitoring data?
A ) Purview Data Reader
B ) Metrics Reader
C ) Monitoring Reader -
Which of the following is not available as an Azure Purview metric?
A ) ScanCompleted
B ) ScanDuration
C ) ScanTimeTaken -
The ScanStatusLogEvent schema contains an attribute that indicates the total run time. What is the name of this attribute?
A ) scanTotalRunTime
B ) scanTotalRunTimeInSeconds
C ) scanTotalDuration
This module provided an overview of how to visualize Azure Purview metrics within the Azure Portal and how to capture raw telemetry to an Azure Storage account.
