The ability to monitor TRex performance on many setups/configurations on a daily basis may have a large impact on our ability to identify TRex performance degradation. For a long time our monitoring method was based on hard coded boundaries, we have defined maximum and minimum values for each test/'s result and any exeception triggered a notification. This monitoring method had a lot of false positives which in turn increased the investigation time. Moreover this method introduced more complexity through the need to maintain the golden results for many test cases on various platforms.
A new method was required which would enable us to: 1) Identify performance breakage automatically 2) Report the performance trend on a time basis 3) Explore/query old performance data in a simple manner 4) Collect and extend new fields from our regression setup in a simple manner.
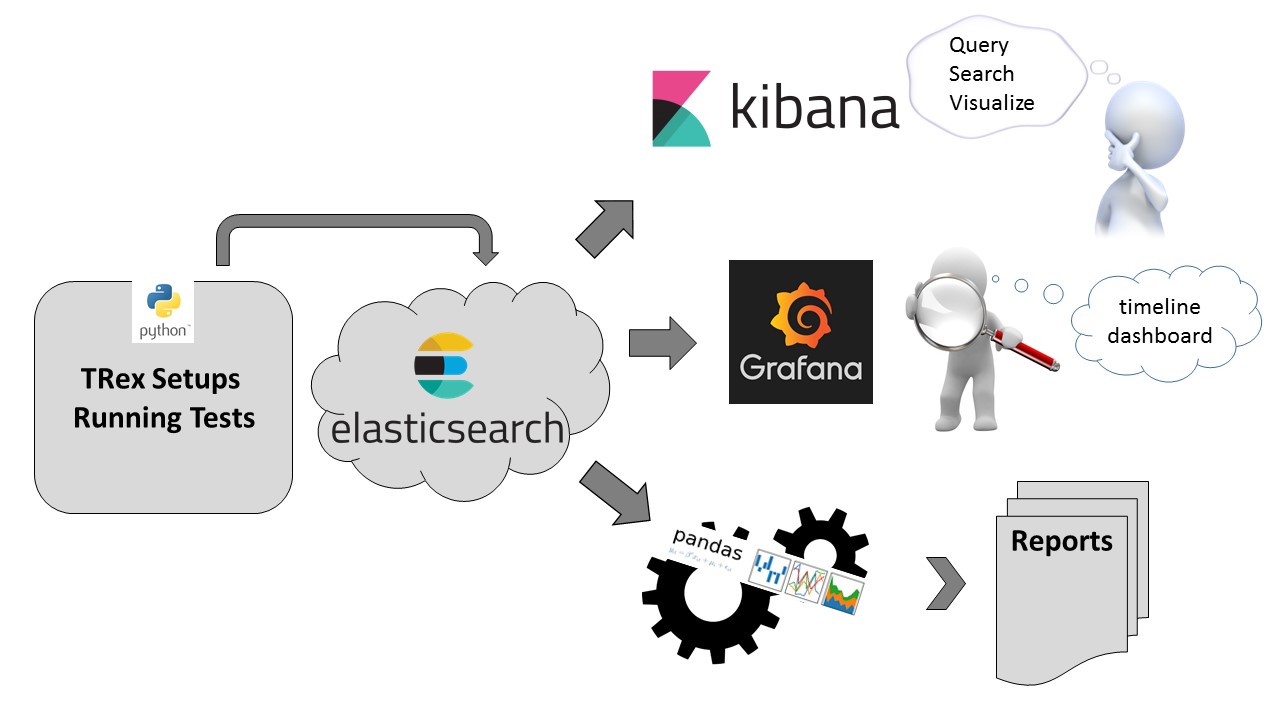
The solution that we chose was to send all the performance results into an elastic search database and analyse it offline using Kibana and Grafana.
This overtime analysis and tracking solution allows us to view the performance results and easily point out abnormal activity, not relying on hard coded boundaries.
Figure 1 contains a block diagram of the new solution.
Figure 1
The following section will describe how we reached the chosen solution.
Figure 2
Prior to using elastic search we tried to use Google Analytics (GA) as a database to store performance results.
GA account gives you an environment for collecting and analyzing data, mostly for marketing, e-commerce and internet traffic usage.
We’ve created a property (GA name for a separated section to collect and analyze data, one account can hold several properties) for collecting the results of our running tests and setups.
GA monitors user activity with websites and applications by collecting various parameters like pageviews (of web pages), referrals (to your website), amount of sessions, users and downloads etc. There’s a general parameter called Events, which lets the user define his points of interest as events. We created some custom metrics and dimensions for our performance tracking.
Sending data to GA is done through an http request to a collection server.
This can easily be automated, therefore we’ve created a python module that handles sending data to GA, Figure 3 depicts a snippet of the python module.
Figure 3
View this on GitHub
The payload is a string which will be sent as the payload of the http request. You can construct payloads and try sending data to GA like shown in figure 4: (more on this: [1])
Figure 4
(We are using "batched reporting", you can batch up to 20 payloads and report all at once)
Each test result is reported to GA using the above code.
More about sending data to GA: [2]
You can use the guides in resource [3] in order to create a request.
The response is simply a JSON that contains the data requested with the applied filters.
After getting the required data, we parse it in order to bring it to a more "comfortable" form for Analysis.
Figure 5 shows an example for a Connection API to GA from a Python script:
Figure 5
View this on GitHub
More on: Google API on Documantation [4]
[From website] "Pandas is an open source, BSD-licensed library providing high-performance, easy-to-use data structures and data analysis tools for the Python programming language"
In a way it is a nice programmable interface that replaces Excel and it includes a few nice Python packages like matplotlib & SciPy.
We’ve created the pandas analysis module to be independent from querying and collecting the data, meaning this module can be used with any other DB for querying. The analysis module uses an input in JSON format to parse and analyze, that’s it.
Test results are placed in pandas DataFrame ordered by date.
DataFrame supports many calculations on the data, and this how we calculate the average, min, max and standard deviation values for every test run.
Figure 6 holds an example for such calculations:
Figure 6
View this on GitHub
We also take the latest test results to publish.
After analyzing all the tests for a given setup, we merge all tests into a single DataFrame which has a column for each test results, like shown in Figure 7.
Figure 7
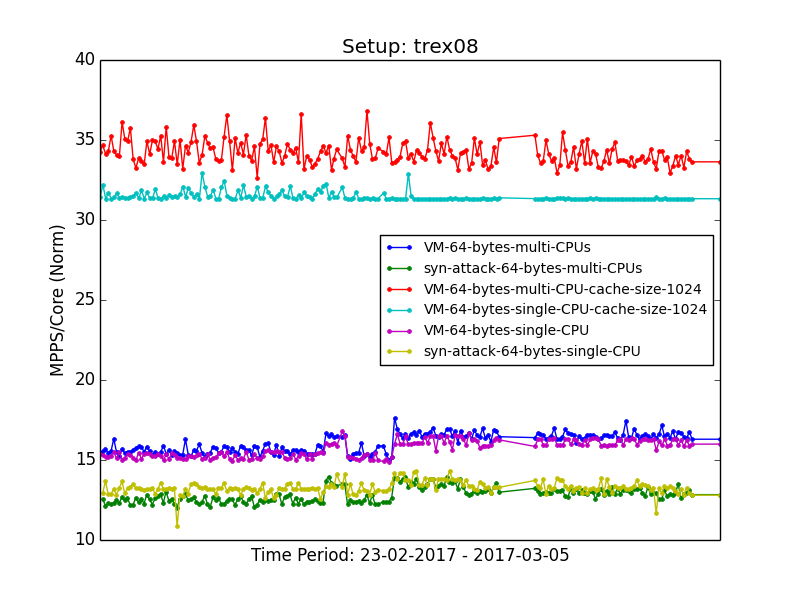
Using the timestamp for each test results, we create a timeline for the plot_date function.
We use pandas pyplot plot_date function to plot the results over time
Figure 8 - plotting results over time
The code in figure 8 turns into this:
Figure 9
Pandas supports exporting the data to csv, in figure 10 you can see the table you see below every graph in our webpage.
This table shows the data we rely on when plotting the trend-line graph (figure 9):
Figure 10
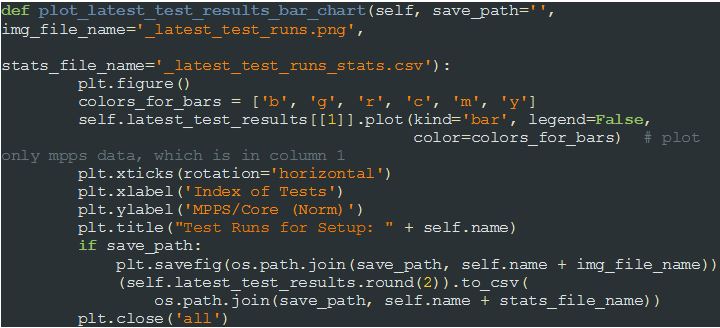
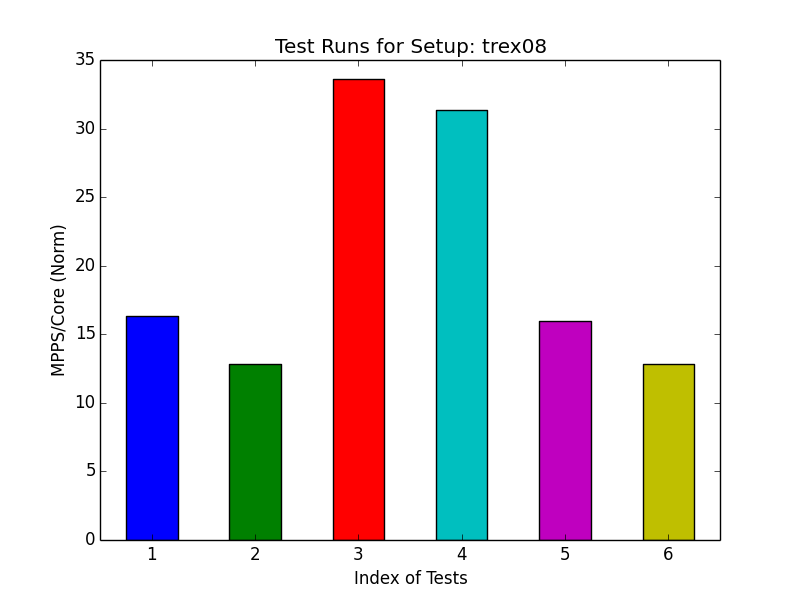
We also plot the latest results we collected from each test as a bar chart (figure 11):
Figure 11 - plotting latest results as bar chart
Figure 12 shows the plot we receive after running the code shown in Figure 11.
Figure 12
Same as before, we export the data to a csv table using the "to_csv" api of pandas (as shown in Figure 8).
The analysis script we just described is generating all the graphs and tables for the asciidoc parser. In Figure 13 we see the asciidoc source file, from which the reports are made. The embedded graphs and tables are circled.
Figure 13
The asciidoc parser creates the report (Figure 14):
Figure 14
full report can be found here ([5])
We have decided to use the elasticsearch suite:
Figure 15: current setup of the analytic module
[From website]" Elasticsearch is a distributed, RESTful search and analytics engine capable of solving a growing number of use cases. As the heart of the Elastic Stack, it centrally stores your data so you can discover the expected and uncover the unexpected"
While GA mostly serves the tracking of user interactions with an application or a website, focusing on e-commerce and marketing, ELK(ElasticSearch/Kibana suit of products) is a data oriented engine designed for speed and simplicity of querying (JSON based). ELK also has a module for online analysis, querying and visualizing the data (called Kibana) and Grafana. Another advantage is that we could extend the fields we send to the ES(ElasticSearch engine) without changing the schema.
Installing is as easy as following these instructions:
ELK [6]
Grafana [7]
For each test a Performance report is created with the results and test parameters.
Figure 16 shows such a report.
Figure 16
This class has a method for sending data to ELK using all the parameters, as you can see in figure 17.
Figure 17
push_data is a method of a class that encapsulates elk_api. es.index is the "add" directive of ELK
Figure 18 - elk api
View this on GitHub
As mentioned, the pandas module requires the data in some structure using JSON format.
The new ELK module just queries the DB and parses the response in order to deliver it to the pandas analysis module.
Figure 19 - elk quering
Why Grafana and not Kibana? While Kibana is good for generic analytics and querying information from ES, Grafana gives you a dashboard of time series streams (performance per setup) which is more suitable ans is easier to use from feature perspective.
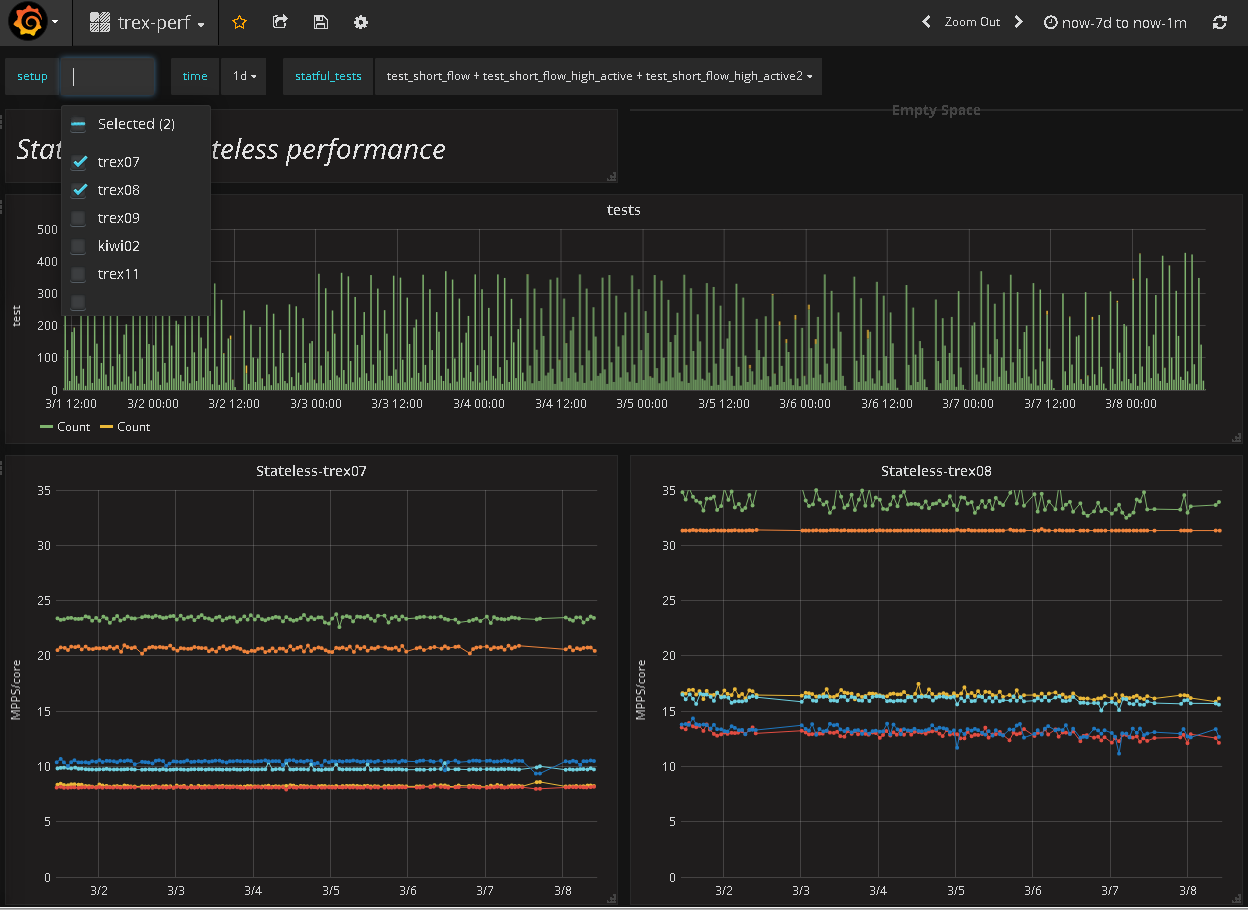
Dashboard for setups/test/ performance
Figure 20 - dashboard examples
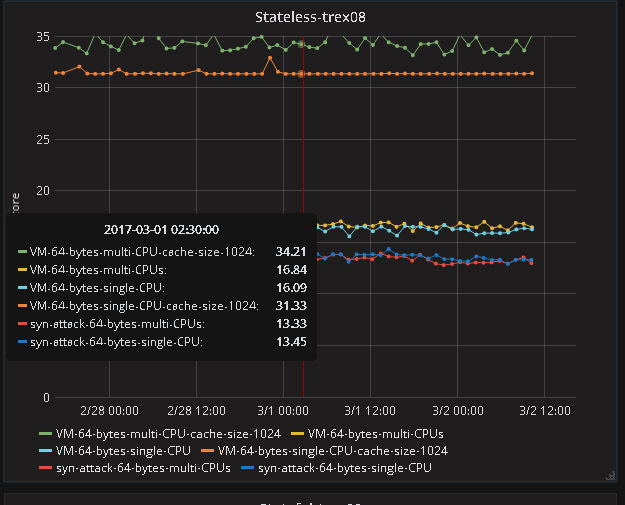
Dashboard for performance- zoom in into one setup
Figure 21- zoom on a setup
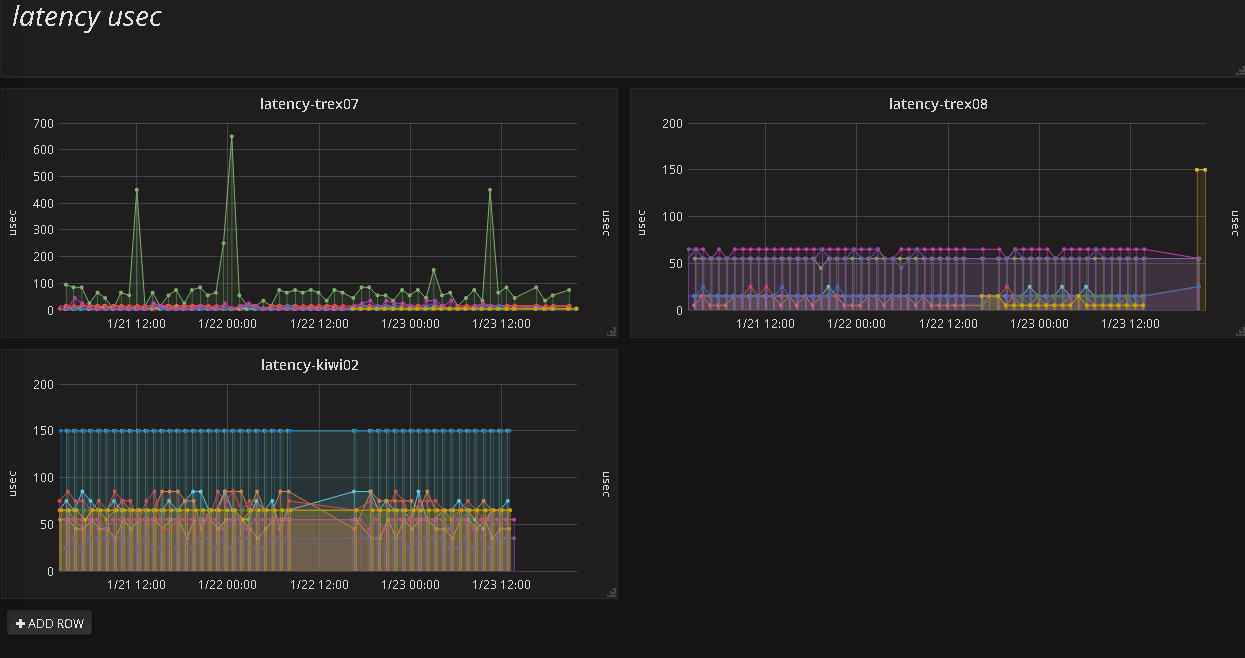
Dashboard for setups/test/ latency
Figure 22 - additional information about a setup
Let’s see if we answered the requirements using the described chosen solution
-
Identify performance breakage automatically
Not yet, but we could do it with Pandas in nightly script
-
Report the performance trend on a time basis
Yes
-
Explore/query old performance data in a simple manner
Yes, using Kibana (raw data) and Grafana (time-series)
-
Collect and extend new fields from our regression setup in a simple manner
Yes, using simple python ES API
[1] Google Analytics hit builder:
https://ga-dev-tools.appspot.com/hit-builder/
[2] Sending data to Google Analytics https://developers.google.com/analytics/devguides/collection/analyticsjs/sending-hits
https://developers.google.com/analytics/devguides/collection/analyticsjs/events#overview
[3] Guides for creating a request to Google Analytics
https://developers.google.com/analytics/devguides/reporting/core/v4/rest/v4/reports/batchGet#MetricType
https://developers.google.com/analytics/devguides/reporting/core/v4/basics
[4] Google API Documentation https://developers.google.com/analytics/devguides/reporting/core/v3/quickstart/service-py
[5] TRex website: published reports
https://trex-tgn.cisco.com/trex/doc/trex_analytics.html
[6] ELK installation
https://www.elastic.co/downloads/elasticsearch
[7] Grafana installation
http://docs.grafana.org/
[8] All the above code can be found in out github repository:
https://github.com/cisco-system-traffic-generator/trex-core/tree/master/doc
[9] pandas doc:
http://pandas.pydata.org/
[10] Our analytic reports on our website:
https://trex-tgn.cisco.com/trex/doc/trex_analytics.html


