This is a detailed guide on how to set up validator monitoring for Cosmos-based blockchains using Prometheus and Grafana. This guide is for validators who need to set up basic monitoring of their nodes. This manual does not cover all possible monitoring options. To set up deeper monitoring, it is recommended to refer to the official documentation.
First, we need to set up the Prometheus server. It will collect all the node monitoring parameters. Prometheus is a database that feeds various diagnostic parameters in near real time. To install the Prometheus server, it is strongly recommended to allocate a separate server, of course, you can run it along with other programs, but the performance of such a system may be impaired. It is strongly not recommended to run Prometheus on the same server as a sentry or validator, as this will lead to unnecessary load on the server, and the lack of system resources in turn will lead to block skipping. First of all, let's start the installation by updating the OS and installing security software: fail2ban It won't solve every possible security problem, but it's better than doing nothing at all.
sudo apt-get update -y && sudo apt-get upgrade -y && sudo apt install fail2ban -y
During the installation of updates to these packages, you may occasionally see a purple screen. Just press the ENTER button. After updating the Linux OS, create the prometheus user that will be used to run Prometheus.
sudo groupadd --system prometheus

sudo useradd -s /sbin/nologin --system -g prometheus prometheus
Let's remove everything unnecessary, and then download and install Prometheus.
sudo mkdir /var/lib/prometheus
for i in rules rules.d files_sd; do sudo mkdir -p /etc/prometheus/${i}; done
mkdir -p /tmp/prometheus && cd /tmp/prometheus
curl -s https://api.github.com/repos/prometheus/prometheus/releases/latest | grep browser_download_url | grep linux-amd64 | cut -d '"' -f 4 | wget -qi -
//or if the download fails
wget https://github.com/prometheus/prometheus/releases/download/v2.32.1/prometheus-2.32.1.linux-amd64.tar.gz

tar xvf prometheus*.tar.gz
cd prometheus*/
sudo mv prometheus promtool /usr/local/bin/
If you have successfully completed all the previous steps, you will see the version numbers of installed programs: Prometheus and Promtool
prometheus --version
promtool --version
Let's move some files like this:
While in the tmp folder, run
sudo mv prometheus.yml /etc/prometheus/prometheus.yml
sudo mv consoles/ console_libraries/ /etc/prometheus/
Now that all the preparatory work is done, you can set up Prometheus as a service so that it runs all the time!
sudo tee /etc/systemd/system/prometheus.service<<EOF
[Unit]
Description=Prometheus
Documentation=https://prometheus.io/docs/introduction/overview/
Wants=network-online.target
After=network-online.target
[Service]
Type=simple
User=prometheus
Group=prometheus
ExecReload=/bin/kill -HUP \$MAINPID
ExecStart=/usr/local/bin/prometheus \
  --config.file=/etc/prometheus/prometheus.yml \
  --storage.tsdb.path=/var/lib/prometheus \
  --web.console.templates=/etc/prometheus/consoles \
  --web.console.libraries=/etc/prometheus/console_libraries \
  --web.listen-address=0.0.0.0:9090 \
  --web.external-url=
SyslogIdentifier=prometheus
Restart=always
[Install]
WantedBy=multi-user.target
EOF
Arranging access rights:
for i in rules rules.d files_sd; do sudo chown -R prometheus:prometheus /etc/prometheus/${i}; done
for i in rules rules.d files_sd; do sudo chmod -R 775 /etc/prometheus/${i}; done
sudo chown -R prometheus:prometheus /var/lib/prometheus/
Tell systemctl that we created the Prometheus service, add a symbolic link, run it and check the logs
sudo systemctl daemon-reload
sudo systemctl enable prometheus
sudo systemctl start prometheus
sudo systemctl status prometheus
If Prometheus is running successfully, you should see a status screen that looks like this. Press CTL+C to exit the systemctl status screen.
Let's increase the server's security level a little more and turn on the firewall. If you are using the standard port 22 for SSH then it will be available and will be able to connect. If you are using a non-standard port for SSH, then change the command below to include the port, otherwise it will block access to the server.
sudo ufw allow proto tcp from any to any port 22
sudo ufw allow proto tcp from any to any port 9090
sudo ufw enable
If you have successfully reached this point, then you have a working Prometheus server. We will return later in the manual to its additional configuration. In the meantime, install the Grafana server
The next step is to launch a Grafana instance which will allow you to visualize data in Prometheus from your computer and more importantly from your smartphone! Now you have a chance not to sit constantly at the computer terminal.
It is recommended to run a separate server for Grafana. Ultimately, Grafana will provide a web server to the public internet, and you are unlikely to want to pair it with your Prometheus server. If it is possible to install these two servers on the same local network, then this solution would be preferable. In this case, you can connect them privately without having to use the public Internet.
Once we set up the Grafana server, we will also update it and install fail2ban. Again, this server is open to the internet, so consider additional security measures such as multi-factor authentication and no root login.
sudo apt install fail2ban -y
Now install some dependencies for Grafana
sudo apt-get install -y apt-transport-https
sudo apt-get install -y software-properties-common wget
wget -qO - https://packages.grafana.com/gpg.key | sudo apt-key add -
Now update your package repos
echo "deb https://packages.grafana.com/enterprise/deb stable main" | sudo tee -a /etc/apt/sources.list.d/grafana.list
Install Grafana and upgrade your packages
sudo apt-get update -y && sudo apt-get install grafana-enterprise -y && sudo apt-get upgrade -y
Now let's start Grafana as a service:
sudo systemctl daemon-reload
sudo systemctl enable grafana-server
sudo systemctl start grafana-server
sudo systemctl status grafana-server
If the installation was successful, you will see the following picture on the screen. Press CTL+C to exit the systemctl status screen.
Just like the Prometeus server, let's configure the firewall. If you are not using port 22 then change the below command otherwise you will block access to your server.
sudo ufw allow proto tcp from any to any port 22
sudo ufw allow proto tcp from any to any port 3000
sudo ufw enable
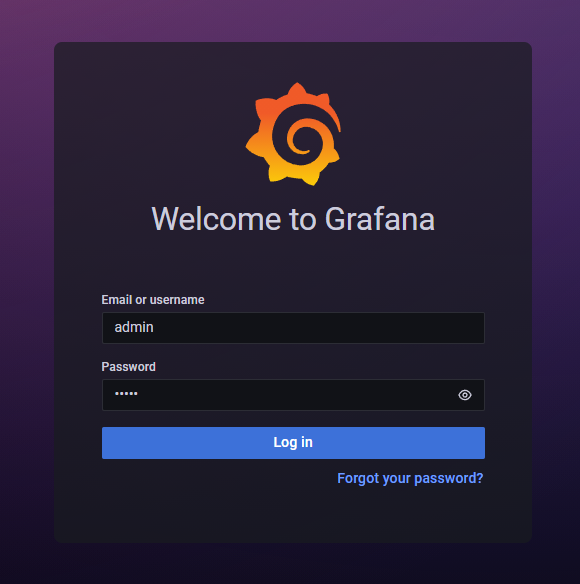
Now open a web browser and navigate to http://your.grafana.ip.address:3000 and you should see the Grafana logo start to bounce as the page loads. Your username is admin and your password is admin. If you don’t see the screen below, then your firewall is probably not open on port 3000 or you made a mistake somewhere in the previous steps.
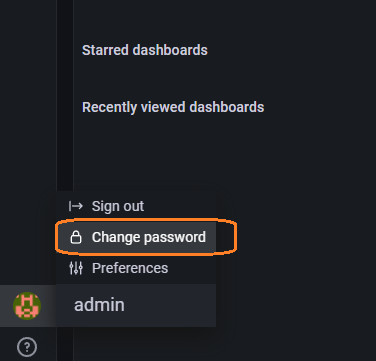
Once you log in, click on the little avatar icon on the bottom left of the screen and then change your password. Please do this.
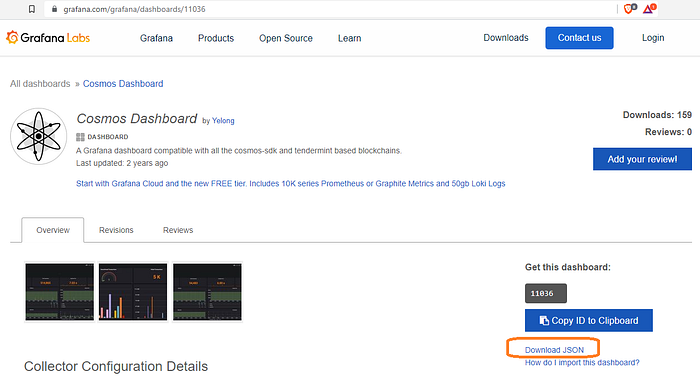
After changing your password, open a new browser window and go here to download the standard Cosmos SDK Grafana toolbar. You need to download the JSON file.
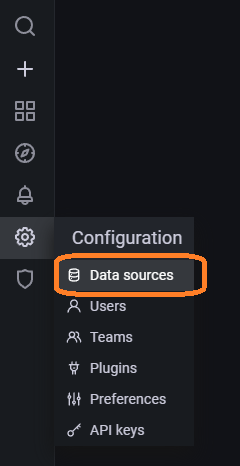
Go back to the Grafana page and then click on Configuration and then Data Sources
Now click on Add data source then select the Prometheus data source.
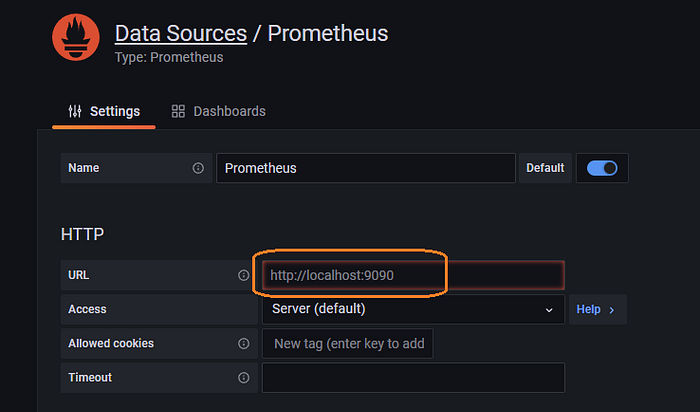
Now enter the IP address with port 9090. If you decided to run Prometheus and Grafana on the same server that’s fine. Just remember that we told you not to. Go ahead with http://localhost:9090
If you went the path of having two servers, then enter the Prometheus IP address. For example http://150.220.60.42:9090
Scroll to the bottom and click the Save & test button.
If you entered the correct IP and your Prometheus firewall is open on port 9090 then you will see a connection success indicator.
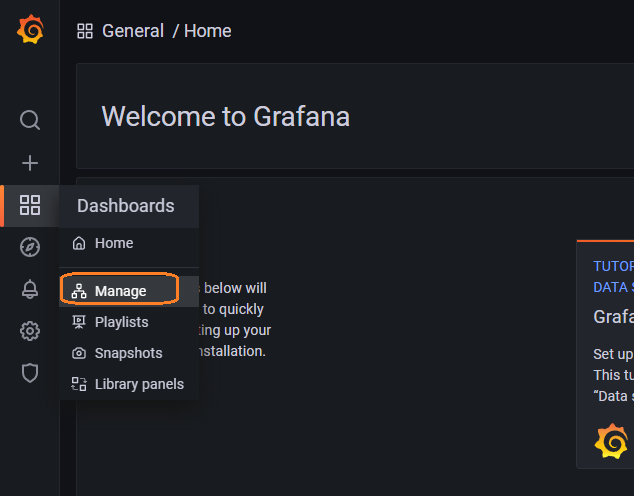
Ok, that was fun. Now click on Dashboardand then Manage
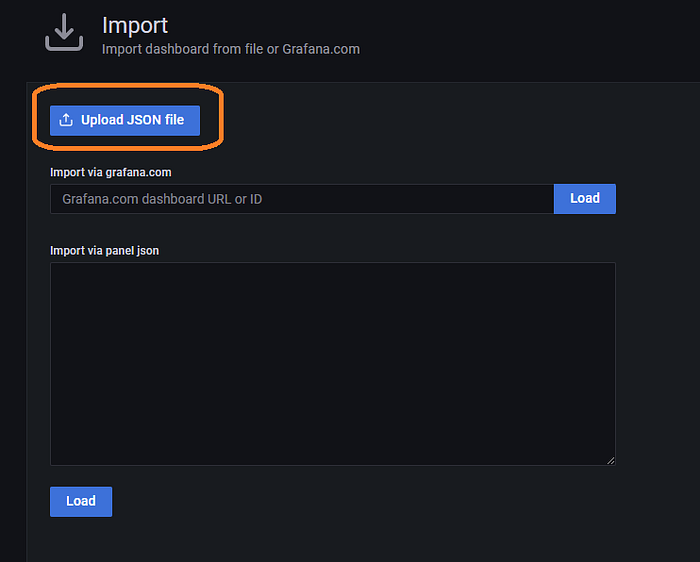
Now click on Import and then Upload JSON File
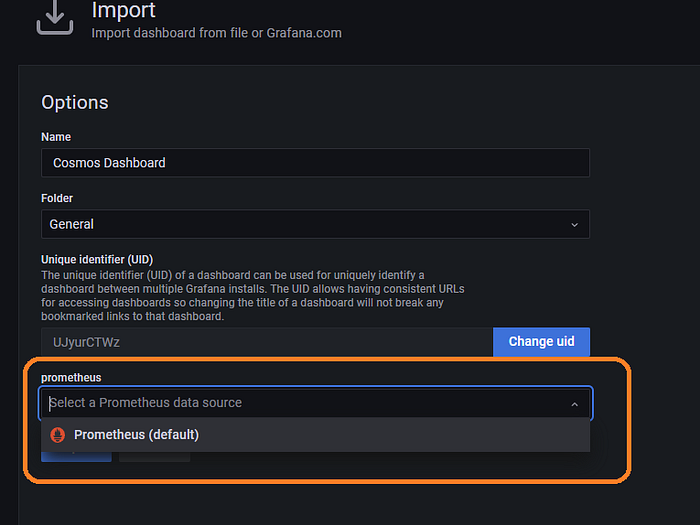
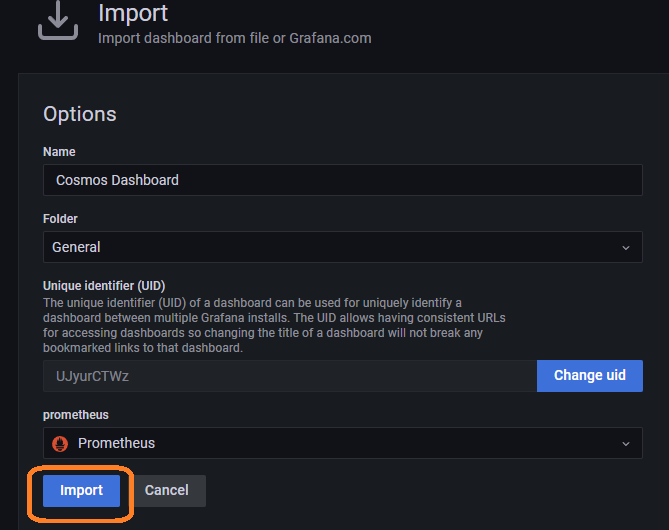
Upload the JSON file that you downloaded earlier and then select the Prometheus datasource that you just set up and then click on the Import button.
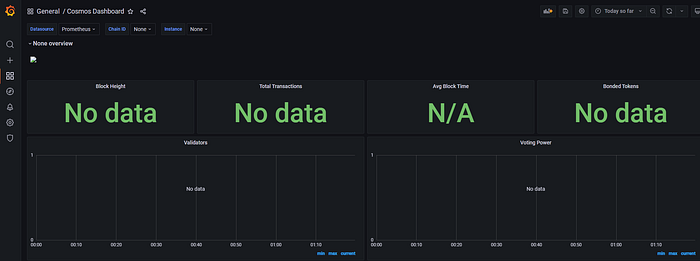
Now you have a beautiful dashboard, but unfortunately it is not filled with any data yet.
Now back to the Prometeus setup we talked about earlier.
Return to your Prometheus server and edit the prometheus.yml file.
sudo nano /etc/prometheus/prometheus.yml
Paste in the following parameters and the yml file should look like this
- job_name: project-testnet
    static_configs:
      - targets: ['node.ip.address.here:26660']
The IP address must match the Cosmos SDK node you are collecting data from. It can be a sentry or a validator.
Once you correctly paste your job in, press Ctl + X, then the Y key, then the ENTER key.
Restart the Prometheus service and it will start scraping data
sudo systemctl stop prometheus
sudo systemctl start prometheus
We are almost done, the last step remains. Login to your Sentry or Cosmos SDK validator and then open the config.toml file.
nano ~/.project name/config/config.toml
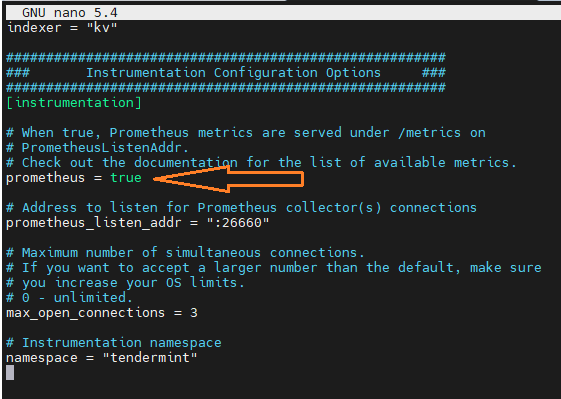
Hit PgDn on your keyboard to get to the very bottom of the file and then set prometheus=true
After making changes to the configuration file, press Ctl + X, then the Y key, then the ENTER key.
Let's open a port in the firewall so that the Prometheus server can connect to the port. If desired, you can change the port number in the config.toml file. Just make sure your firewall is open on that port too. The following command assumes that you are using port 22 for SSH. If you are not using port 22 then change the below command otherwise you will block access to your server.
sudo ufw allow proto tcp from any to any port 22
sudo ufw allow proto tcp from any to any port 26656
sudo ufw allow proto tcp from any to any port 26660
sudo ufw enable
Now restart your node and you are set! Go back to your Grafana dashboard and the data will begin to populate within a few minutes.
1. Create bot
Open Telegram and search for @BotFather user and message them the following:

You
/newbot

BotFather
Alright, a new bot. How are we going to call it? Please choose a name for your bot.

You
TypeYourBotName

BotFather
Good. Now let's choose a username for your bot. It must end in `bot`. Like this, for example: TetrisBot or tetris_bot.

You
TypeYourBotNameBot

BotFather
Done! Congratulations on your new bot. You will find it at t.me/shelley_monitor_bot. You can now add a description, about section and profile picture for your bot, see /help for a list of commands. By the way, when you've finished creating your cool bot, ping our Bot Support if you want a better username for it. Just make sure the bot is fully operational before you do this.

Use this token to access the HTTP API:
99...:AA......TvF8
Keep your token secure and store it safely, it can be used by anyone to control your bot.

For a description of the Bot API, see this page: https://core.telegram.org/bots/api
2. Create a Channel and retrieve the channel's chat ID
-
Create a channel in telegram and name it whatever you like. e.g. NODEMonitoring or similar
-
Invite @BotFather to that channel as admin
-
Type at least one message, this is very important
-
Get the Chat id:
https://api.telegram.org/bot<YOUR API TOKE FROM ABOVE>/getUpdates
{"ok":true,"result":[{"update_id":1112223334445,
"channel_post":{"message_id":1,"chat":{"id":-<YOUR_CHAT_ID>,"title":"ShelleyMonitoring","type":"channel"},"date":1576534122,"text":"/bot","entities":[{"offset":0,"length":4,"type":"bot_command"}]}}]}
- Login to grafana
- Click to the left Bell icon
- Add notification channel
- Select Telegram
- Enable/disable settings you preger
- Put Telegram API token to he fiel
- Add chat ID
- Click Test notification
- Save it.
- Go to dashboard
- Select "Jormungandr Monitor"
- Select "Jormungandr Last Block Height", ckicj edit
- Click Alarm icon
- Click "Create Alert"
- Edit the fields, see details below:

- For simple test you can stop node-exporter service for 5 minutes. It should trigger alert
systemctl stop node_exporter
- You will see message from bot firing
- Now you can start node-exporter service back
systemctl start node_exporter
- You will get confirmation from bot that issue is resolved


