You’ve been called by a client to examine a weird sample that was found on one of their developer’s systems. The client thinks this sample could be hiding its true nature of activity.
The goal of this lab is to understand how to analyze a user level keylogger and locate the files where keystrokes are being saved to.
After completing this lab, you will be able to analyze user-level keyloggers using basic dynamic analysis techniques using tools such as Process Explorer, Process Monitor, and Wireshark.
192.168.210.10 / AdminELS / Nu3pmkfyX
- Sysinternals Process Explorer (procexp.exe)
- Sysinternals Process Monitor (procmon.exe)
- Wireshark
Question
Run the given sample and find all the main parts of it: handles and files used.
Answer
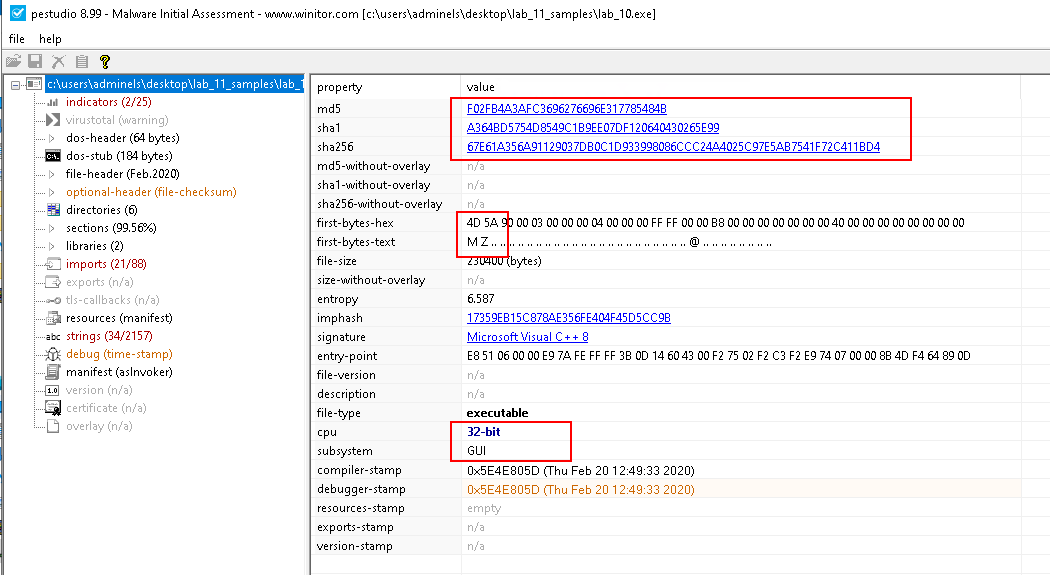
Open the sample in PEStudio:
- MD5:
F02FB4A3AFC3696276696E317785484B - SHA1:
A364BD5754D8549C1B9EE07DF120640430265E99 - SHA256:
67E61A356A91129037DB0C1D933998086CCC24A4025C97E5AB7541F72C411BD4 - It is a PE (indicated by the first bytes
MZ0x4d5a) - 32-bit with GUI
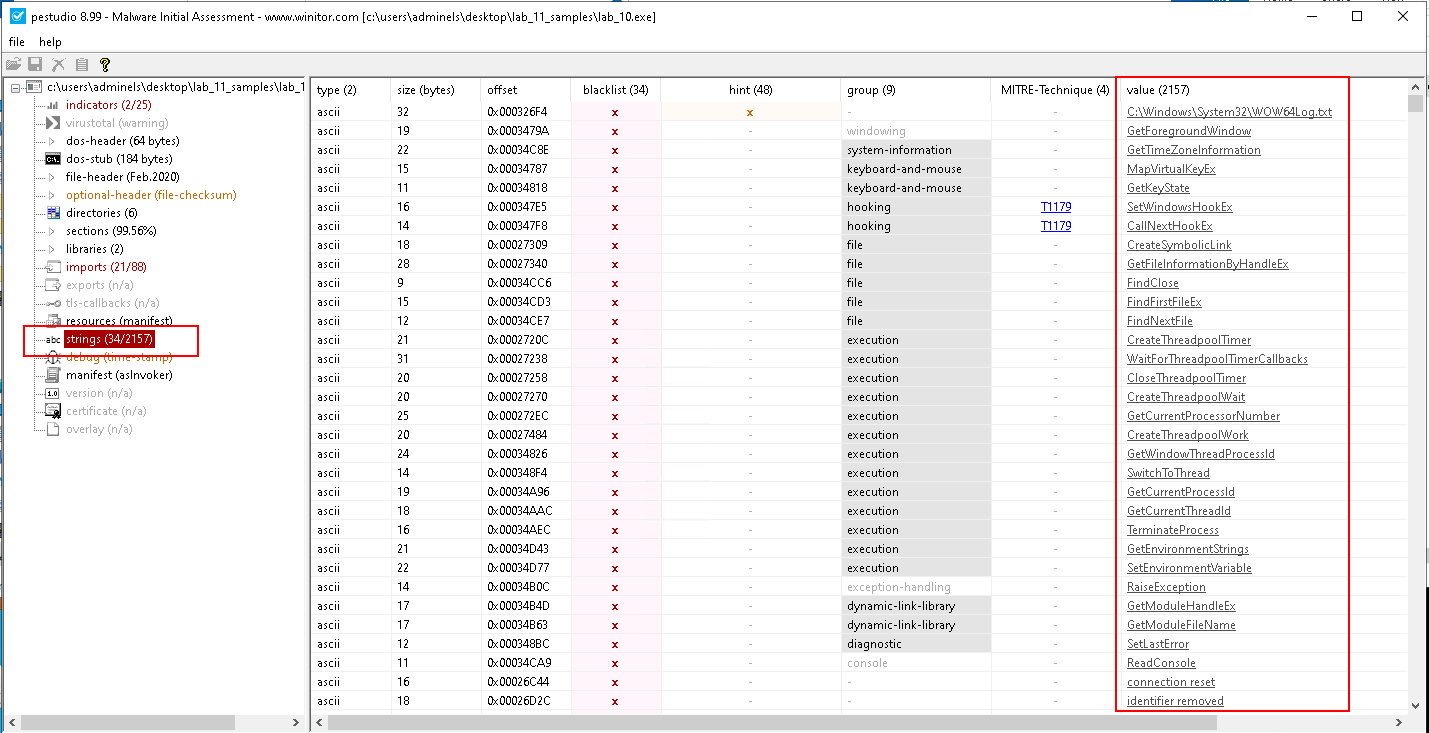
Check the strings:
-
Interesting strings:
C:\Windows\System32\WOW64Log.txtconnection resetidentifier removedoperator co await
-
Hooking related:
CallNextHookEx
-
Execution related:
- CloseThreadpoolTimer
- CreateThreadpoolTimer
- CreateThreadpoolWait
- CreateThreadpoolWork
- GetCurrentProcessId
- GetCurrentProcessorNumber
- GetCurrentThreadId
- GetEnvironmentStrings
- GetWindowThreadProcessId
- SetEnvironmentVariable
- SwitchToThread
- TerminateProcess
- WaitForThreadpoolTimerCallbacks
-
File related:
- CreateSymbolicLink
- FindClose
- FindFirstFileEx
- FindNextFile
- GetFileInformationByHandleEx
-
IO related:
- GetKeyState
- MapVirtualKeyEx
- GetKeyboardLayout
-
DLL related:
- GetModuleFileName
- GetModuleHandleEx
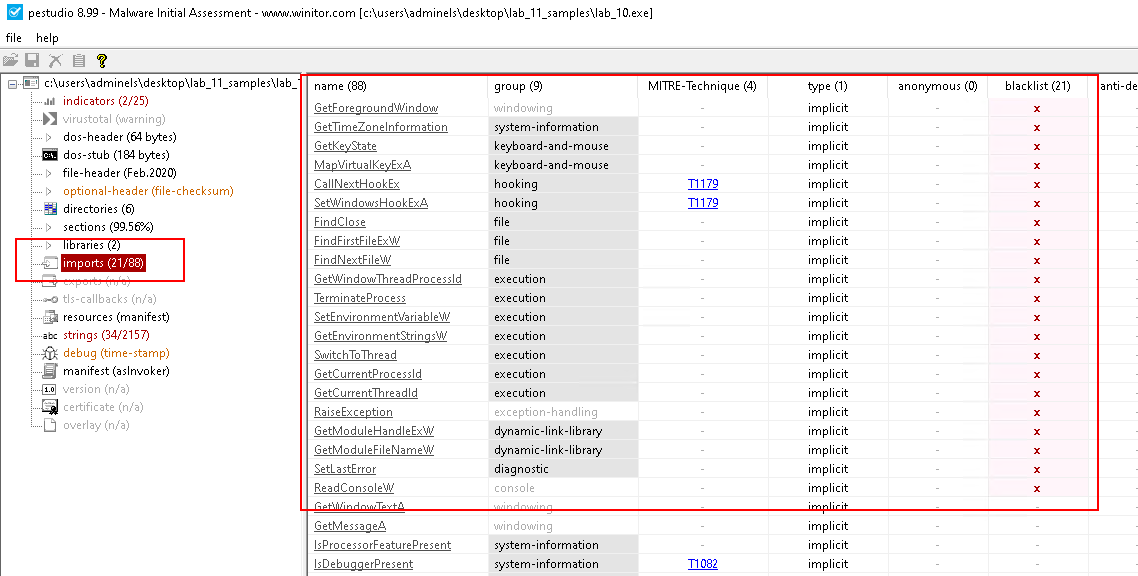
Check the imports:
-
IO related:
- GetKeyState
- MapVirtualKeyExA
-
Hooking related:
- CallNextHookEx
- SetWindowsHookExA
-
File related:
- FindClose
- FindFirstFileExW
- FindNextFileW
-
Execution related:
- GetWindowThreadProcessId
- TerminateProcess
- SetEnvironmentVariableW
- GetEnvironmentStringsW
- SwitchToThread
- GetCurrentProcessId
- GetCurrentThreadId
Check the libraries:
user32.dllkernel32.dll
Open, as admin, the following:
- Process Monitor
- Process Explorer
- Wireshark
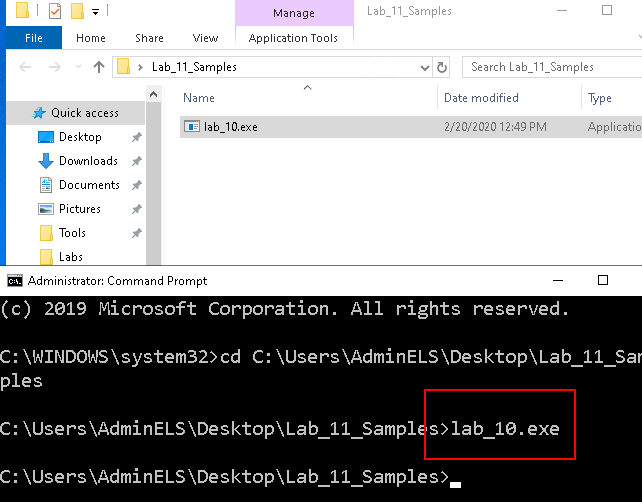
Run the sample as admin:
lab_10.exe
- Nothing is shown to the user
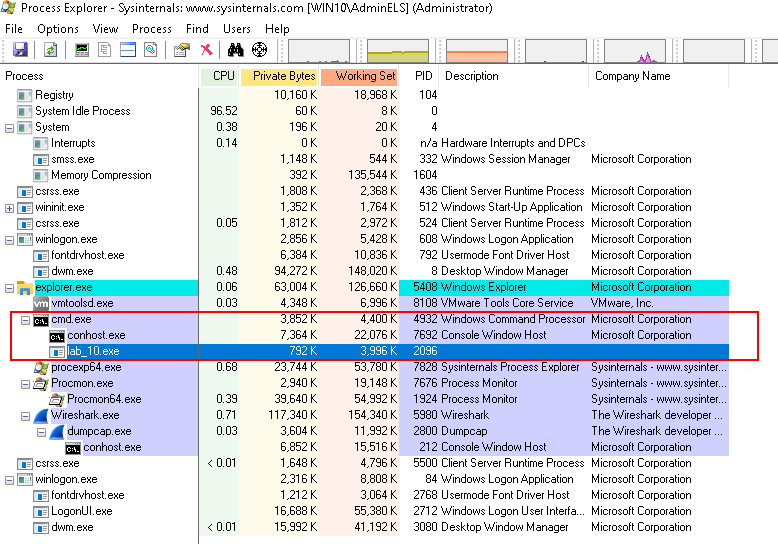
Inspect in Process Explorer:
- An instance of
lab_10.exe(PID: 2096) is running
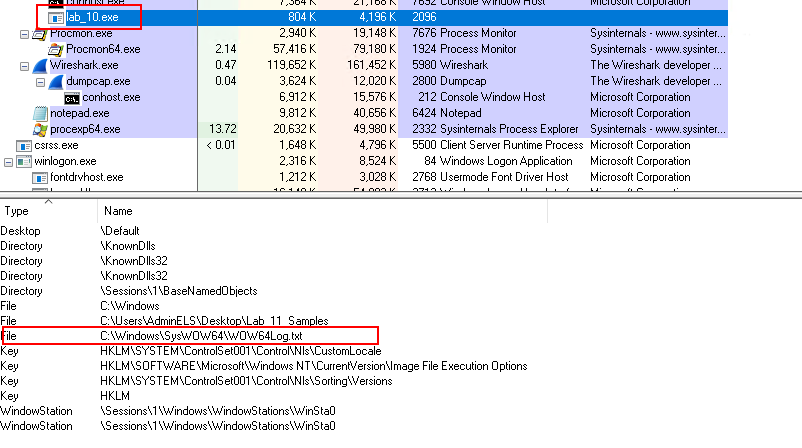
In Process Monitor, inspect the Process Handle:
View > Show Lower PaneView > Lower Pane View > Handles
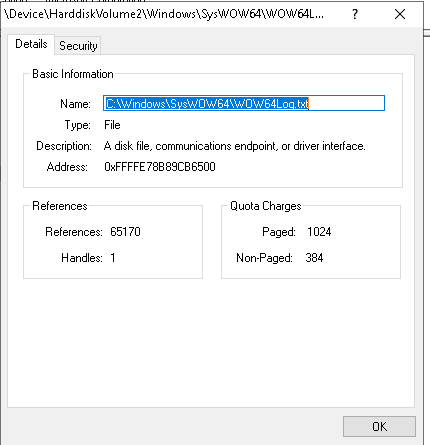
- It is communicating with
C:\Windows\SysWOW64\WOW64Log.txt
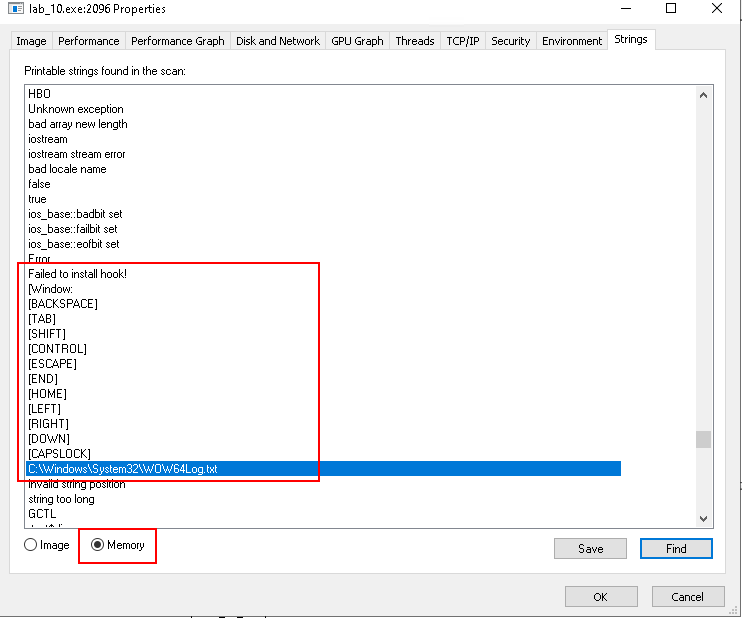
Also check the memory strings of lab_10.exe in Process Explorer:
- "Failed to install hook" is shown
- There are some keystrokes listed - likely they are the ones that the program cannot hook
In the Static Analysis, it is suspected that this is a keylogger since it includes some I/O imports.
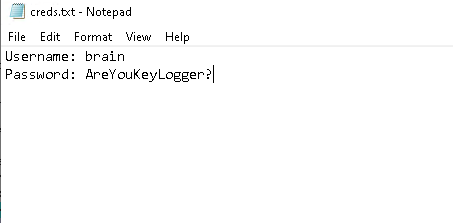
Try to create a text file and see if the text is captured somewhere.
Question
This is a malicious sample that was collected, and you’re required to analyze it and provide as much information to what activity it is doing.
Answer
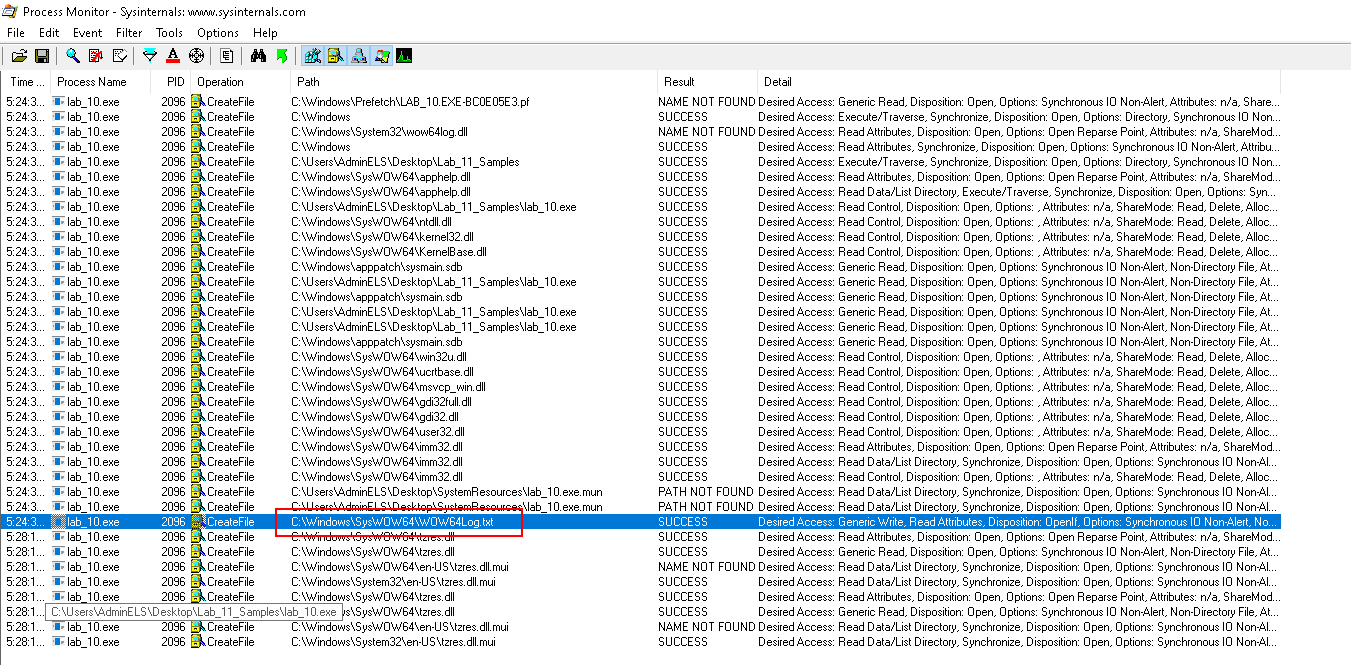
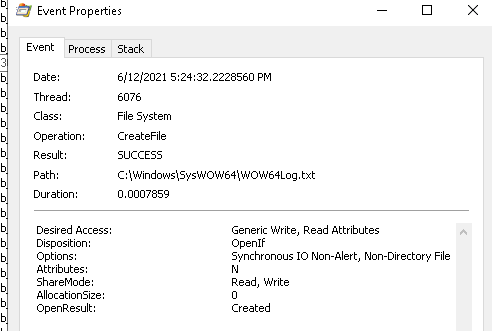
In Process Monitor, filter Operation is CreateFile and ProcessName is lab_10.exe:
- The operation of creating
WOW64Log.txtis shown
- Desired Access is
Generic Write, Read Attributes - OpenResult is
Created
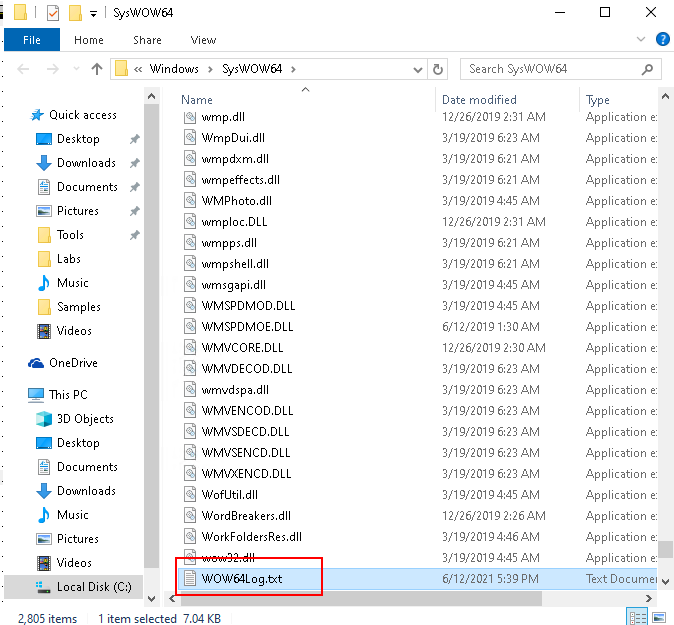
Right click the entry and click Jump To ..., it brings you to the target path:
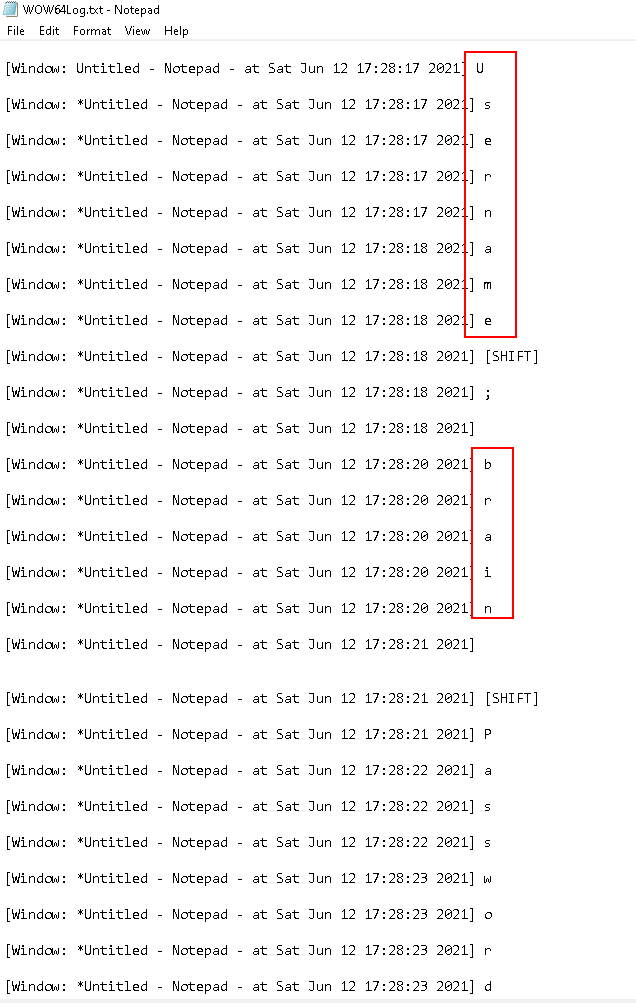
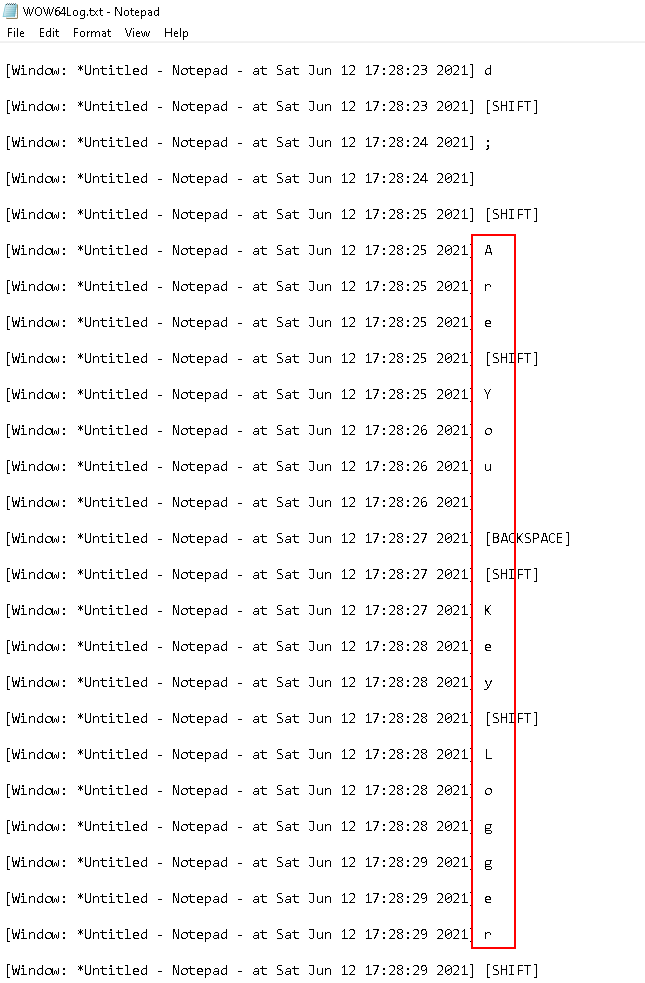
Inspect the file:
- These are the character that we have typed
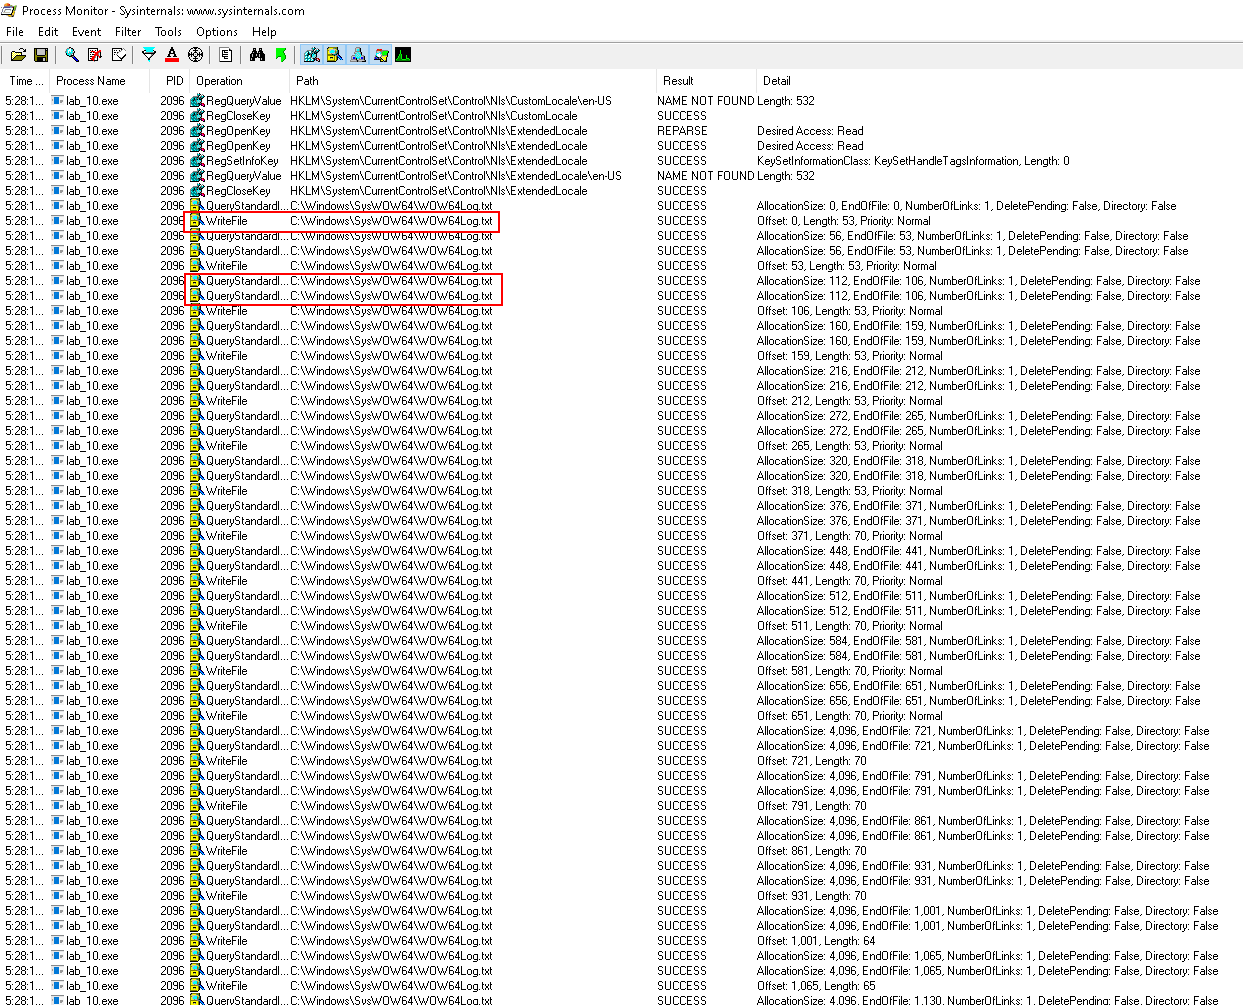
Filter Process Name is lab_10.exe:
- See the pattern
QueryStandardinformationFile>WriteFile - Note the bytes written are different:
53,70,64,65etc -> This indicates the length of different keystokes
Question
What are the IOCs that could be created to find and identify this sample on other systems?
Answer
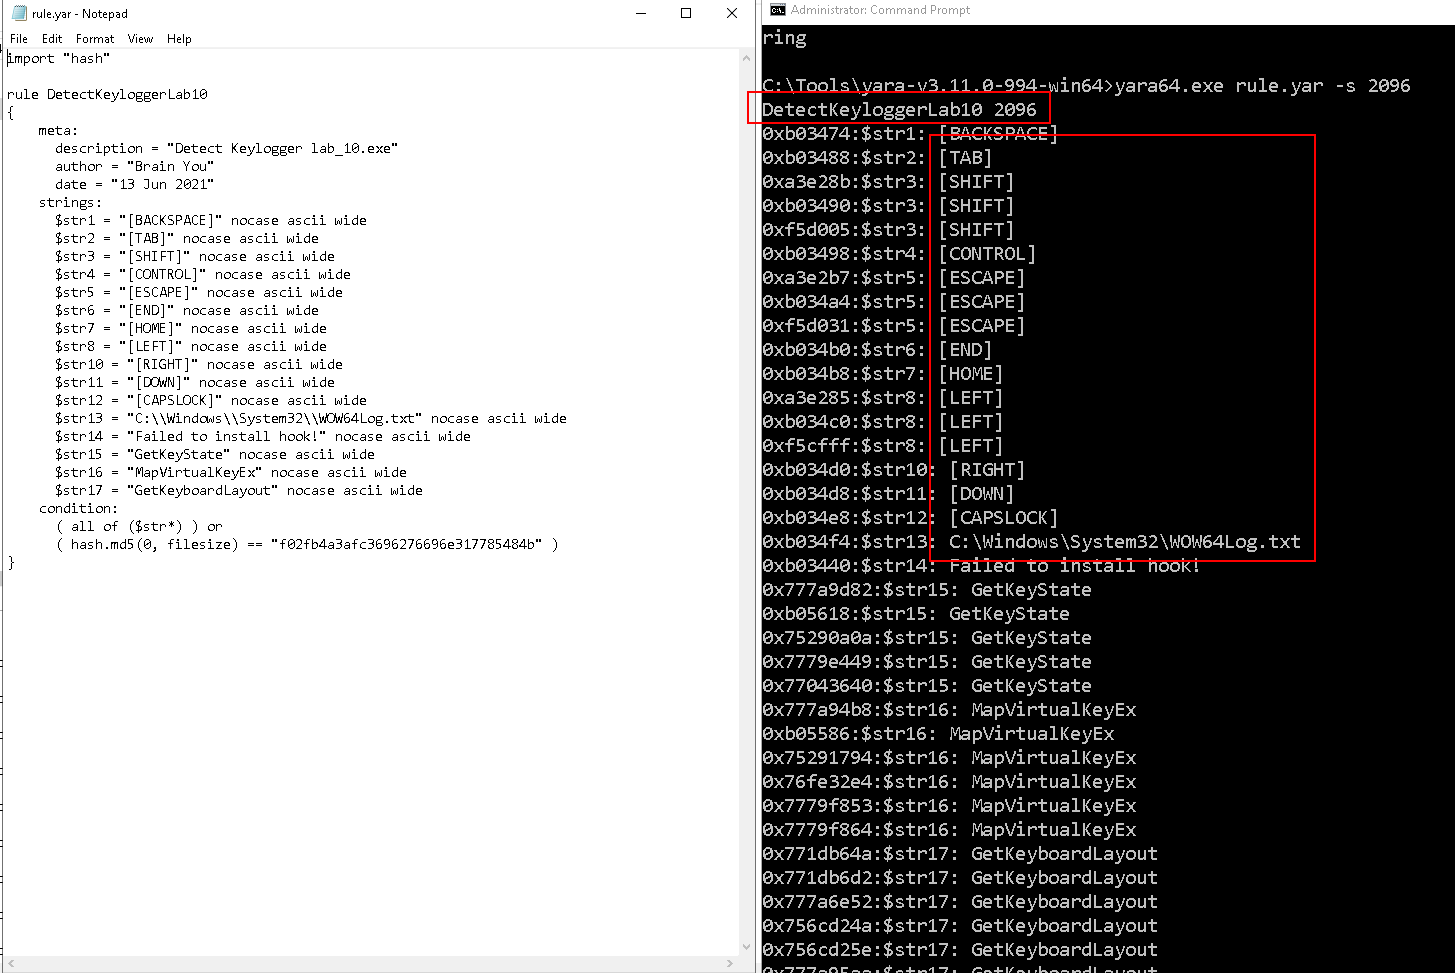
We can write a YARA rule to capture this in memory:
import "hash"

rule DetectKeyloggerLab10
{
    meta:
      description = "Detect Keylogger lab_10.exe"
      author = "Brain You"
      date = "13 Jun 2021"
    strings:
      $str1 = "[BACKSPACE]" nocase ascii wide
      $str2 = "[TAB]" nocase ascii wide
      $str3 = "[SHIFT]" nocase ascii wide
      $str4 = "[CONTROL]" nocase ascii wide
      $str5 = "[ESCAPE]" nocase ascii wide
      $str6 = "[END]" nocase ascii wide
      $str7 = "[HOME]" nocase ascii wide
      $str8 = "[LEFT]" nocase ascii wide
      $str10 = "[RIGHT]" nocase ascii wide
      $str11 = "[DOWN]" nocase ascii wide
      $str12 = "[CAPSLOCK]" nocase ascii wide
      $str13 = "C:\Windows\System32\WOW64Log.txt" nocase ascii wide
      $str14 = "Failed to install hook!" nocase ascii wide
      $str15 = "GetKeyState" nocase ascii wide
      $str16 = "MapVirtualKeyEx" nocase ascii wide
      $str17 = "GetKeyboardLayout" nocase ascii wide
    condition:
      ( all of ($str*) ) or
      ( hash.md5(0, filesize) == "f02fb4a3afc3696276696e317785484b" )
}
Use yara64.exe to inspect the process of lab_10.exe:
yara64.exe rule.yar -s 2096
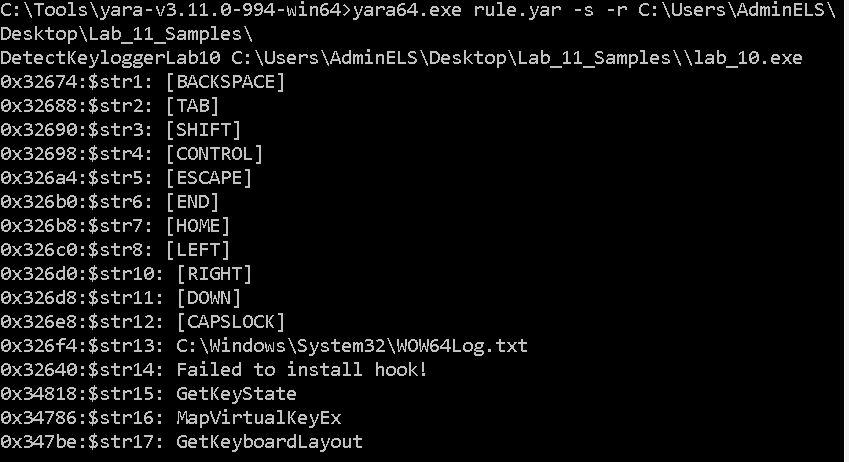
Also check against file:
yara64.exe rule.yar -s -r C:\Users\AdminELS\Desktop\Lab_11_Samples\
