The aim of this repository is to help setting up Visual Studio Code for development and debugging of Electron apps in Typescript.
Visual Studio Code comes with Electron support and Typescript support out of the box, but bringing the two together requires some advanced knowledge of the available configuration options. The repository contains a README with step by step instructions and an example project to demonstrate how Visual Studio Code, Node, Electron and Typescript must be configured to work together.
The latest example project has been created and tested on Linux with
- Node v15.13.0
- Electron v12.0.2
- Typescript v4.2.3
- Visual Studio Code v1.55.0
- Debugger for Chrome extension v4.12.12
# Clone repository
git clone https://github.com/abartho/electron-typescript-vscode.git

# Change into directory
cd electron-typescript-vscode

# Install dependencies
npm install

# Optional: test if the application is running
npm start-
Install the "Debugger for Chrome" extension.
It is required for debugging renderer processes.

-
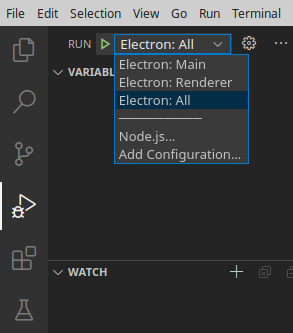
In the Run view, select the "Electron: All" configuration.
This is a compound configuration that will start both the "Electron: Main" and "Electron: Renderer" configurations.
-
Set a breakpoint in
src/main.tsandsrc/renderer.ts -
Run the "Run" -> "Start Debugging" command (F5)


-
The breakpoint in the
main.tswill be hit. -
Click Continue (F5)
-
In the Electron example app, click the "Turn page red" button.
-
The breakpoint in
renderer.tsshould be hit. -
If the breakpoint is not hit and marked as unbound instead:
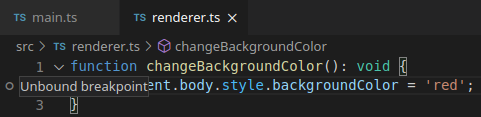
you have likely come across a bug in the new JavaScript debugger for Node.js and Chrome, which is currently in preview and enabled by default. It is used by recent versions of the "Debugger for Chrome" extension. As a workaround, try to disable the preview debugger (microsoft/vscode#102493).
- Open Settings (Ctrl+,)
- Search for
debug.javascript.usePreview - Set option to false

- Run the "Electron: All" configuration again


Electron has two kinds of processes: a main process and renderer processes (one for each tab). They need different launch configurations, which are shown below. The code snippets are taken from the launch configuration.
The main process can be debugged with the pwa-node debugger that ships with Visual Studio Code.
The launch configuration looks like this:
{
  "name": "Electron: Main",
  "type": "pwa-node",               //use the node debugger that comes with VS Code
  "request": "launch",
  "cwd": "${workspaceFolder}",
  "runtimeExecutable": "${workspaceFolder}/node_modules/.bin/electron",
  "runtimeArgs": [
    "--remote-debugging-port=9223"  //open debugging port for renderer process
  ],
  "args" : ["."],
  "outputCapture": "std",
  "sourceMaps": true,
  "resolveSourceMapLocations": [
    "${workspaceFolder}/**",        //use source maps for files in workspace folder
    "!**/node_modules/**"           //but ignore everything in the node_modules folder
  ],
  "preLaunchTask": "npm: compile"   //recompile before debugging (execute the compile script defined in package.json)
}
In the sourceMaps and resolveSourceMapLocations sections, we enable the creation of source maps for our code. Source maps must be generated to enable the debugger to map locations inside the JavaScript code back to TypeScript.
In the runtimeArgs section, we open a port for the renderer process. There is a counterpart defined in the renderer process configuration as shown below.
Debugging a renderer process requires the "Debugger for Chrome" extension.
{
  "name": "Electron: Renderer",
  "type": "chrome",       //use the Debugger for Chrome (extension)
  "request": "attach",
  "port": 9223,           //use debug port opened in Electron: Main configuration
  "webRoot": "${workspaceFolder}",
  "timeout": 30000
}
In the port section, we specify the debugging port that we chose in the main process configuration.
Visual Studio Code can only run a single configuration at a time, but we need to run the Main and the Renderer configurations at the same time. The solution are compound configurations (found in vscode-recipes)
"compounds": [ //launch multiple configurations concurrently
  {
    "name": "Electron: All",
    "configurations": [
      "Electron: Main",
      "Electron: Renderer"
    ]
  }
]