

Generation of diagrams and flowcharts from text in a similar manner as markdown.
Ever wanted to simplify documentation and avoid heavy tools like Visio when explaining your code?
This is why mermaid was born, a simple markdown-like script language for generating charts from text via javascript.
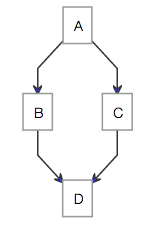
The code below would render the following image
graph TD;
    A-->B;
    A-->C;
    B-->D;
    C-->D;
would render this lovely chart:
A page with a live example can be seen here. You can also look at mermaid in action using jsbin. If you want a live demo, there is an editor provided in the mermaid project or you can simply look at this great editor
graph LR;
    A[Hard edge]-->|Link text|B(Round edge);
    B-->C{Decision};
    C-->|One|D[Result one];
    C-->|Two|E[Result two];
Below is the new declaration of the graph which since 0.2.16 also is valid along with the old declaration of the graph as described in the graph example on the home wiki page.
graph LR
    A[Hard edge] -->|Link text| B(Round edge)
    B --> C{Decision}
    C -->|One| D[Result one]
    C -->|Two| E[Result two]

Many thanks to the d3 and dagre-d3 projects for providing the graphical layout and drawing libraries! Thanks also to the js-sequence-diagram project for usage of the grammar for the sequence diagrams.
Mermaid was created by Knut Sveidqvist for easier documentation.