TRex Advanced Stateful (ASTF) mode supports a user space TCP stack for emulating L7 protocols such as HTTP for router firewall testing. TRex saves memory when generating traffic by using APIs with a pull approach rather than push, and utilizing DPDK for batching the packets. More technical information about TRex ASTF mode here: trex astf mode
We have been asked a few times why a TRex user space TCP stack was implemented for traffic generation. Why not use Linux kernel TCP and a user space event-driven mechanism over user space, as is done in many event-driven user space applications, such as NGINX (accept_mutex and kernel socket sharding)? [1].
A few user space DPDK TCP implementations (examples: SeaStar [2] and WARP17 [3]) have already shown that DPDK with the right event-driven implementation scales well (range of MPPS/MCPS), especially with small flows and a large number of active flows. But we did not find a good comparable implementation for the same test with a Linux TCP stack.
Yet another benefit achieved from this experiment is a validation that a TRex TCP implementation (based on BSD UNIX) can work with a standard Linux web server.
So back to the objective… The question this blog tries to answer is this:
Let’s assume one wants to test a Firewall/NAT64/DPI using a TCP stack at high scale.
One option is to use Linux curl as a client and nginx as a server. Another option is to use TRex ASTF mode. The question is: What’s the performance difference? How many more x86 servers would one need to do the same test? Is it factor 2 or maybe more?
In other words, what is the CPU/memory resource price when using a Linux TCP stack/user space async app in our traffic generation use case?
The focus in this blog post is performance and memory use, but having our own user space TCP stack that can be tuned to our use case has many other functional benefits, including:
-
More accurate statistics per template. For example some profiles may generate HTTP and P2P traffic. We can distinguish, for example, an effect related only to the HTTP template in a QoS use case. This is not possible when using the kernel TCP stack.
-
Very accurate latency measurement (microsecond resolution).
-
Flexibility to simulate millions of clients/server.
-
Simple method for adding tunneling support.
-
Simple method for simulating latency during a high rate of traffic, using minimum memory.
The benchmark setup was designed to take a good event-driven Linux server implementation and to test a TRex client against it.
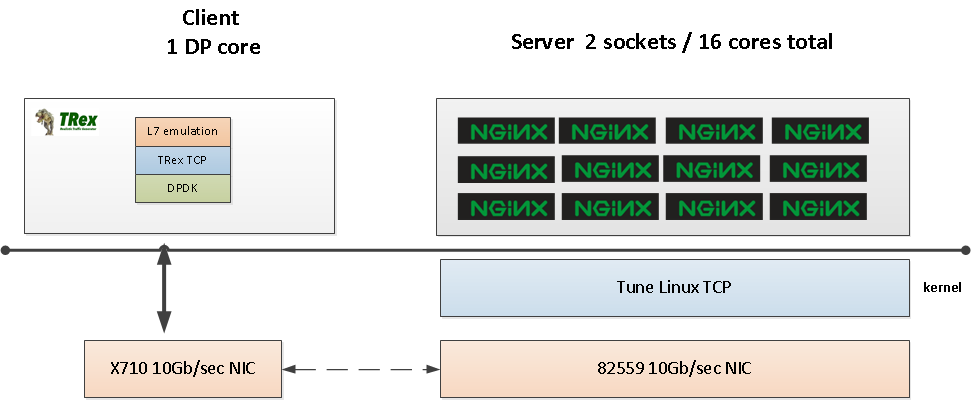
TRex is the client requesting the pages. Figure 1 shows the topology in this case.
TRex generates requests using one DP core and we will exercise the whole 16 cores of the NGINX server. The server is installed with the NGINX process on all 16 cores.
After some trial and error, it was determined that is is more difficult to separate Linux kernel/IRQ "context" events from user space process CPU%, so we chose to give the NGINX all server resources, and monitor to determine the limiting factor.
The objective is to simulate HTTP sessions as it was defined in our benchmark (e.g. new session for each REQ/RES, initwnd=2 etc.) and not to make the fastest most efficient TCP configuration. This might be the main difference betwean NGINX benchmark configuration and this document configuration.
In both cases (client/server), the same type of x86 server was used:
| Server |
|---|
Cisco UCS 240M3 |
CPU |
2 sockets x Intel® Xeon® CPU E5-2667 v3 @ 3.20GHz, 8 cores |
NICs |
1 NIC x 82599 or 2 X710 |
NUMA |
NIC0-NUMA 0 , NIC1-NUMA1 |
Memory |
2x32GB |
PCIe |
2x PCIe16 + 2xPCIe4 |
OS |
Fedora 18 - baremetal |
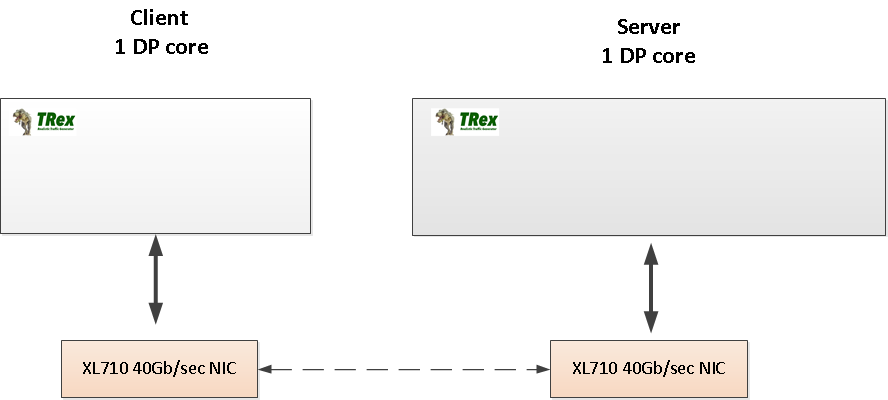
To compare apples to apples, the NGINX server was replaced with a TRex server with one DP core, using an XL710 NIC (40Gb). See the figure above.
Typically, web servers are tested with a constant number of active flows that are opened ahead of time. In the NGINX benchmark blog, only 50 TCP constant connections are used with many request/response for each TCP connection see here [4]. Many web stress tools support a constant number of active TCP connections (examples: Apache ab [5]; faster tools in golang). It is not clear why. In our traffic generation use case, each HTTP request/response (for each new TCP connection) requires opening a new TCP connection. We use simple HTTP flows with a request of 100B and a response of 32KB (about 32 packets/flow with initwnd=2). The HTTP flow was taken from our EMIX standard L7 benchmark.
| Property |
|---|
Values |
HTTP request size |
100B |
HTTP response size |
32KB |
Request/Response per TCP connection |
1 |
Average number of packets per TCP connection |
32 |
Number of clients |
200 |
Number of servers |
1 |
initwnd |
2 |
delay-ack |
100msec |
Flow example: tcp2_http_simple_c.pcap
The comparison is not perfect, as TRex merely emulates HTTP traffic. It is not a real-world web server or HTTP client. For example, currently the TRex client does not parse the HTTP response for the Length field. TRex simply waits for a specific data size (32KB) over TCP. However the TCP layer is a full featured TCP (e.g. delay-ack/Retransimiotion/Reassembly/timers) .It is based on BSD implementation.
When using NGINX and a Linux TCP kernel, it was necessary to tune many things before running tests. This is one of the downsides of using the kernel. Each server/NIC type must be tuned carefully for best performance.
worker_processes  auto;      #(1)
#worker_cpu_affinity auto;
#worker_cpu_affinity 100000000000000 010000000000000 001000000000000 000100000000000 000010000000000 000001000000000 000000100000000 000000010000000 ;

#worker_processes 1;
#worker_cpu_affinity 100000000000000;

#error_log  /tmp/nginx/error.log;
#error_log  /var/log/nginx/error.log  notice;
#error_log  /var/log/nginx/error.log  info;

pid        /run/nginx.pid;

worker_rlimit_nofile 1000000;  #(2)


events {
    worker_connections  1000000;  #(3)
}-
NGINX server uses all 16 cores.
-
Limit the number of files to 1M.
-
Worker_connections will have 1M active connections.
See [6] for more info.
sysctl fs.file-max=99999999
sysctl net.core.netdev_max_backlog=9999999
sysctl net.core.somaxconn=65000
sysctl net.ipv4.tcp_max_orphans=128
sysctl net.ipv4.tcp_max_syn_backlog=9999999
sysctl net.ipv4.tcp_mem="1542108  2056147 13084216"
sysctl net.netfilter.nf_conntrack_tcp_established=5
sysctl net.netfilter.nf_conntrack_tcp_timeout_close=3
sysctl net.netfilter.nf_conntrack_tcp_timeout_close_wait=3
sysctl net.netfilter.nf_conntrack_tcp_timeout_established=5
sysctl net.netfilter.nf_conntrack_tcp_timeout_fin_wait=1
sysctl net.netfilter.nf_conntrack_tcp_timeout_last_ack=3
sysctl net.netfilter.nf_conntrack_tcp_timeout_syn_recv=3
sysctl net.netfilter.nf_conntrack_tcp_timeout_syn_sent=3
sysctl net.netfilter.nf_conntrack_tcp_timeout_time_wait=3
sysctl net.netfilter.nf_conntrack_tcp_timeout_unacknowledged=10
sysctl sunrpc.tcp_fin_timeout=1-
TCP timeouts were reduced considerably to reduce the number of active flows.
-
Add much more memory for TCP.
-
Add more file descriptors (about 1M).
See [7] for info about tuning the kernel for best performance.
The NIC RSS/IRQ must be tuned. irqbalance was installed and it was verified that interrupts are evenly distributed using:
$egrep 'CPU|p2p1' /proc/interrupts$sudo ethtool -n p2p1 rx-flow-hash tcp4
TCP over IPV4 flows use these fields for computing Hash flow key:
IP SA
IP DA
L4 bytes 0 & 1 [TCP/UDP src port]
L4 bytes 2 & 3 [TCP/UDP dst port]the full ixgbe driver configuration could be found nginx_if_cfg.txt
The TRex profile generates HTTP flows from 200 clients (16.0.0.1 -16.0.0.200) to one server (48.0.0.1). A static route is configured so that (a) the traffic returns to the correct interface, and (b) the profile addresses the link-up/down case.
from trex.astf.api import *

class Prof1():
    def get_profile(self):
        # ip generator
        ip_gen_c = ASTFIPGenDist(ip_range = ["16.0.0.1", "16.0.0.200"], distribution="seq")
        ip_gen_s = ASTFIPGenDist(ip_range = ["48.0.0.1", "48.0.0.200"], distribution="seq")
        ip_gen = ASTFIPGen(glob = ASTFIPGenGlobal(ip_offset="1.0.0.0"),
                           dist_client = ip_gen_c,
                           dist_server = ip_gen_s)

        return ASTFProfile(default_ip_gen = ip_gen,
                            cap_list = [ASTFCapInfo(file = 'nginx.pcap',
                            cps = 1)])


def register():
return Prof1()$sudo ./t-rex-64 --astf -f astf/nginx_wget.py -m 182000 -c 1 -d 1000TRex v2.30 was used in this test. We expect that v2.31 will have the same performance.
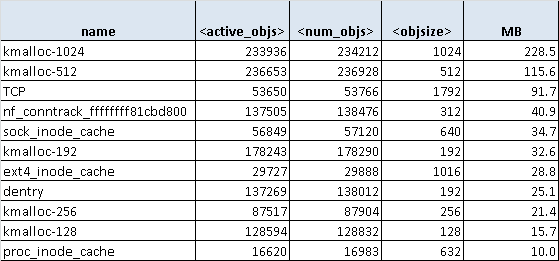
The command cat /proc/slabinfo and slabtop was used to display the TCP kernel memory.
Linux and NGINX require much more memory than TRex does, due to the architecture differences.
Again, we are comparing 1 DP core running TRex to NGINX running on 16 cores with a kernel that can interrupt any NGINX process with IRQ.
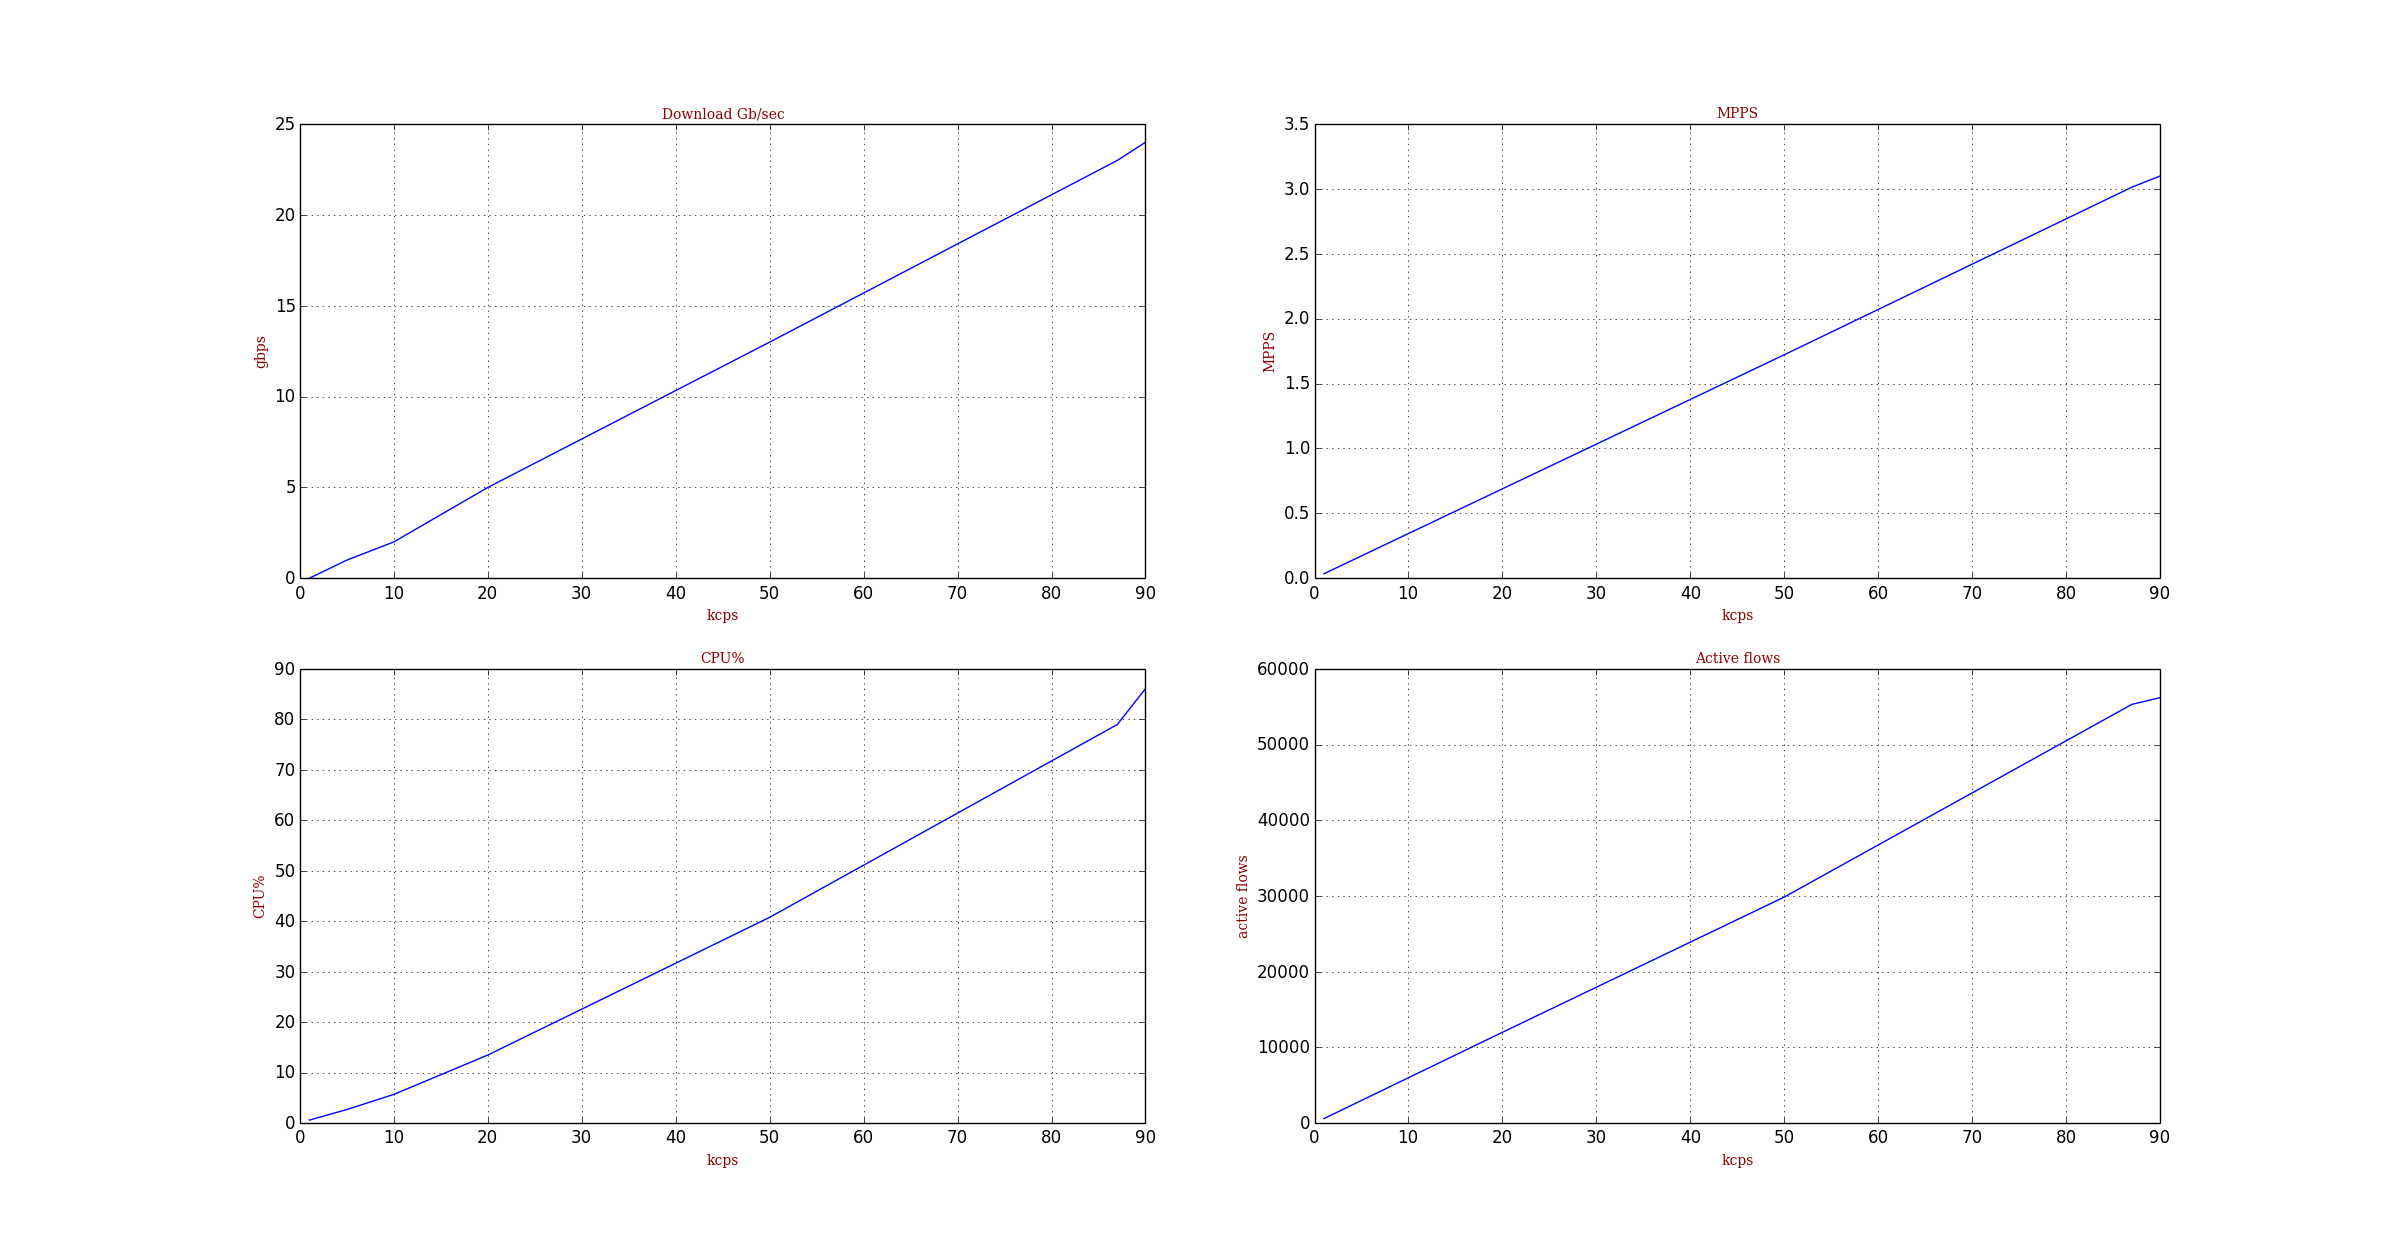
Figure 3 shows the performance of one DP TRex. It can scale to about 25Gb/sec of download of HTTP (total of 3MPPS for one core).
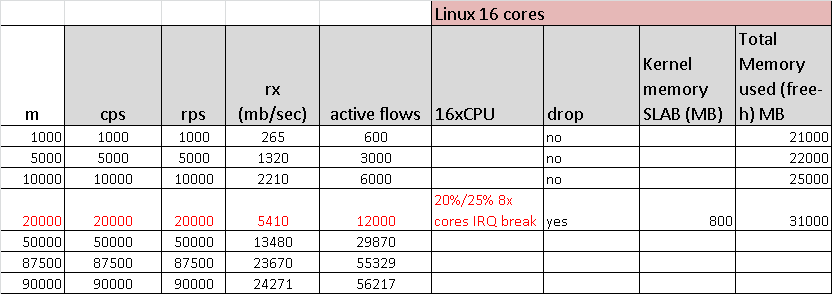
Figure 4 shows the NGINX performance with 16 cores. It scales (or does not scale) up to about 5.4Gb/sec for this type of HTTP.
 -Per port stats table
      ports |               0 |               1 |               2 |               3
 -----------------------------------------------------------------------------------------
   opackets |               0 |        32528390 |        12195883 |               0
     obytes |               0 |     44776566818 |      1015380642 |               0
   ipackets |               0 |        12192506 |        32528673 |               0
     ibytes |               0 |      1015380642 |     44776984044 |               0
    ierrors |               0 |            3377 |               0 |               0
    oerrors |               0 |               0 |               0 |               0
      Tx Bw |       0.00  bps |      23.96 Gbps |     542.51 Mbps |       0.00  bps

-Global stats enabled
 Cpu Utilization : 69.7  %  35.2 Gb/core [84.7 ,54.7  ] #(1)
 Platform_factor : 1.0
 Total-Tx        :      24.50 Gbps
 Total-Rx        :      24.50 Gbps
 Total-PPS       :       2.99 Mpps
 Total-CPS       :      90.87 Kcps

 Expected-PPS    :       0.00  pps
 Expected-CPS    :       0.00  cps
 Expected-L7-BPS :       0.00  bps

 Active-flows    :    57634  Clients :      200   Socket-util : 0.4576 %
 Open-flows      :  1381926  Servers :      200   Socket :    57634 Socket/Clients :  288.2
 drop-rate       :       0.00  bps
 current time    : 19.0 sec
 test duration   : 981.0 sec
 *** TRex is shutting down - cause: 'CTRL + C detected'
All cores stopped !!-
The TRex server has 84% CPU utilization, and the TRex client has only 54% CPU utilization. [1]
                      |          client   |            server   |
  -----------------------------------------------------------------------------------------
       m_active_flows  |           54590  |           242902  |  active open flows
          m_est_flows  |           54578  |           242893  |  active established flows
         m_tx_bw_l7_r  |      75.80 Mbps  |       21.57 Gbps  |  tx L7 bw acked
   m_tx_bw_l7_total_r  |      75.81 Mbps  |       21.63 Gbps  |  tx L7 bw total
         m_rx_bw_l7_r  |      21.63 Gbps  |       75.80 Mbps  |  rx L7 bw acked
           m_tx_pps_r  |     776.09 Kpps  |      690.41 Kpps  |  tx pps
           m_rx_pps_r  |       2.16 Mpps  |      861.75 Kpps  |  rx pps
           m_avg_size  |       925.43  B  |          1.74 KB  |  average pkt size
           m_tx_ratio  |      100.00  %%  |        99.73  %%  |  Tx acked/sent ratio
                    -  |             ---  |              ---  |
                  TCP  |             ---  |              ---  |
                    -  |             ---  |              ---  |
     tcps_connattempt  |          512253  |                0  |  connections initiated
         tcps_accepts  |               0  |           512246  |  connections accepted
        tcps_connects  |          512241  |           512237  |  connections established
          tcps_closed  |          457663  |           269344  |  conn. closed (includes drops)
       tcps_segstimed  |         1491237  |          3915963  |  segs where we tried to get rtt
      tcps_rttupdated  |         1491201  |          3870455  |  times we succeeded
          tcps_delack  |         2424787  |                0  |  delayed acks sent
        tcps_sndtotal  |         4382761  |          3915963  |  total packets sent
         tcps_sndpack  |          512241  |          2936981  |  data packets sent
         tcps_sndbyte  |        55835577  |      16056068765  |  data bytes sent by application
      tcps_sndbyte_ok  |        55834269  |      15289046350  |  data bytes sent by tcp
         tcps_sndctrl  |          512253  |                0  |  control (SYN|FIN|RST) packets sent
         tcps_sndacks  |         3358267  |           978983  |  ack-only packets sent
         tcps_rcvpack  |        11190011  |           978974  |  packets received in sequence
         tcps_rcvbyte  |     15288795079  |         55833833  |  bytes received in sequence
      tcps_rcvackpack  |          978960  |          3870455  |  rcvd ack packets
      tcps_rcvackbyte  |        55832307  |      15025525681  |  tx bytes acked by rcvd acks
   tcps_rcvackbyte_of  |          466737  |           978974  |  tx bytes acked by rcvd acks - overflow acked
         tcps_preddat  |        10211051  |                0  |  times hdr predict ok for data pkts
                    -  |             ---  |              ---  |
           Flow Table  |             ---  |              ---  |
                    -  |             ---  |              ---  |
err_rx_throttled | 0 | 42 | rx thread was throttledtop taken @5.4Gb/sec IRQ is hitting Cpu0 (si)asks: 428 total, 6 running, 422 sleeping, 0 stopped, 0 zombie
%Cpu0 : 0.4 us, 10.3 sy, 0.0 ni, 9.9 id, 0.0 wa, 1.8 hi, 77.7 si, 0.0 st #(1)
%Cpu1 : 5.6 us, 23.6 sy, 0.0 ni, 42.6 id, 0.0 wa, 1.4 hi, 26.8 si, 0.0 st
%Cpu2 : 5.2 us, 24.7 sy, 0.0 ni, 41.8 id, 0.0 wa, 1.7 hi, 26.5 si, 0.0 st
%Cpu3 : 5.3 us, 23.0 sy, 0.0 ni, 42.9 id, 0.0 wa, 1.8 hi, 27.0 si, 0.0 st
%Cpu4 : 5.3 us, 23.2 sy, 0.0 ni, 43.2 id, 0.0 wa, 1.8 hi, 26.7 si, 0.0 st
%Cpu5 : 5.3 us, 22.4 sy, 0.0 ni, 44.1 id, 0.0 wa, 1.8 hi, 26.3 si, 0.0 st
%Cpu6 : 4.9 us, 23.5 sy, 0.0 ni, 43.5 id, 0.0 wa, 1.8 hi, 26.3 si, 0.0 st
%Cpu7 : 4.6 us, 22.1 sy, 0.0 ni, 44.6 id, 0.0 wa, 1.8 hi, 26.8 si, 0.0 st
%Cpu8 : 0.0 us, 0.0 sy, 0.0 ni, 98.3 id, 0.0 wa, 0.0 hi, 1.7 si, 0.0 st
%Cpu9 : 0.0 us, 0.3 sy, 0.0 ni, 99.7 id, 0.0 wa, 0.0 hi, 0.0 si, 0.0 st
%Cpu10 : 0.0 us, 0.0 sy, 0.0 ni,100.0 id, 0.0 wa, 0.0 hi, 0.0 si, 0.0 st
%Cpu11 : 0.3 us, 0.3 sy, 0.0 ni, 99.0 id, 0.0 wa, 0.0 hi, 0.3 si, 0.0 st
%Cpu12 : 0.0 us, 1.0 sy, 0.0 ni, 98.7 id, 0.0 wa, 0.0 hi, 0.3 si, 0.0 st
%Cpu13 : 0.0 us, 0.0 sy, 0.0 ni,100.0 id, 0.0 wa, 0.0 hi, 0.0 si, 0.0 st
%Cpu14 : 0.0 us, 0.0 sy, 0.0 ni,100.0 id, 0.0 wa, 0.0 hi, 0.0 si, 0.0 st
%Cpu15 : 0.0 us, 0.0 sy, 0.0 ni,100.0 id, 0.0 wa, 0.0 hi, 0.0 si, 0.0 st
%Cpu16 : 0.0 us, 0.7 sy, 0.0 ni, 98.7 id, 0.0 wa, 0.3 hi, 0.3 si, 0.0 st
%Cpu17 : 1.3 us, 4.3 sy, 0.0 ni, 91.6 id, 0.0 wa, 0.7 hi, 2.0 si, 0.0 st
%Cpu18 : 1.3 us, 4.4 sy, 0.0 ni, 91.6 id, 0.0 wa, 0.7 hi, 2.0 si, 0.0 st
%Cpu19 : 1.4 us, 4.1 sy, 0.0 ni, 91.9 id, 0.0 wa, 0.7 hi, 2.0 si, 0.0 st
%Cpu20 : 1.0 us, 4.1 sy, 0.0 ni, 92.2 id, 0.3 wa, 0.7 hi, 1.7 si, 0.0 st
%Cpu21 : 1.0 us, 4.0 sy, 0.0 ni, 92.9 id, 0.0 wa, 0.7 hi, 1.3 si, 0.0 st
%Cpu22 : 1.3 us, 3.4 sy, 0.0 ni, 93.0 id, 0.0 wa, 0.3 hi, 2.0 si, 0.0 st
%Cpu23 : 0.7 us, 3.7 sy, 0.0 ni, 93.2 id, 0.0 wa, 0.7 hi, 1.7 si, 0.0 st
%Cpu24 : 0.0 us, 0.3 sy, 0.0 ni, 99.7 id, 0.0 wa, 0.0 hi, 0.0 si, 0.0 st
%Cpu25 : 0.0 us, 0.0 sy, 0.0 ni,100.0 id, 0.0 wa, 0.0 hi, 0.0 si, 0.0 st
%Cpu26 : 0.0 us, 0.3 sy, 0.0 ni, 99.7 id, 0.0 wa, 0.0 hi, 0.0 si, 0.0 st
%Cpu27 : 0.0 us, 0.0 sy, 0.0 ni,100.0 id, 0.0 wa, 0.0 hi, 0.0 si, 0.0 st
%Cpu28 : 0.3 us, 0.3 sy, 0.0 ni, 99.3 id, 0.0 wa, 0.0 hi, 0.0 si, 0.0 st
%Cpu29 : 0.3 us, 1.0 sy, 0.0 ni, 98.3 id, 0.0 wa, 0.3 hi, 0.0 si, 0.0 st
%Cpu30 : 0.0 us, 0.0 sy, 0.0 ni,100.0 id, 0.0 wa, 0.0 hi, 0.0 si, 0.0 st
%Cpu31 : 0.0 us, 0.0 sy, 0.0 ni,100.0 id, 0.0 wa, 0.0 hi, 0.0 si, 0.0 st
KiB Mem: 65936068 total, 24154896 used, 41781172 free, 150808 buffers
KiB Swap: 32940028 total, 40096 used, 32899932 free, 1989836 cached-
si stand for software interrupt. there are spikes of %si and sys (system) usage not letting user-space NGINX to work
kernel:[383975.990716] BUG: soft lockup - CPU#0 stuck for 22s! [nginx:6557] [383975.990716] BUG: soft lockup - CPU#0 stuck for 22s! [nginx:6557]
[383975.991432] Modules linked in: igb_uio(OF) nfnetlink_log nfnetlink bluetooth rfkill nfsv3 nfs_acl ip6table_filter ip6_tables ebtable_nat ebtables ipt_MASQUERADE iptable_nat nf_nat_ipv4 nf_nat nf_conntrack_ipv4 nf_defrag_ipv4 xt_conntrack nf_conntrack xt_CHECKSUM iptable_mangle bridge stp llc nfsv4 dns_resolver nfs lockd sunrpc fscache be2iscsi iscsi_boot_sysfs bnx2i cnic uio cxgb4i cxgb4 cxgb3i cxgb3 libcxgbi ib_iser rdma_cm ib_addr iw_cm ib_cm ib_sa ib_mad ib_core iscsi_tcp libiscsi_tcp libiscsi scsi_transport_iscsi vhost_net i40e(OF) tun vhost ixgbe ses igb acpi_cpufreq acpi_power_meter mdio dca iTCO_wdt iTCO_vendor_support lpc_ich enclosure mfd_core ptp pps_core macvtap macvlan joydev mperf acpi_pad kvm_intel kvm binfmt_misc mgag200 i2c_algo_bit drm_kms_helper ttm drm i2c_core megaraid_sas wmi
[383975.991493] CPU: 0 PID: 6557 Comm: nginx Tainted: GF W O 3.11.10-100.fc18.x86_64 #1
[383975.991495] Hardware name: Cisco Systems Inc UCSC-C240-M4SX/UCSC-C240-M4SX, BIOS C240M4.2.0.6a.0.051220151501 05/12/2015
[383975.991497] task: ffff8808345bcc40 ti: ffff880721026000 task.ti: ffff880721026000
[383975.991499] RIP: 0010:[<ffffffff815bedd7>] [<ffffffff815bedd7>] retransmits_timed_out+0xb7/0xc0
[383975.991508] RSP: 0018:ffff88085fc03d90 EFLAGS: 00000216
[383975.991509] RAX: ffff8809a432f600 RBX: ffff88047f0a1f78 RCX: 0000000000000000
[383975.991510] RDX: 0000000000000000 RSI: 0000000000000003 RDI: ffff88016c038818
[383975.991511] RBP: ffff88085fc03d90 R08: 00000000000000c8 R09: 0000000016da5472
[383975.991513] R10: 0000000000008000 R11: 0000000000000003 R12: ffff88085fc03d08
[383975.991514] R13: ffffffff8167641d R14: ffff88085fc03d90 R15: ffff88016c038700
[383975.991515] FS: 00007f2378385800(0000) GS:ffff88085fc00000(0000) knlGS:0000000000000000
[383975.991517] CS: 0010 DS: 0000 ES: 0000 CR0: 0000000080050033
[383975.991518] CR2: 00007f2383d4f5b8 CR3: 000000083472b000 CR4: 00000000001407f0
[383975.991519] Stack:
[383975.991520] ffff88085fc03dc0 ffffffff815bf762 ffff88085fc03dc0 ffff88016c038700
[383975.991525] ffff88016c038a78 0000000000000100 ffff88085fc03de0 ffffffff815bfb00
[383975.991528] ffff88016c038700 ffff88016c038a78 ffff88085fc03e00 ffffffff815bfc90
[383975.991532] Call Trace:
[383975.991533] <IRQ>
[383975.991538] [<ffffffff815bf762>] tcp_retransmit_timer+0x402/0x700
[383975.991540] [<ffffffff815bfb00>] tcp_write_timer_handler+0xa0/0x1d0
[383975.991543] [<ffffffff815bfc90>] tcp_write_timer+0x60/0x70
[383975.991549] [<ffffffff8107523a>] call_timer_fn+0x3a/0x110
[383975.991552] [<ffffffff815bfc30>] ? tcp_write_timer_handler+0x1d0/0x1d0
[383975.991555] [<ffffffff81076616>] run_timer_softirq+0x1f6/0x2a0
[383975.991560] [<ffffffff8106e1d8>] __do_softirq+0xe8/0x230
[383975.991565] [<ffffffff8101b023>] ? native_sched_clock+0x13/0x80
[383975.991570] [<ffffffff816770dc>] call_softirq+0x1c/0x30
[383975.991576] [<ffffffff81015685>] do_softirq+0x75/0xb0
[383975.991579] [<ffffffff8106e4b5>] irq_exit+0xb5/0xc0
[383975.991582] [<ffffffff816779e3>] do_IRQ+0x63/0xe0
[383975.991586] [<ffffffff8166d1ed>] common_interrupt+0x6d/0x6d
[383975.991587] <EOI>NGINX installed on a 2-socket setup with 8 cores/socket (total of 16 cores/32 threads) cannot handle more than 20K new flows/sec, due to kernel TCP software interrupt and thread processing. The limitation is the kernel and not NGINX server process. With more NICs and optimized distribution, the number of flows could be increased X2, but not more than that.
The total number of packets was approximately 600KPPS (Tx+Rx). The number of active flows was 12K.
TRex with one core could scale to about 25Gb/sec, 3MPPS of the same HTTP profile. The main issue with NGINX and Linux setup is the tunning. It is very hard to let the hardware utilizing the full server resource (half of the server was idel in this case and still experiance a lot of drop) TRex is not perfect too, we couldn’t reach 100% CPU utilization without a drop (CPU was 84%) need to look if we can improve this but at least we are in the right place for optimization.
Back to our question…
To achieve 100Gb/sec with this profile on the server side requires 4 cores for TRex, vs. 20x16 cores for NGINX servers. TRex is faster by a factor of ~80.
In our implementation, each flow requires approximately 500 bytes of memory (Regardless of Tx/Rx rings because of TRex architecture). In the kernel, with a real-world server, TRex optimization can’t be applied and each TCP connection must save memory in Tx/Rx rings. For about 5Gb/sec traffic with this profile, approximately 10GB of memory was required (both NGINX and Kernel). For 100Gb/sec traffic, approximately 200GB is required (If we will do the extrapolation) With a TRex optimized implementation, approximately 100MB is required. TRex thus provides an improvement by a factor or 2000 in the use of memory resources.
TRex user-space TCP implementation along with DPDK library as a stress tool for Stateful network features like Firewall save a lot of memory/CPU resources and is a worthwhile direction for investment.
NGINX application on top of DPDK could improve our benchmark results, this project worth looking at [8].
-
anchor:1[] https://www.nginx.com/blog/inside-nginx-how-we-designed-for-performance-scale/
-
anchor:2[] http://www.seastar-project.org/networking/
-
anchor:3[] https://github.com/Juniper/warp17
-
anchor:4[] https://www.nginx.com/blog/testing-the-performance-of-nginx-and-nginx-plus-web-servers/
-
anchor:5[] https://httpd.apache.org/docs/2.4/programs/ab.html
-
anchor:6[] https://www.nginx.com/blog/tuning-nginx/
-
anchor:7[] https://blog.cloudflare.com/how-to-achieve-low-latency/
-
anchor:8[] https://github.com/ansyun/dpdk-nginx
Hanoh Haim
$more /scratch/nginx_nic_watch.sh
#!/bin/bash

if_re='^[^:]+:\s*(\S+)\s*:.+$'
if_name=foo
mac=00:e0:ed:5d:84:65

function get_name () {
    if [ ! -f /sys/class/net/${if_name}/carrier ]; then
        echo clear arp
        arp -d 48.0.0.2
        echo clear route
        ip route del 16.0.0.0/8

        if [[ `ip -o link | grep $mac` =~ $if_re ]]; then
            if_name=${BASH_REMATCH[1]}
            echo if name: $if_name
            ifconfig $if_name up
            sleep 1

        else
            echo Could not find IF
        fi
    fi
}

while true; do
    while [ "$(cat /sys/class/net/${if_name}/carrier)" == "1" ]; do
        get_name
        sleep 0.1
    done

    echo carrier not 1

    while [ "$(cat /sys/class/net/${if_name}/carrier)" == "0" ]; do
        get_name
        sleep 0.1
    done

    echo carrier not 0

    get_name

    echo conf ip
    ifconfig $if_name 48.0.0.1
    echo $?
    echo conf route
    ip route add 16.0.0.0/8 dev $if_name via 48.0.0.2 initcwnd 2
    echo $?
    echo conf arp
    arp -s 48.0.0.2 00:e0:ed:5d:84:64
    echo $?

    sleep 5