From version 0.1.70, AutoViz can now automatically analyze your dataset and fix data quality issues in your data set. All you have to do is to from autoviz import FixDQ and use it like a fit_transform transformer. It's that easy to perform data cleaning now with AutoViz!

Apr-2023 Update: AutoViz now creates scatter plots for categorical variables when data contains only cat variables
From version 0.1.600 onwards, AutoViz now automatically draws catscatter plots for pairs of categorical variables in a data frame. A catscatter plot is a type of scatter plot that shows the frequency of each combination of categories in two variables. It can be useful for exploring the relationship between categorical variables and identifying patterns or outliers. It creates these plots only if the data contains no numeric variables. Otherwise, it doesn't create them since it would be unncessary.
AutoViz is grateful to the cascatter implementation of Myr Barnés, 2020.
You can see the original here: https://github.com/myrthings/catscatter/blob/master/catscatter.py
# More info about this function here:
# - https://towardsdatascience.com/visualize-categorical-relationships-with-catscatter-e60cdb164395
# - https://github.com/myrthings/catscatter/blob/master/README.md
From version 0.1.50 onwards, AutoViz now automatically analyzes your dataset and provides suggestions for how to clean your data set. It detects missing values, identifies rare categories, finds infinite values, detects mixed data types, and so much more. This will help you tremendously speed up your data cleaning activities. If you have suggestions to add more data cleaning steps please file an Issue in our GitHub and we will gladly consider it. Here is an example of how data cleaning suggestions look:

In order to get this latest function, you must upgrade autoviz to the latest version by:
pip install autoviz --upgrade
In the same version, you can also get data suggestions by using AV.AutoViz(......, verbose=1) or by simply importing it:
from autoviz import data_cleaning_suggestions
data_cleaning_suggestions(df)
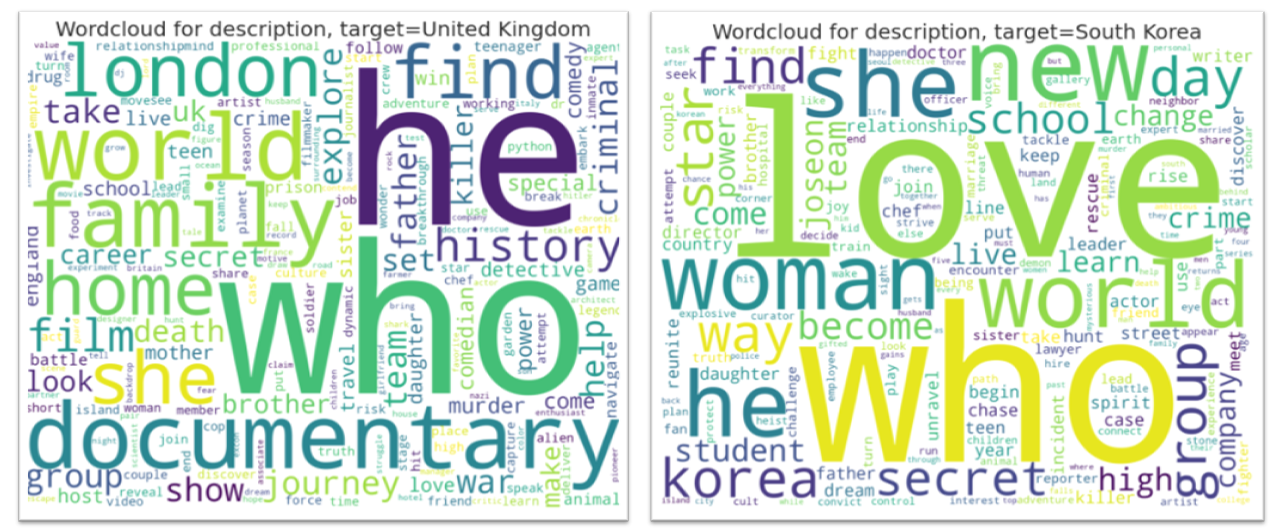
AutoViz can now create Wordclouds automatically for your NLP variables in data. It detects NLP variables automatically and creates wordclouds for them. See Colab notebook for example: AutoViz Demo with HTML setting
Dec 21, 2021: AutoViz now runs on Docker containers as part of MLOps pipelines. Check out Orchest.io
We are excited to announce that AutoViz and Deep_AutoViML are now available as containerized applications on Docker. This means that you can build data pipelines using a fantastic tool like orchest.io to build MLOps pipelines visually. Here are two sample pipelines we have created:
AutoViz pipeline: https://lnkd.in/g5uC-z66 Deep_AutoViML pipeline: https://lnkd.in/gdnWTqCG
You can find more examples and a wonderful video on orchest's web site

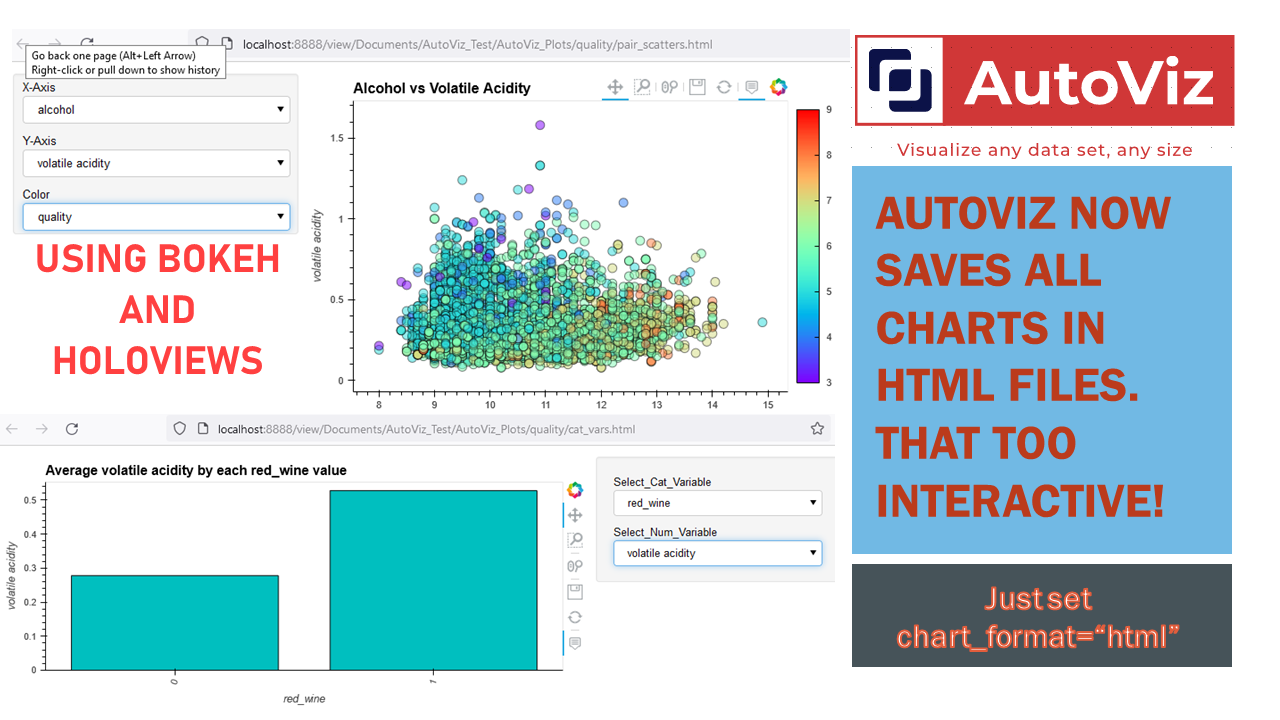
Dec-17-2021 AutoViz now uses HoloViews to display dashboards with Bokeh and save them as Dynamic HTML for web serving #HTML #Bokeh #Holoviews
Now you can use AutoViz to create Interactive Bokeh charts and dashboards (see below) either in Jupyter Notebooks or in the browser. Use chart_format as follows:
chart_format='bokeh': interactive Bokeh dashboards are plotted in Jupyter Notebooks.chart_format='server', dashboards will pop up for each kind of chart on your web browser.chart_format='html', interactive Bokeh charts will be silently saved as Dynamic HTML files underAutoViz_Plotsdirectory