The Apache Airflow mixin is a set of configurable Grafana dashboards and alerts.
The Apache Airflow mixin contains the following dashboards:
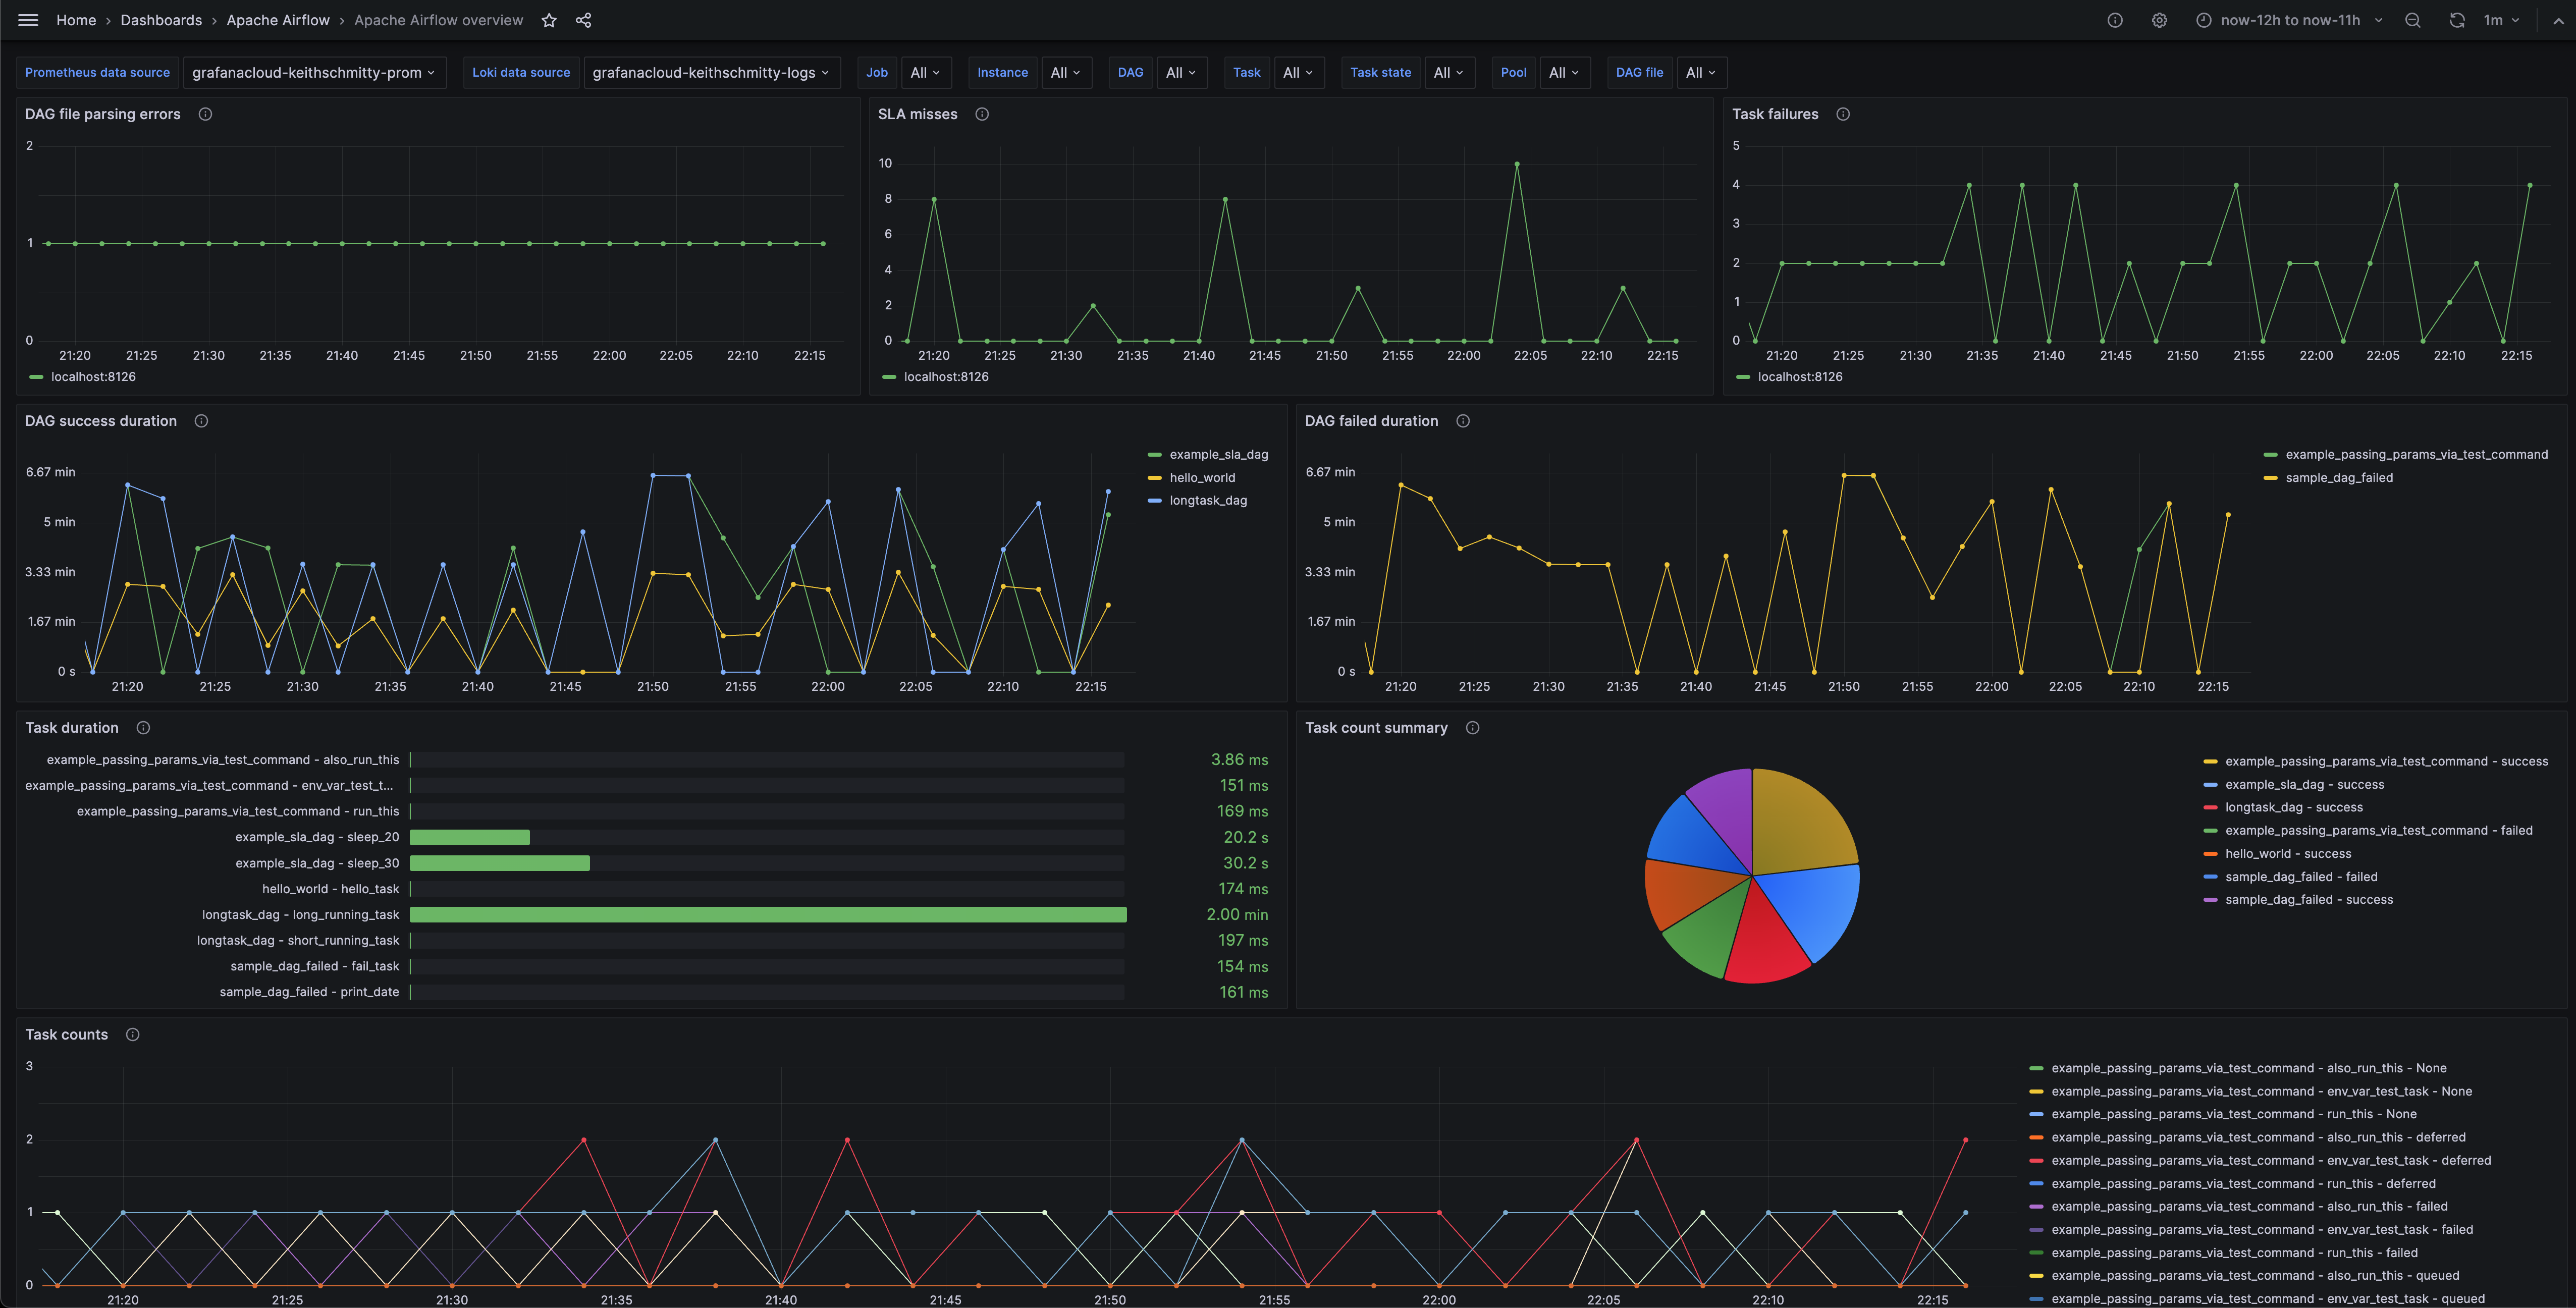
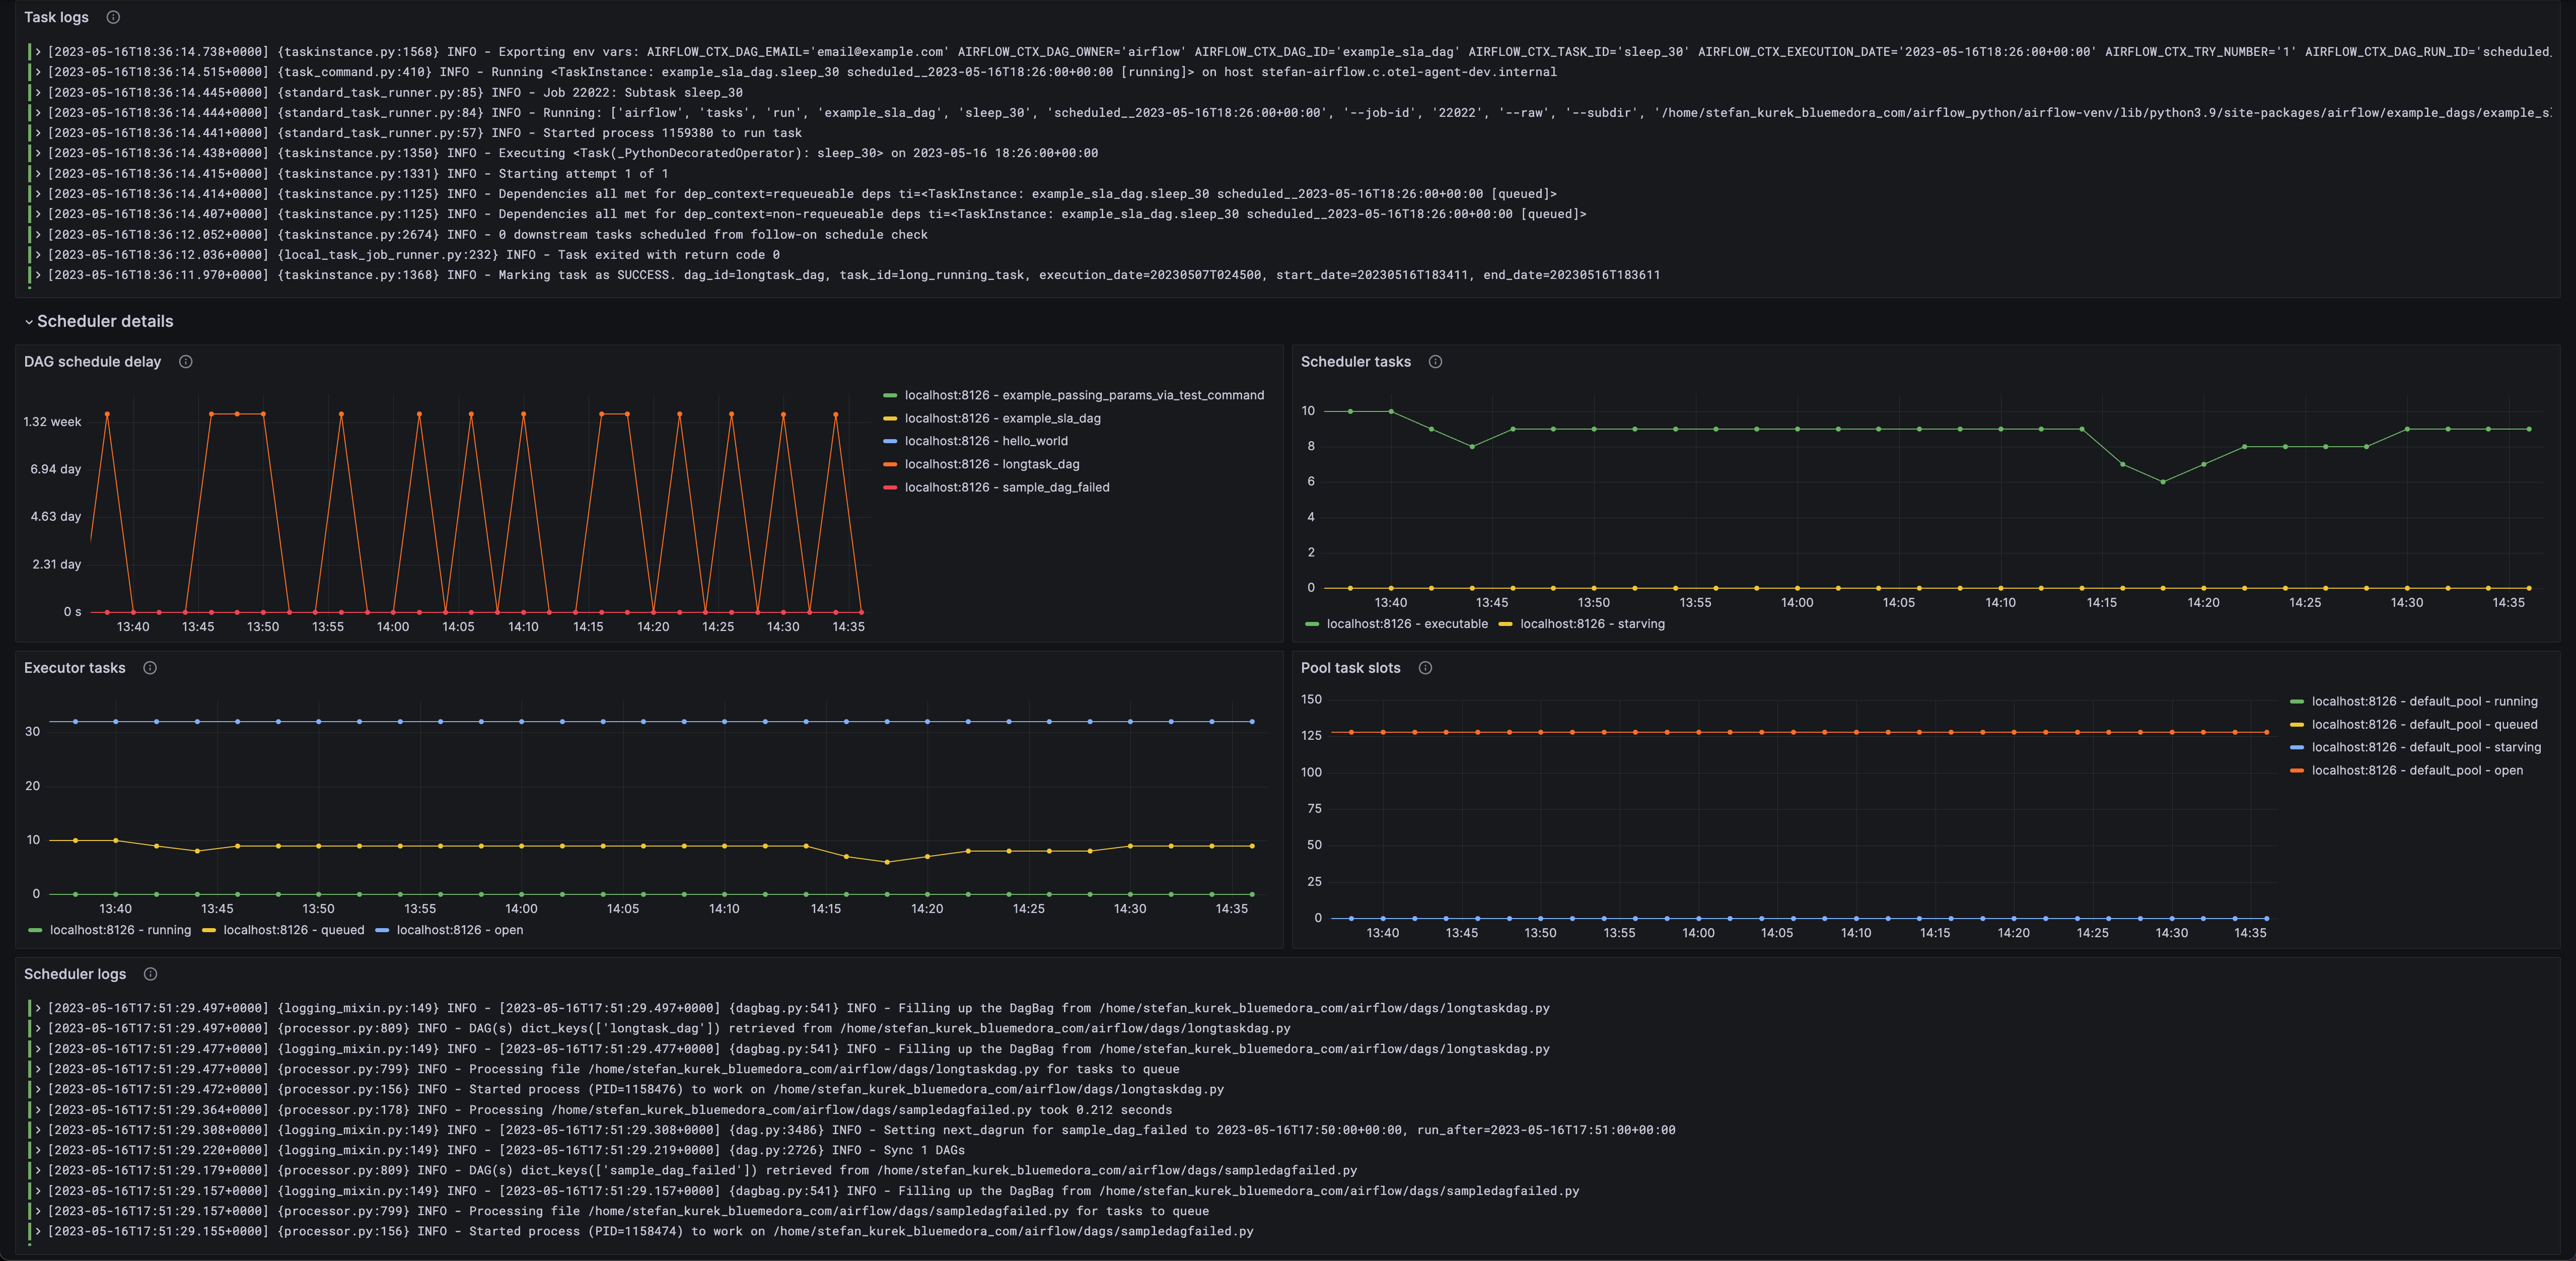
- Apache Airflow overview
and the following alerts:
- ApacheAirflowStarvingPoolTasks
- ApacheAirflowDAGScheduleDelayWarningLevel
- ApacheAirflowDAGScheduleDelayCriticalLevel
- ApacheAirflowDAGFailures
The Apache Airflow overview dashboard provides details on DAG failures, DAG durations, task failures, task durations, scheduler details, executor tasks, and pool task slots for an Apache Airflow system.
Apache Airflow system logs are enabled by default in the config.libsonnet and can be removed by setting enableLokiLogs to false. Then run make again to regenerate the dashboard:
{
  _config+:: {
    enableLokiLogs: false,
  },
}
In order for the selectors to properly work for system logs ingested into your logs datasource, please also include the matching instance and job labels onto the scrape_configs as to match the labels for ingested metrics. Please use the correct $AIRFLOW_HOME directory in the __path__ labels as well. It is also necessary to add matching dag_id and task_id labels for the task logs to match the labels for ingested metrics as well as add labels for dag_file for the scheduler logs to allow for filtering in the dashboard. The correct $AIRFLOW_HOME will also need to be used in the expression regexes.
scrape_configs:
- job_name: integrations/apache-airflow
  static_configs:
  - targets:
    - localhost
    labels:
      job: integrations/apache-airflow
      instance: <instance>
      __path__: <airflow_home>/logs/dag_id=*/**/*.log
  - targets:
    - localhost
    labels:
      job: integrations/apache-airflow
      instance: localhost:8125
      __path__: <airflow_home>/logs/scheduler/latest/*.py.log
  pipeline_stages:
  - match:
      selector: '{job="integrations/apache-airflow",instance="<instance>"}'
      stages:
      - regex:
          source: filename
          expression: "<airflow_home>/logs/dag_id=(?P<dag_id>\\S+?)/.*/task_id=(?P<task_id>\\S+?)/.*log"
      - labels:
          dag_id:
          task_id:
  - match:
      selector: '{job="integrations/apache-airflow",instance="<instance>"}'
      stages:
      - regex:
          source: filename
          expression: "<airflow_home>/logs/scheduler/latest/(?P<dag_file>\\S+?)\\.log"
      - labels:
          dag_file:
  - multiline:
firstline: '\[\d+-\d+-\d+T\d+:\d+:\d+\.\d+\+\d+\]'| Alert | Summary |
|---|---|
| ApacheAirflowStarvingPoolTasks | There are starved tasks detected in the Apache Airflow pool. |
| ApacheAirflowDAGScheduleDelayWarningLevel | The delay in DAG schedule time to DAG run time has reached the warning threshold. |
| ApacheAirflowDAGScheduleDelayCriticalLevel | The delay in DAG schedule time to DAG run time has reached the critical threshold. |
| ApacheAirflowDAGFailures | There have been DAG failures detected. |
Default thresholds can be configured in config.libsonnet
{
  _config+:: {
    alertsCriticalPoolStarvingTasks: 0,
    alertsWarningDAGScheduleDelayLevel: 10,  //s
    alertsCriticalDAGScheduleDelayLevel: 60,  //s
    alertsCriticalFailedDAGs: 0,
  },
}go install github.com/jsonnet-bundler/jsonnet-bundler/cmd/jb@latest
go install github.com/monitoring-mixins/mixtool/cmd/mixtool@latest
# or in brew: brew install go-jsonnetFor linting and formatting, you would also need mixtool and jsonnetfmt installed. If you
have a working Go development environment, it's easiest to run the following:
go install github.com/google/go-jsonnet/cmd/jsonnetfmt@latestThe files in dashboards_out need to be imported
into your Grafana server. The exact details will be depending on your environment.
prometheus_alerts.yaml needs to be imported into Prometheus.
Edit config.libsonnet if required and then build JSON dashboard files for Grafana:
makeFor more advanced uses of mixins, see https://github.com/monitoring-mixins/docs.