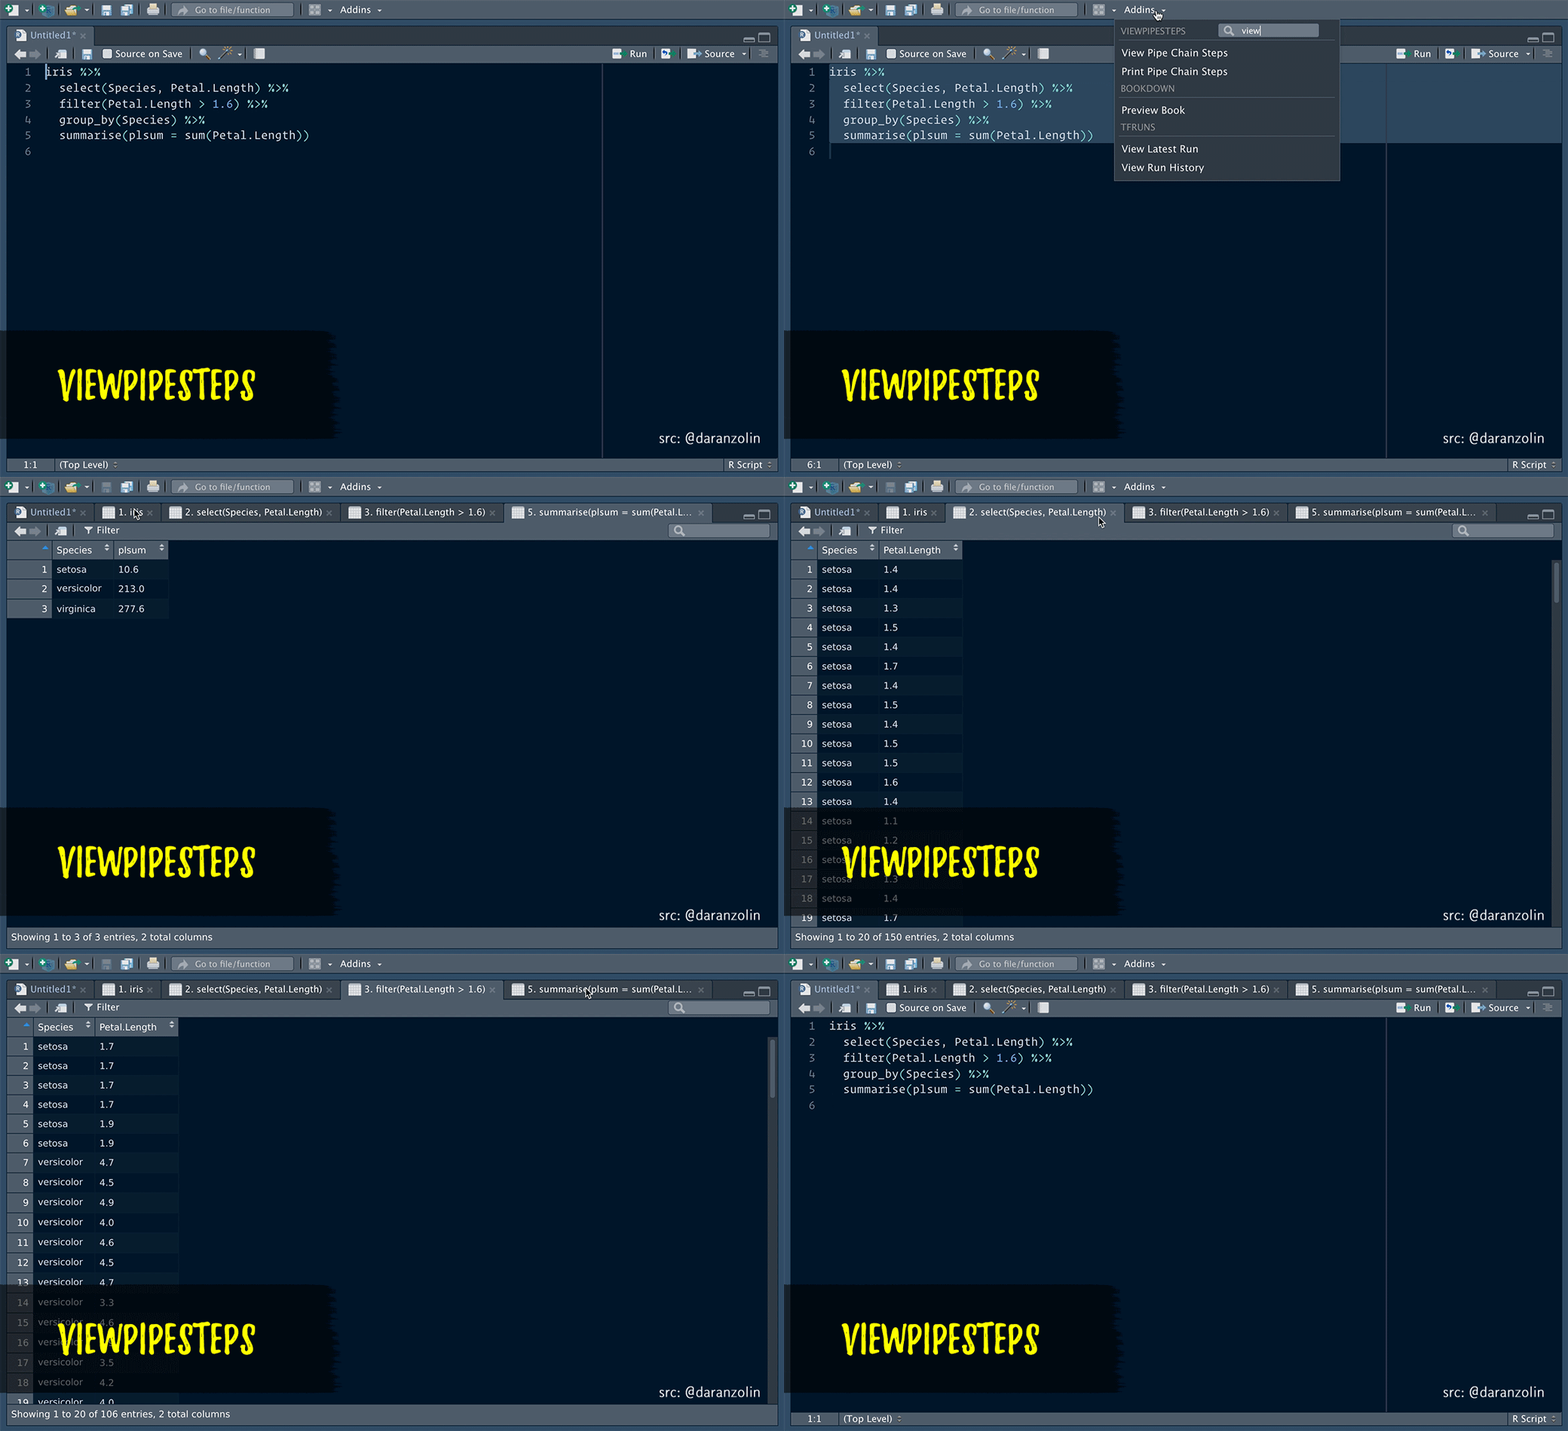
ViewPipeSteps helps to debug pipe chains in a slightly more elegant
fashion. Print/View debugging isn’t sexy, but instead of manually
inserting %>% View() after each step, spice it up a bit by, e.g.,
highlighting the entire chain and calling the viewPipeChain addin:
Thanks to @batpigandme for the the gif!
Alternatively, you can:
- Print each pipe step of the selction to the console by using the
printPipeChainaddin. - Print all pipe steps to the console by adding a print_pipe_steps() call to your pipe.
diamonds %>%
  select(carat, cut, color, clarity, price) %>%
  group_by(color) %>%
  summarise(n = n(), price = mean(price)) %>%
  arrange(desc(color)) %>%
  print_pipe_steps() -> result
## 1. diamonds
## # A tibble: 53,940 x 10
## carat cut color clarity depth table price x y z
## <dbl> <ord> <ord> <ord> <dbl> <dbl> <int> <dbl> <dbl> <dbl>
## 1 0.23 Ideal E SI2 61.5 55 326 3.95 3.98 2.43
## 2 0.21 Premium E SI1 59.8 61 326 3.89 3.84 2.31
## 3 0.23 Good E VS1 56.9 65 327 4.05 4.07 2.31
## 4 0.290 Premium I VS2 62.4 58 334 4.2 4.23 2.63
## 5 0.31 Good J SI2 63.3 58 335 4.34 4.35 2.75
## 6 0.24 Very Good J VVS2 62.8 57 336 3.94 3.96 2.48
## 7 0.24 Very Good I VVS1 62.3 57 336 3.95 3.98 2.47
## 8 0.26 Very Good H SI1 61.9 55 337 4.07 4.11 2.53
## 9 0.22 Fair E VS2 65.1 61 337 3.87 3.78 2.49
## 10 0.23 Very Good H VS1 59.4 61 338 4 4.05 2.39
## # … with 53,930 more rows
## 2. select(carat, cut, color, clarity, price)
## # A tibble: 53,940 x 5
## carat cut color clarity price
## <dbl> <ord> <ord> <ord> <int>
## 1 0.23 Ideal E SI2 326
## 2 0.21 Premium E SI1 326
## 3 0.23 Good E VS1 327
## 4 0.290 Premium I VS2 334
## 5 0.31 Good J SI2 335
## 6 0.24 Very Good J VVS2 336
## 7 0.24 Very Good I VVS1 336
## 8 0.26 Very Good H SI1 337
## 9 0.22 Fair E VS2 337
## 10 0.23 Very Good H VS1 338
## # … with 53,930 more rows
## 4. summarise(n = n(), price = mean(price))
## # A tibble: 7 x 3
## color n price
## <ord> <int> <dbl>
## 1 D 6775 3170.
## 2 E 9797 3077.
## 3 F 9542 3725.
## 4 G 11292 3999.
## 5 H 8304 4487.
## 6 I 5422 5092.
## 7 J 2808 5324.
## 5. arrange(desc(color))
## # A tibble: 7 x 3
## color n price
## <ord> <int> <dbl>
## 1 J 2808 5324.
## 2 I 5422 5092.
## 3 H 8304 4487.
## 4 G 11292 3999.
## 5 F 9542 3725.
## 6 E 9797 3077.
## 7 D 6775 3170.
- Try your luck with the experimental
%P>%pipe variant that prints the output of the pipe’s left hand side prior to piping it to the right hand side.
diamonds %>%
  select(carat, cut, color, clarity, price) %>%
  group_by(color) %>%
  summarise(n = n(), price = mean(price)) %P>%
  arrange(desc(color)) -> result
## Printing diamonds %>% select(carat, cut, color, clarity, price) %>% group_by(color) %>% summarise(n = n(), price = mean(price))
## # A tibble: 7 x 3
## color n price
## <ord> <int> <dbl>
## 1 D 6775 3170.
## 2 E 9797 3077.
## 3 F 9542 3725.
## 4 G 11292 3999.
## 5 H 8304 4487.
## 6 I 5422 5092.
## 7 J 2808 5324.
devtools::install_github("daranzolin/ViewPipeSteps")
Check tools/test_cases.R for more elaborate examples.
- Verify that %P>% is implemented in a useful way and does it what it is supposed to do.

