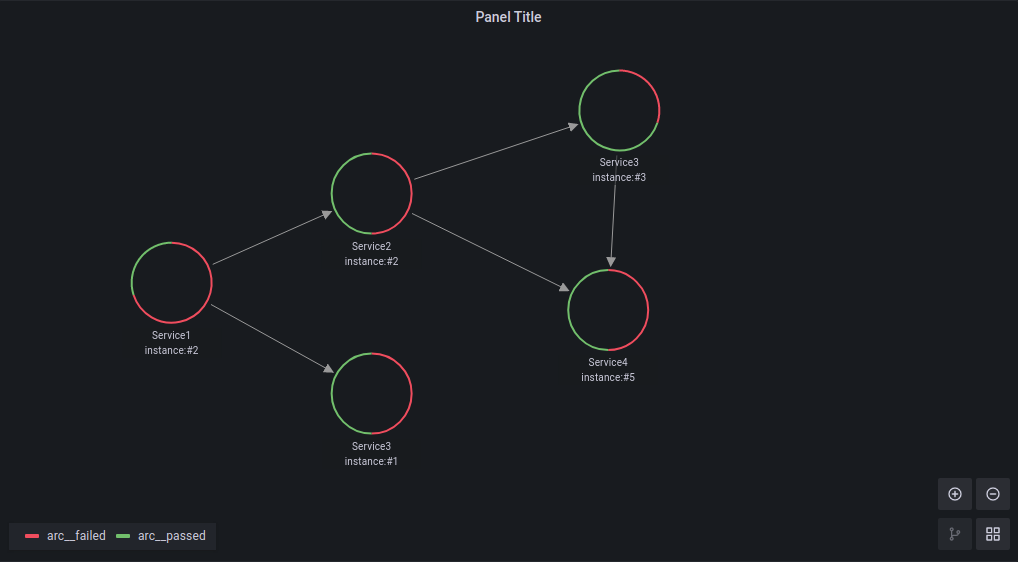
This plugin provides a datasource to connect a REST API to nodegraph panel of Grafana.
Grafana supports a wide range of data sources, including Prometheus, MySQL, and even Datadog. There’s a good chance you can already visualize metrics from the systems you have set up. In some cases, though, you already have an in-house metrics solution that you’d like to add to your Grafana dashboards. Grafana Data Source Plugins enables integrating such solutions with Grafana.
- Use Grafana 7.4 or higher
- Download and place the datasouce in grafana/plugins directory.
This plugin is not signed yet, Grafana will not allow loading it by default. you should enable it by adding:
for example, if you are using Grafana with containers, add:
-e "GF_PLUGINS_ALLOW_LOADING_UNSIGNED_PLUGINS=hamedkarbasi93-nodegraphapi-datasource"-
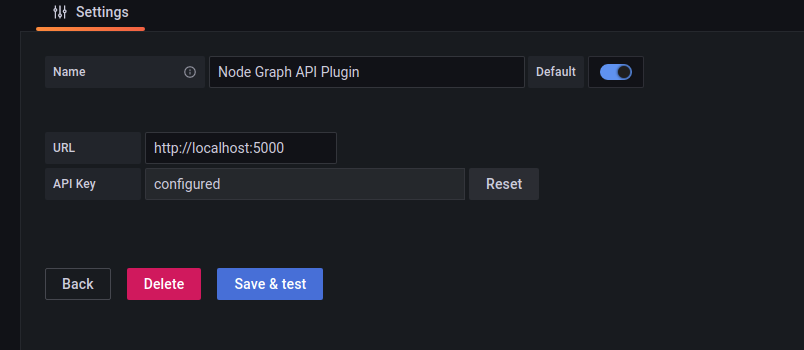
You can now add the the data source. Just enter the url of your API app and push "Save & Test". You will get an error in case of connection failure.
Note: The browser should have access to the application not the grafana server.
- In grafana dashboard, pick the Nodegraph panel and have the graph visualization.
You REST API application should return data in the following format:
Note: You API application should handle CORS policy. Otherwise you will face CORS-Policy error in Grafana.
This route returns the nodes and edges fields defined in the parameter tables.
This would help the plugin to create desired parameters for the graph.
For nodes, id and for edges, id, source and target fields are required and the other fields are optional.
endpoint: /api/graph/fields
method: GET
content type: application/json
content format example:
{
  "edges_fields": [
    {
      "field_name": "id",
      "type": "string"
    },
    {
      "field_name": "source",
      "type": "string"
    },
    {
      "field_name": "target",
      "type": "string"
    },
    {
      "field_name": "mainStat",
      "type": "number"
    }
  ],
  "nodes_fields": [
    {
      "field_name": "id",
      "type": "string"
    },
    {
      "field_name": "title",
      "type": "string"
    },
    {
      "field_name": "mainStat",
      "type": "string"
    },
    {
      "field_name": "secondaryStat",
      "type": "number"
    },
    {
      "color": "red",
      "field_name": "arc__failed",
      "type": "number"
    },
    {
      "color": "green",
      "field_name": "arc__passed",
      "type": "number"
    },
    {
      "displayName": "Role",
      "field_name": "detail__role",
      "type": "string"
    }
  ]
}This route returns the graph data which is intended to visualize.
endpoint: /api/graph/data
method: GET
content type: application/json
Data Format example:
{
    "edges": [
        {
            "id": "1",
            "mainStat": "53/s",
            "source": "1",
            "target": "2"
        }
    ],
    "nodes": [
        {
            "arc__failed": 0.7,
            "arc__passed": 0.3,
            "detail__zone": "load",
            "id": "1",
            "subTitle": "instance:#2",
            "title": "Service1"
        },
        {
            "arc__failed": 0.5,
            "arc__passed": 0.5,
            "detail__zone": "transform",
            "id": "2",
            "subTitle": "instance:#3",
            "title": "Service2"
        }
    ]
}
For more detail of the variables please visit here.
This route is for testing the health of the API which is used by the Save & Test action while adding the plugin.(Part 2 of the Getting Started Section).
Currently, it only needs to return 200 status code in case of a success connection.
endpoint: /api/health
method: GET
success status code: 200
In example folder you can find a simple API application in Python Flask.
- flask
- flask-cors
python run.pyThe application will be started on http://localhost:5000
-
Install dependencies
yarn install
-
Build plugin in development mode or run in watch mode
yarn dev
or
yarn watch
-
Build plugin in production mode
yarn build
- Build a data source plugin tutorial
- Grafana documentation
- Grafana Tutorials - Grafana Tutorials are step-by-step guides that help you make the most of Grafana
- Grafana UI Library - UI components to help you build interfaces using Grafana Design System
Thank you for considering contributing! If you find an issue, or have a better way to do something, feel free to open an issue, or a PR.
This repository is open-sourced software licensed under the Apache License 2.0.

