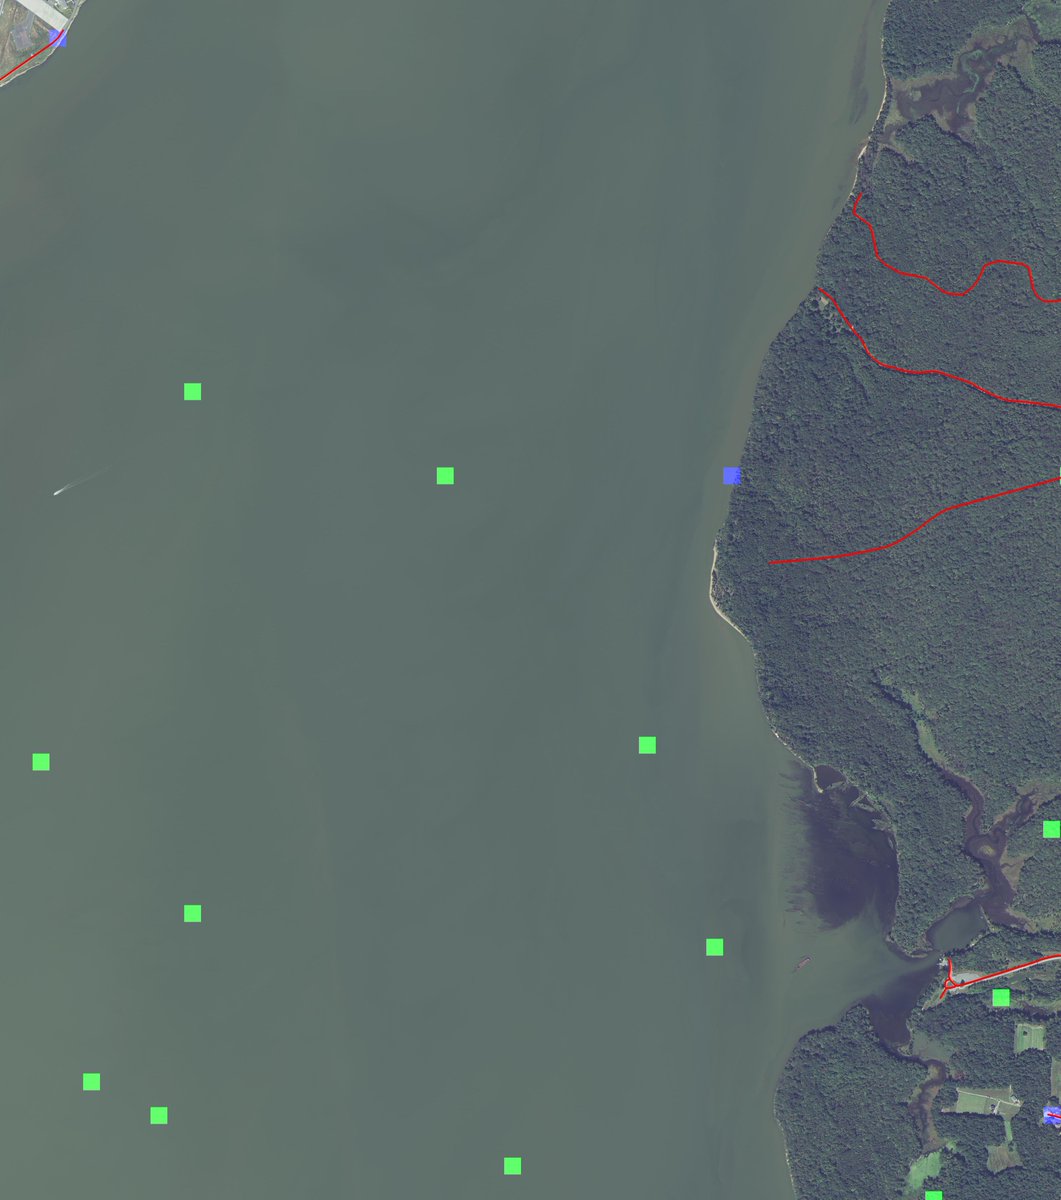
Detect roads and features in satellite imagery, by training neural networks with OpenStreetMap (OSM) data. This code lets you:
- Download a chunk of satellite imagery
- Download OSM data that shows roads/features for that area
- Generate training and evaluation data
Running the code is as easy as install Docker, make dev, and run a script.
Contributions are welcome. Open an issue if you want to discuss something to do, or email me.
By default, DeepOSM will download the minimum necessary training data, and use the simplest possible network.
- It will predict if the center 9px of a 64px tile contains road.
- It will only use the infrared (IR) band, not the RGB bands.
- It will be about 65% accurate, based on how the training/test data is constructed.
- It will use a single fully connected relu layer in TensorFlow.
For training data, DeepOSM cuts tiles out of NAIP images, which provide 1 meter per pixel resolution, with RGB+infrared data bands.
For training labels, DeepOSM uses PBF extracts of OSM data, which contain features/ways in binary format, which can be munged with Python.
The NAIPs come from a requester pays bucket on S3 set up by Mapbox, and the OSM extracts come from geofabrik.
DeepOSM has been run successfully on both Mac and Linux (14.04 and 16.04). You need at least 4GB of memory.
You need AWS credentials to download NAIPs from an S3 requester-pays bucket. This only costs a few cents for a bunch of images, but you need a credit card on file.
-
get your AWS_ACCESS_KEY_ID and AWS_SECRET_ACCESS_KEY from AWS
-
export them as environment variables (and maybe add to your bash or zprofile)
export AWS_ACCESS_KEY_ID='FOO'
export AWS_SECRET_ACCESS_KEY='BAR'
First, install a Docker Binary.
I also needed to set my VirtualBox default memory to 4GB, when running on a Mac. This is easy:
- start Docker, per the install instructions
- stop Docker
- open VirtualBox, and increase the memory of the VM Docker made
Start Docker, then run:
make devInside Docker, the following Python scripts will work. This will download all source data, tile it into training/test data and labels, train the neural net, and generate image and text output.
The default data is eight NAIPs, which gets tiled into NxNx4 bands of data (RGB-IR bands). The training labels derive from PBF files that overlap the NAIPs.
python bin/create_training_data.py
python bin/run_analysis.py
For output, it will produce some console logs, and then JPEGs of the ways, labels, and predictions overlaid on the tiff.
Alternately, development/research can be done via jupyter notebooks:
make notebookTo access the notebook via a browser on your host machine, find the IP VirtualBox is giving your default docker container by running:
docker-machine ls

NAME      ACTIVE   DRIVER       STATE     URL                         SWARM   DOCKER    ERRORS
default   *        virtualbox   Running   tcp://192.168.99.100:2376           v1.10.3
The notebook server is accessible via port 8888, so in this case you'd go to: http://192.168.99.100:8888
- Learning to Detect Roads in High-Resolution Aerial Images (Hinton)
- Machine Learning for Aerial Image Labeling- Minh's 2013 thesis, student of Hinton's best/recent paper on doing this, great success with these methods
- Similar Efforts with OSM Data
- OSM-Crosswalk-Detection - uses Keras to detect crosswalks, a class project (Fall 2015)
- OSM-HOT-ConvNet - attempted use for disaster response, author thinks it's only 69% accurate at pixel level (Fall 2016)
- Parsing Natural Scenes and Natural Language with Recursive Neural Networks (RNNs)
- Links from the Tensorflow site
- MNIST Data and Background
- all the other links to Nielsen’s book and Colah’s blog
- Deep Background
-
New technique for classification of sub-half-meter data into different zones
-
Proposes a way to extract network topology, and maybe this can be used as a post processor?
Recent Recommendations
-
FIND - have you seen a paper from a few years ago about estimating osm completeness by comparing size of compressed satellite images vs number of osm nodes
-
READ - this presentation on using GPS traces to suggest OSM edits (Strava/Telenav): http://webcache.googleusercontent.com/search?q=cache:VoiCwRHOyLUJ:stateofthemap.us/map-tracing-for-millennials/+&cd=3&hl=en&ct=clnk&gl=us
I am reviewing these papers from Google Scholar that both cite the key papers and seem relevant to the topic.
-
http://www.tandfonline.com/doi/abs/10.1080/15481603.2013.802870
-
https://www.computer.org/csdl/proceedings/icpr/2014/5209/00/5209d708-abs.html
-
http://opticalengineering.spiedigitallibrary.org/article.aspx?articleid=1679147
-
http://proceedings.spiedigitallibrary.org/proceeding.aspx?articleid=1354584
-
http://citeseerx.ist.psu.edu/viewdoc/summary?doi=10.1.1.309.8565
-
http://proceedings.spiedigitallibrary.org/proceeding.aspx?articleid=2191094
-
http://www.sciencedirect.com/science/article/pii/S0924271615001690
-
https://www.itc.nl/external/ISPRS_WGIII4/ISPRSIII_4_Test_results/papers/Onera_2D_label_Vaih.pdf
-
http://link.springer.com/chapter/10.1007/978-3-319-23528-8_33#page-1
-
http://www.tandfonline.com/doi/abs/10.1080/01431161.2015.1054049
-
http://citeseerx.ist.psu.edu/viewdoc/download?doi=10.1.1.681.1695&rep=rep1&type=pdf
-
http://www.tandfonline.com/doi/abs/10.3846/20296991.2014.890271
-
http://www.sciencedirect.com/science/article/pii/S0303243415300283
This was the general idea to start, and working with TMS tiles sort of worked (see first 50 or so commits), so DeepOSM got switched to better data:

