This is a hands-on lab/tutorial about running PerfKit Benchmarker (PKB) on Google Cloud. To see PKB in action as quickly as possible, skip past the Overview and complete the following 3 sections:
- Set up
- Task 1. Install PerfKit Benchmarker
- Task 2. Start one benchmark test
- Task 5. Explore the results of a benchmark test
For most users, performance benchmarking is a series of steps in pursuit of an
answer to a performance question.

Challenges often arise in selecting appropriate benchmarks, configuring nontrivial environments, achieving consistent results, and sifting through results for actionable intelligence and reporting.
Conducting performance benchmarking in public cloud adds layers to the challenge. Experiments need to provision resources in cloud, navigate security protections by adjusting firewall rules, and eventually deprovision resources for cost efficiency.
PerfKit Benchmarker was created to aid benchmark selection, execution, and analysis using public cloud resources.
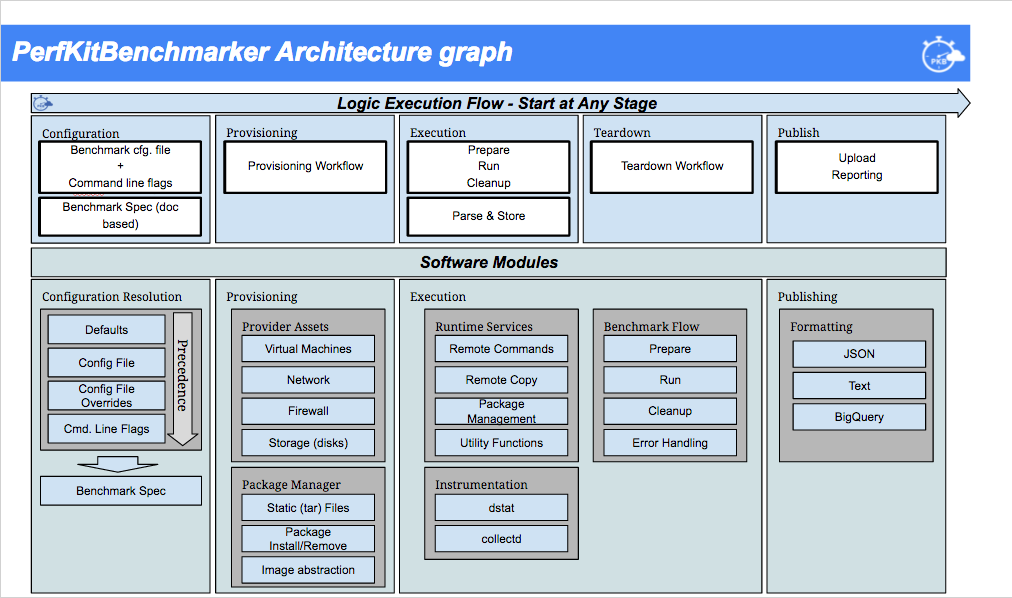
PerfKit Benchmarker is an open source framework with commonly accepted benchmarking tools that you can use to measure and compare cloud providers. PKB automates setup and teardown of resources, including Virtual Machines (VMs), on whichever cloud provider you choose. Additionally, PKB installs and runs the benchmark software tests and provides patterns for saving the test output for future analysis and debugging.
PKB divides benchmarking experiments into a multi-step process:
Configuration > Provisioning > Execution > Teardown > Publish
PKB meets most of the needs of any end-to-end performance benchmarking project.
| Performance Benchmarking Process | PKB Architecture Stage |
|---|
- Identify criteria/problem | Configuration
- Choose benchmark | Configuration
- Execute benchmark tests | Provisioning, Execution, Teardown
- Analyze test data | Publish
This lab demonstrates a pattern for reducing the friction in performance benchmarking by using PKB.
In this lab, you will:
- Install PerfKit Benchmarker
- Start one benchmark test
- Explore PKB command-line flags
- Consider different network benchmarks
- Explore the results of a benchmark test
- Run more benchmark tests using PerfKit Benchmarker
- Understand custom configuration files and benchmark sets
- Push test result data to BigQuery
- Query and visualize result data with Data Studio
Note: this lab is biased to running networking benchmarks, on Google Cloud.
Why networking benchmarks? Networking benchmarks are frequently an initial step in assessing the viability of public cloud environments. Ensuring understandable, repeatable, and defensible experiments is important in gaining agreement to progress to more advanced experiments, and decisions.
- Basic familiarity with Linux command line
- Basic familiarity with Google Cloud
To complete this lab, you'll need:
- Access to a standard internet browser (Chrome browser recommended), where you can access the Cloud Console and the Cloud Shell
- A Google Cloud project
In your browser, open the Cloud Console.
Select your project using the project selector dropdown at the top of page.
From the Cloud Console click the Activate Cloud Shell icon on the top right toolbar:
You may need to click Continue the first time.
It should only take a few moments to provision and connect to your Cloud Shell environment.
This Cloud Shell virtual machine is loaded with all the development tools you'll need. It offers a persistent 5GB home directory, and runs on Google Cloud, greatly enhancing network performance and authentication. All of your work in this lab can be done within a browser on your Google Chromebook.
Once connected to the Cloud Shell, you can verify your setup.
-
Check that you're already authenticated.
gcloud auth listExpected output
 Credentialed accounts:
ACTIVE  ACCOUNT
*       <myaccount>@<mydomain>.com
Note:
gcloudis the powerful and unified command-line tool for Google Cloud. Full documentation is available from https://cloud.google.com/sdk/gcloud. It comes pre-installed on Cloud Shell. Noticegcloudsupports tab-completion. -
Verify your project is known.
gcloud config list projectExpected output
[core]
project = <PROJECT_ID>
If it is not, you can set it with this command:
gcloud config set project <PROJECT_ID>Expected output
Updated property [core/project].
OS Login is now enabled by default on this project, and any VM instances created. OS Login enables the use of Compute Engine IAM roles to manage SSH access to Linux instances.
PKB, however, uses legacy SSH keys for authentication, so OS Login must be disabled.
In Cloud Shell, disable OS Login for the project.
gcloud compute project-info add-metadata --metadata enable-oslogin=FALSE
In this lab, you use Cloud Shell and the PKB repo in GitHub.
-
Set up a virtualenv isolated Python environment within Cloud Shell.
python3 -m venv $HOME/my_virtualenvsource $HOME/my_virtualenv/bin/activate -
Ensure Google Cloud SDK tools like bq find the proper Python.
export CLOUDSDK_PYTHON=$HOME/my_virtualenv/bin/python -
Clone the PerfKitBenchmarker repository.
cd $HOME && git clone https://github.com/GoogleCloudPlatform/PerfKitBenchmarker.gitcd PerfKitBenchmarker/ -
Install PKB dependencies.
pip install -r requirements.txt
Note: As part of this lab, you will will run a few basic tests on Google Cloud within a simple PKB environment. Additional setup may be required to run benchmarks on other providers, or to run more complex benchmarks. Comprehensive instructions for running other benchmarks can be located by reviewing the README in the PKB repo.
The --benchmarks flag is used to select the benchmark(s) run.
Not supplying --benchmarks is the same as using --benchmarks="standard_set",
which takes hours to run. The standard_set is a collection of commonly used
benchmarks. You can read more about benchmark sets later in this lab.
Cloud benchmark tests commonly need at least 10 minutes to complete because of the many resources, including networks, firewall rules, and VMs, that must be both provisioned and de-provisioned.
Start a benchmark test now, and then continue working through the lab while the test executes.
Run the commonly used network throughput test, iperf, with small machines: n1-standard-1.
Expected duration: ~13-14min.
./pkb.py --benchmarks=iperf
Note: while the
iperftest is running, continue through both Task 3, and Task 4.
When the benchmark run completes, expected output will include four throughput numbers, from four 60s runs:
- traffic over external IPs, vm1>vm2
- traffic over internal IPs, vm1>vm2
- traffic over external IPs, vm2>vm1
- traffic over internal IPs, vm2>vm1
Output (do not copy)
...
-------------------------PerfKitBenchmarker Results Summary-------------------------
IPERF:
  Throughput  1973.000000 Mbits/sec  (ip_type="external" receiving_machine_type="n1-standard-1" ...
  Throughput  1973.000000 Mbits/sec  (ip_type="internal" receiving_machine_type="n1-standard-1" ...
  Throughput  1967.000000 Mbits/sec  (ip_type="external" receiving_machine_type="n1-standard-1" ...
  Throughput  1973.000000 Mbits/sec  (ip_type="internal" receiving_machine_type="n1-standard-1" ...
...
------------------------------------------
Name   UID     Status     Failed Substatus
------------------------------------------
iperf  iperf0  SUCCEEDED
------------------------------------------
Success rate: 100.00% (1/1)
...
You could run benchmark tests right now with no other set up required.
Don't do this just yet, but if you execute ./pkb.py with no command-line
flags, PKB will attempt to run a standard set of benchmarks on default
machine types in the default region. Running this set takes hours. You can
read more about the standard_set later in this lab.
Instead, it is more common to choose specific benchmarks and options using command-line flags.
You should understand how the --cloud provider, --project, --zone, and
--machine_type flags work.
--cloud: As Google Cloud is the default cloud provider for PKB, the--cloudflag has a default value of GCP.--project: PKB needs to have a Google Cloud PROJECT-ID to manage resources and run benchmarks. When using Cloud Shell in this lab, PKB infers the--projectfrom the environment PROJECT-ID.--zone: Every cloud provider has a default zone. For Google Cloud, the--zoneflag defaults tous-central1-a.--machine_type: Benchmarks are frequently tightly coupled to specific machine capabilities, especially CPU and memory. You can pick your specific machines with the--machine_typeflag. Most benchmark tests, including the common networking benchmarks ping, iperf, and netperf, default to the provider-specificdefault_single_coremachine. On Google Cloud, the default machine is then1-standard-1.
You can learn more about alternative flag values in the Useful Global Flags section of the PKB readme.
While iperf is running, explore PKB benchmarks and flags.
-
Open a second Cloud Shell session.
Click the Open a new tab button on top of the existing Cloud Shell to open a second Cloud Shell session.
-
Activate virtualenv in this session.
source $HOME/my_virtualenv/bin/activate -
Change to the PerfKitBenchmarker directory.
cd $HOME/PerfKitBenchmarker -
Review all the global flags for PKB.
./pkb.py --helpmatch=pkbPKB includes the
--helpmatchflag which can be used to discover details about benchmarks and related configuration flags. You can pass--helpmatcha regex and it will print related help text. -
Review the full list of benchmarks available.
./pkb.py --helpmatch=benchmarks | grep perfkitbenchmarker
./pkb.py --helpmatch=benchmarks | grep perfkitbenchmarker | wc -l
The
--benchmarksflag, you used it previously, selects a specific benchmark or benchmark set.You should see around 80 different benchmarks available to run, within the linux_benchmarks and windows_benchmarks collections.
PKB has a naming convention for benchmarks of [COLLECTION]_benchmarks.[NAME]_benchmark. For example:
linux_benchmarks.ping_benchmark linux_benchmarks.iperf_benchmark linux_benchmarks.netperf_benchmark -
Review the available Linux benchmarks using --helpmatchmd.
./pkb.py --helpmatchmd=linux_benchmarksWhen you want to review the details and flags of a benchmark in depth, it can be easier to read formatted MarkDown. The
--helpmatchmdflag emits more easily readable MarkDown text than--helpmatch.You can use
moreto view the results page by page. -
Review the flags for the netperf benchmark.
Each benchmark, such as netperf, can have custom flags too.
./pkb.py --helpmatchmd=netperfOutput (do not copy)
### [perfkitbenchmarker.linux_benchmarks.netperf_benchmark ](../perfkitbenchmarker/linux_benchmarks/netperf_benchmark.py) #### Description: Runs plain netperf in a few modes. docs: http://www.netperf.org/svn/netperf2/tags/netperf-2.4.5/doc/netperf.html#TCP_005fRR manpage: http://manpages.ubuntu.com/manpages/maverick/man1/netperf.1.html Runs TCP_RR, TCP_CRR, and TCP_STREAM benchmarks from netperf across two machines. #### Flags: `--netperf_benchmarks`: The netperf benchmark(s) to run. (default: 'TCP_RR,TCP_CRR,TCP_STREAM,UDP_RR') (a comma separated list) `--[no]netperf_enable_histograms`: Determines whether latency histograms are collected/reported. Only for *RR benchmarks (default: 'true') `--netperf_max_iter`: Maximum number of iterations to run during confidence interval estimation. If unset, a single iteration will be run. (an integer in the range [3, 30]) `--netperf_num_streams`: Number of netperf processes to run. Netperf will run once for each value in the list. (default: '1') (A comma-separated list of integers or integer ranges. Ex: -1,3,5:7 is read as -1,3,5,6,7.) `--netperf_test_length`: netperf test length, in seconds (default: '60') (a positive integer) `--netperf_thinktime`: Time in nanoseconds to do work for each request. (default: '0') (an integer) `--netperf_thinktime_array_size`: The size of the array to traverse for thinktime. (default: '0') (an integer) `--netperf_thinktime_run_length`: The number of contiguous numbers to sum at a time in the thinktime array. (default: '0') (an integer) ### [perfkitbenchmarker.linux_packages.netperf ](../perfkitbenchmarker/linux_packages/netperf.py) #### Description: Module containing netperf installation and cleanup functions. #### Flags: `--netperf_histogram_buckets`: The number of buckets per bucket array in a netperf histogram. Netperf keeps one array for latencies in the single usec range, one for the 10-usec range, one for the 100-usec range, and so on until the 10-sec range. The default value that netperf uses is 100. Using more will increase the precision of the histogram samples that the netperf benchmark produces. (default: '100') (an integer) -
Review the flags for the iperf benchmark.
Compare the flags for iperf with previous flags. You can set multiple flags to customize these benchmark runs.
./pkb.py --helpmatchmd=iperfOutput (do not copy)
### [perfkitbenchmarker.linux_benchmarks.iperf_benchmark
     ](../perfkitbenchmarker/linux_benchmarks/iperf_benchmark.py)

#### Description:

Runs plain Iperf.

Docs:
http://iperf.fr/

Runs Iperf to collect network throughput.

#### Flags:

`--iperf_runtime_in_seconds`: Number of seconds to run iperf.
    (default: '60')
    (a positive integer)

`--iperf_sending_thread_count`: Number of connections to make to the server for
sending traffic.
    (default: '1')
    (a positive integer)

`--iperf_timeout`: Number of seconds to wait in addition to iperf runtime before
killing iperf client command.
    (a positive integer)

### [perfkitbenchmarker.windows_packages.iperf3
     ](../perfkitbenchmarker/windows_packages/iperf3.py)

#### Description:

Module containing Iperf3 windows installation and cleanup functions.

#### Flags:

`--bandwidth_step_mb`: The amount of megabytes to increase bandwidth in each UDP
stream test.
    (default: '100')
    (an integer)

`--max_bandwidth_mb`: The maximum bandwidth, in megabytes, to test in a UDP
stream.
    (default: '500')
    (an integer)

`--min_bandwidth_mb`: The minimum bandwidth, in megabytes, to test in a UDP
stream.
    (default: '100')
    (an integer)

`--[no]run_tcp`: setting to false will disable the run of the TCP test
    (default: 'true')

`--[no]run_udp`: setting to true will enable the run of the UDP test
    (default: 'false')

`--socket_buffer_size`: The socket buffer size in megabytes. If None is
specified then the socket buffer size will not be set.
    (an integer)

`--tcp_number_of_streams`: The number of parrallel streams to run in the TCP
test.
    (default: '10')
    (an integer)

`--tcp_stream_seconds`: The amount of time to run the TCP stream test.
    (default: '3')
    (an integer)

`--udp_buffer_len`: UDP packet size in bytes.
    (default: '100')
    (an integer)

`--udp_client_threads`: Number of parallel client threads to run.
    (default: '1')
    (an integer)

`--udp_stream_seconds`: The amount of time to run the UDP stream test.
    (default: '3')
    (an integer)
You can exit the second Cloud Shell session now.
PerfKitBenchmarker includes 3 widely used networking benchmarks: ping, iperf, and netperf. Each of these network tests can be useful in different situations. Below is a short summary of each of these benchmarks.
The ping command is the most widely distributed and is commonly used to verify connectivity and measure simple network latency. It measures the round trip time (rtt) of ICMP packets.
The iperf tool is easy to use and is used to measure network throughput using TCP or UDP streams. It supports multiple threads streaming data simultaneously. It has a variety of parameters that can be set to test and maximize throughput.
The netperf tool contains several different test types. You can use TCP_RR, TCP request-response, to test network latency. You can run TCP_STREAM to test network throughput.
You can run multiple instances of netperf in parallel to heavily stress links via multiple processors. The netperf tool also supports running UDP latency and throughput tests.
With netperf, you can also see alternative reporting flavors with its data histograms.
In many cases, it is recommended to run combinations of all three networking benchmark tools and use the additional test result data to confirm your findings.
The iperf test you started, should now be completed. Return to the first Cloud Shell session to review the test results from iperf.
Detailed output from benchmark execution is printed to the terminal, and saved
to log files under /tmp/perfkitbenchmarker/runs/.
Whether you scroll back in the Cloud Shell, or look through the pkb.log file,
you can review many details about the benchmark pass:
- PKB details: version# and flags used.
- Resources being provisioned: an auto-mode VPC network, two firewall rules, one for internal IPs and another for external IPs, two VM instances, and attached persistent-disks.
- Software setup: Setup directories on both VMs, installations of python, iperf, and other packages.
- System configuration: adjustments to kernel settings, including
tcp_congestion_control. - Test execution: this iperf benchmark runs 4 different tests:
- VM1->VM2 throughput test over external IPs
- VM1->VM2 throughput test over internal IPs
- VM2->VM1 throughput test over external IPs
- VM2->VM1 throughput test over internal IPs
- Resources being cleaned up: deprovision the resources created earlier.
- Detailed result data:
- Detailed metadata describing the resources allocated.
- Metrics: including timestamp, units, and values for measurements.
- Results Summary: an easy-to-read table with the key metrics and values.
- Overall test status: especially useful when multiple benchmarks have run.
When you have time, later, run a few more networking benchmarks. Explore the log
output, and results summaries carefully. Consider adjusting flags for the
benchmarks by looking through the --helpmatchmd output.
-
Run a test to determine the TCP latency and throughput between two machines in a single zone.
Note: as of 2020, the netperf benchmark runs netperf v2.7.0 customized by some PKB-specific patches.
Expected duration: ~16-20min.
The netperf benchmark takes a little longer than iperf because the binaries are compiled on the VMs, and the VMs are rebooted to apply kernel/system configuration changes.
./pkb.py --benchmarks=netperf --netperf_benchmarks="TCP_RR,TCP_STREAM"Output (do not copy)
-------------------------PerfKitBenchmarker Results Summary------------------------- NETPERF: ... TCP_RR_Latency_p50 86.000000 us (ip_type="internal" ...) TCP_RR_Latency_p90 177.000000 us (ip_type="internal" ...) TCP_RR_Latency_p99 273.000000 us (ip_type="internal" ...) TCP_RR_Latency_min 58.000000 us (ip_type="internal" ...) TCP_RR_Latency_max 49808.000000 us (ip_type="internal" ...) TCP_RR_Latency_stddev 142.160000 us (ip_type="internal" ...) ... TCP_STREAM_Throughput 1956.770000 Mbits/sec (ip_type="external" ...) TCP_STREAM_Throughput 1965.250000 Mbits/sec (ip_type="internal" ...) ... End to End Runtime 1095.321094 seconds ... ---------------------------------------------- Name UID Status Failed Substatus ---------------------------------------------- netperf netperf0 SUCCEEDED ---------------------------------------------- Success rate: 100.00% (1/1) ... -
View pkb.log and explore the results.
Retrieve the path to your pkb.log file, which is printed at the very end of your test pass.
Output (do not copy)
Success rate: 100.00% (1/1)
2019-10-18 08:28:35,619 c7fe6185 MainThread pkb.py:1132 INFO     Complete logs can be found at: /tmp/perfkitbenchmarker/runs/c7fe6185/pkb.log
Review that file for detailed results. The final metrics are published near the bottom of the file.
- For latency, search on
TCP_RR_Latency. - For throughput, search on
TCP_STREAM_Throughput. - For general documentation on these metrics, see the Netperf manual.
- For latency, search on
-
Run a test to determine the UDP latency and throughput between two machines in a single zone.
Note: as of 2020, the netperf benchmark runs netperf v2.7.0 customized by some PKB-specific patches.
Expected duration: ~16-20min.
The netperf benchmark takes a little longer than iperf because the binaries are compiled on the VMs, and the VMs are rebooted to apply kernel/system configuration changes.
./pkb.py --benchmarks=netperf --netperf_benchmarks="UDP_RR,UDP_STREAM"Output (do not copy)
-------------------------PerfKitBenchmarker Results Summary------------------------- NETPERF: ... UDP_RR_Transaction_Rate 955.900000 transactions_per_second (ip_type="external") UDP_RR_Latency_p50 1039.000000 us (ip_type="external") UDP_RR_Latency_p90 1099.000000 us (ip_type="external") UDP_RR_Latency_p99 1271.000000 us (ip_type="external") UDP_RR_Latency_min 916.000000 us (ip_type="external") UDP_RR_Latency_max 45137.000000 us (ip_type="external") UDP_RR_Latency_stddev 399.500000 us (ip_type="external") ... UDP_RR_Transaction_Rate 7611.790000 transactions_per_second (ip_type="internal") UDP_RR_Latency_p50 112.000000 us (ip_type="internal") UDP_RR_Latency_p90 195.000000 us (ip_type="internal") UDP_RR_Latency_p99 286.000000 us (ip_type="internal") UDP_RR_Latency_min 71.000000 us (ip_type="internal") UDP_RR_Latency_max 50566.000000 us (ip_type="internal") UDP_RR_Latency_stddev 163.220000 us (ip_type="internal") End to End Runtime 1095.321094 seconds ... ---------------------------------------------- Name UID Status Failed Substatus ---------------------------------------------- netperf netperf0 SUCCEEDED ---------------------------------------------- Success rate: 100.00% (1/1) ... -
View pkb.log and explore the results.
Retrieve the path to your pkb.log file, which is printed at the very end of your test pass.
Output (do not copy)
Success rate: 100.00% (1/1)
2019-10-18 08:28:35,619 c7fe6185 MainThread pkb.py:1132 INFO     Complete logs can be found at: /tmp/perfkitbenchmarker/runs/c7fe6185/pkb.log
Review that file for detailed results. The final metrics are published near the bottom of the file.
- For latency, search on
UDP_RR_Latency. - For general documentation on these metrics, see the Netperf manual.
- For latency, search on
Run a test to determine the latency between two machines in a single zone.
Expected duration: ~11-12min.
Select the machine_type:
./pkb.py --benchmarks=ping --machine_type=f1-micro
Or, select the zone:
./pkb.py --benchmarks=ping --zone=us-east1-b
Or, both:
./pkb.py --benchmarks=ping --zone=us-east1-b --machine_type=f1-micro
Google Cloud supports 32 Gbps network egress bandwidth using Skylake or later CPU platforms.
Note: this experiment requires 2 VMs with 16 vCPUs. You may be restricted from running this experiment in Qwiklabs due to resource caps. Tests with many vCPUs and significant egress will be more costly.
-
Run netperf to verify max throughput between two machines in a single zone.
Expected duration: ~12-15min.
./pkb.py --benchmarks=netperf --zone=us-central1-b \
    --machine_type=n1-standard-16 --gcp_min_cpu_platform=skylake \
    --netperf_benchmarks=TCP_STREAM \
    --netperf_num_streams=8 \
    --netperf_test_length=120
Output (do not copy)
-------------------------PerfKitBenchmarker Results Summary-------------------------
NETPERF:
  ...
  TCP_STREAM_Throughput_average    857.842500 Mbits/sec  (ip_type="external" ...)
  ...
  TCP_STREAM_Throughput_total     6862.740000 Mbits/sec  (ip_type="external" ...)
  ...
  TCP_STREAM_Throughput_average   3931.540000 Mbits/sec  (ip_type="internal" ...)
  ...
  TCP_STREAM_Throughput_total    31452.320000 Mbits/sec  (ip_type="internal" ...)
  ...
----------------------------------------------
Name     UID       Status     Failed Substatus
----------------------------------------------
netperf  netperf0  SUCCEEDED
----------------------------------------------
Success rate: 100.00% (1/1)
...
Notice that traffic traversing between VMs over external IPs cannot achieve the same throughput as when using internal IPs between VMs.
-
Consider the
--netperf_num_streamsargument.In order to maximize probable throughput, the test must use many threads/streams. The precise number of threads/streams required varies. Factors affecting the variation include the current congestion in the network fabric between VMs, and the details of the underlying hardware/software environment.
-
Consider the
--netperf_test_lengthargument.Per stream variation is usually narrowed by running the tests with longer runtimes than the default
60s. -
View pkb.log and explore the results, for more details on streams.
Retrieve the path to your pkb.log file, which is printed at the very end of your test pass.
Output (do not copy)
Success rate: 100.00% (1/1)
2019-10-18 08:28:35,619 c7fe6185 MainThread pkb.py:1132 INFO     Complete logs can be found at: /tmp/perfkitbenchmarker/runs/c7fe6185/pkb.log
Review that pkb.log file for detailed results. The final metrics are published near the bottom of the file, under
PerfKitBenchmarker Results Summary.- For throughput, search on
Throughput_total. - For general documentation on these metrics, see the Netperf Homepage.
- For details on per-thread/stream performance, search on
Throughput_average. You can see that each thread/stream throughput experiences great variation. It's common to see threads/streams with throughput ranging from 2 Gbps upto 6 Gbps, when using internal IP addresses.
Note: this is not necessarily the range or limit for a single stream. If your interest is in single-stream performance, then you should run single-stream tests.
- For throughput, search on
-
Check out out this Andromeda 2.2 blog post for more details on high throughput VMs; 100 Gbps bandwidth use cases and configurations are described.
Google Cloud supports 32 Gbps network egress bandwidth using Skylake or later CPU platforms.
Note: this experiment requires 2 VMs with 16 vCPUs. You may be restricted from running this experiment in Qwiklabs due to resource caps. Tests with many vCPUs and significant egress will be more costly.
-
Run iperf to verify max throughput between two machines in a single zone.
Expected duration: ~12-15min.
./pkb.py --benchmarks=iperf --zone=us-central1-b \
    --machine_type=n1-standard-16 --gcp_min_cpu_platform=skylake \
    --iperf_runtime_in_seconds=120 \
    --iperf_sending_thread_count=8
Output (do not copy)
-------------------------PerfKitBenchmarker Results Summary-------------------------
IPERF:
  Throughput 7092.000000 Mbits/sec   (ip_type="external" ...)
  Throughput 31557.000000 Mbits/sec  (ip_type="internal" ...)
...
------------------------------------------
Name   UID     Status     Failed Substatus
------------------------------------------
iperf  iperf0  SUCCEEDED
------------------------------------------
Success rate: 100.00% (1/1)
...
Notice that traffic traversing between VMs over external IPs cannot achieve the same throughput as when using internal IPs between VMs.
-
Consider the
--iperf_sending_thread_countargument.In order to maximize probable throughput, the test must use many threads/streams. The precise number of threads/streams required varies. Factors affecting the variation include the current congestion in the network fabric between VMs, and the details of the underlying hardware/software environment.
-
Consider the
--iperf_runtime_in_secondsargument.Per stream variation is usually narrowed by running the tests with longer runtimes than the default
60s. -
View pkb.log and explore the results, for more details on streams.
Retrieve the path to your pkb.log file, which is printed at the very end of your test pass.
Output (do not copy)
Success rate: 100.00% (1/1)
2019-10-18 08:28:35,619 c7fe6185 MainThread pkb.py:1132 INFO     Complete logs can be found at: /tmp/perfkitbenchmarker/runs/c7fe6185/pkb.log
Review that pkb.log file for detailed results. The final metrics are published near the bottom of the file, under
PerfKitBenchmarker Results Summary.- For throughput, search on
Throughput. - For general documentation on these metrics, see the iPerf manual.
- For details on per-thread/stream performance, search on
Transfer. You can see that each thread/stream throughput experiences great variation. It's common to see threads/streams with throughput ranging from 2 Gbps upto 6 Gbps, when using internal IP addresses.
Note: this is not necessarily the range or limit for a single stream. If your interest is in single-stream performance, then you should run single-stream tests.
- For throughput, search on
-
Check out out this Andromeda 2.2 blog post for more details on high throughput VMs; 100 Gbps bandwidth use cases and configurations are described.
The easiest way to run networking benchmarks between two specific zones, with specific flags, is to use benchmark configuration files.
Create a sample benchmark config file:
cat << EOF > ./sample_config.yml
iperf:
  vm_groups:
    vm_1:
      cloud: GCP
      vm_spec:
        GCP:
          machine_type: n1-standard-2
          zone: us-central1-b
    vm_2:
      cloud: GCP
      vm_spec:
        GCP:
          machine_type: n1-standard-2
          zone: us-east1-b
flags:
  iperf_sending_thread_count: 5
  iperf_runtime_in_seconds: 30
EOF
This configuration file runs iperf between a VM in zone us-central1-b and
a VM in zone us-east1-b, with 5 sending threads, with 2 vCPU machines, for 30
seconds each.
You can set the cloud provider, zone, machine type, and many other options for each VM in the config file.
When you have time later, run this benchmark by creating and using the config file.
Expected duration: 10-11min.
./pkb.py --benchmark_config_file=./sample_config.yml --benchmarks=iperf
Note: even though the config file includes the benchmark name, you must
still supply the --benchmarks flag.
Output (do not copy)
-------------------------PerfKitBenchmarker Results Summary-------------------------
...
IPERF:
  Throughput                         3606.000000 Mbits/sec
(ip_type="external" receiving_machine_type="n1-standard-2" ...
  Throughput                         3667.000000 Mbits/sec
(ip_type="internal" receiving_machine_type="n1-standard-2" ...
  Throughput                         3564.000000 Mbits/sec
(ip_type="external" receiving_machine_type="n1-standard-2" ...
  Throughput                         3700.000000 Mbits/sec
(ip_type="internal" receiving_machine_type="n1-standard-2" ...
...
------------------------------------------
Name   UID     Status     Failed Substatus
------------------------------------------
iperf  iperf0  SUCCEEDED
------------------------------------------
Success rate: 100.00% (1/1)
...
By default, config files must reside under the
PerfKitBenchmarker/perfkitbenchmarker/configs/ directory.
You can also specify the full path to the config file, as instructed earlier.
./pkb.py --benchmark_config_file=/path/to/config/file.yml --benchmarks=iperf
PKB defines curated collections of benchmark tests called benchmark sets.
These sets are defined in the perfkitbenchmarker/benchmark_sets.py
file.
Sets include:
- standard_set: commonly agreed upon set of cloud performance benchmarks.
- google_set: slightly longer collection of benchmarks than
standard_set. Includes
tensorflowbenchmarks. - kubernetes_set: collection of tests intended to run on Kubernetes clusters. Requires specialized setup at this time.
- cloudsuite_set: collection of cloudsuite_XXX benchmarks.
Other sets are defined as well.
You can also run multiple benchmarks by using a comma separated list with the
--benchmarks flag.
By default PKB will output results to the terminal and save logs to the
directory /tmp/perfkitbenchmarker/runs/.
A recommended practice is to push your result data to BigQuery, a serverless, highly-scalable, cost-effective data warehouse. You can then use BigQuery to review your test results over time, and create data visualizations.
To quickly experiment with BigQuery, load sample test data.
-
Initialize an empty dataset where result tables and views can be created, secured and shared.
For this lab, use the BigQuery command-line tool
bqin Cloud Shell.Create a dataset for samples.
bq mk samples_martOutput (do not copy)
Dataset '[PROJECT-ID]:samples_mart' successfully created.You can also create datasets using the BigQuery UI in the Cloud Console.
Note: For this lab, use the BigQuery command-line tool
bqin Cloud Shell. -
Load the
samples_martdataset from a file.export PROJECT=$(gcloud info --format='value(config.project)') bq load --project_id=$PROJECT \ --source_format=NEWLINE_DELIMITED_JSON \ samples_mart.results \ ./tutorials/beginner_walkthrough/data/samples_mart/sample_results.json \ ./tutorials/beginner_walkthrough/data/samples_mart/results_table_schema.jsonOutput (do not copy)
Upload complete.
Waiting on bqjob_xxxx ... (1s) Current status: DONE
Note: this data was prepared by the networking research team at the AT&T Center for Virtualization at Southern Methodist University.
You can see your data using the command-line bq tool, again, in Cloud Shell.
bq query 'SELECT * FROM samples_mart.results LIMIT 200'
You can also see your data using the BigQuery UI.
Use the Query editor to Run a simple query that shows your results.
SELECT * FROM samples_mart.results LIMIT 200;
When you're ready to run benchmarks, or sets, and push your results to BigQuery, you need to use special command-line flags.
-
Create an empty dataset where result tables and views can be created, secured and shared.
Use the BigQuery command-line tool
bqin Cloud Shell.bq mk example_datasetOutput (do not copy)
Dataset '[PROJECT-ID]:example_dataset' successfully created. -
Run a PKB experiment with BigQuery arguments - push the results to BigQuery.
When you run PKB, supply the BigQuery-specific arguments to send your result data directly to BigQuery tables.
--bq_project: your Google Cloud PROJECT-ID that owns the dataset and tables.--bigquery_table: a fully qualified table name, including the dataset. The first time you run experiments, PKB will create the table if it does not yet exist.
Expected duration: 13-14min.
cd $HOME/PerfKitBenchmarker
export PROJECT=$(gcloud info --format='value(config.project)')
./pkb.py --benchmarks=iperf \
    --bq_project=$PROJECT \
    --bigquery_table=example_dataset.network_tests
Output (do not copy)
-------------------------PerfKitBenchmarker Results Summary------------------------- IPERF: receiving_machine_type="n1-standard-1" receiving_zone="us-central1-a" run_number="0" runtime_in_seconds="60" sending_machine_type="n1-standard-1" sending_thread_count="1" sending_zone="us-central1-a" Throughput 1881.000000 Mbits/sec (ip_type="external") Throughput 1970.000000 Mbits/sec (ip_type="internal") Throughput 1970.000000 Mbits/sec (ip_type="external") Throughput 1967.000000 Mbits/sec (ip_type="internal") End to End Runtime 777.230134 seconds ... ------------------------------------------ Name UID Status Failed Substatus ------------------------------------------ iperf iperf0 SUCCEEDED ------------------------------------------ Success rate: 100.00% (1/1) ... -
Query
example_dataset.network_teststo view the test results.bq query 'SELECT product_name, test, metric, value FROM example_dataset.network_tests'Output (do not copy)
...
+--------------------+-------+--------------------+-------------------+
|    product_name    | test  |       metric       |       value       |
+--------------------+-------+--------------------+-------------------+
| PerfKitBenchmarker | iperf | End to End Runtime | 643.0881481170654 |
| PerfKitBenchmarker | iperf | proccpu_mapping    |               0.0 |
| PerfKitBenchmarker | iperf | proccpu_mapping    |               0.0 |
| PerfKitBenchmarker | iperf | proccpu            |               0.0 |
| PerfKitBenchmarker | iperf | proccpu            |               0.0 |
| PerfKitBenchmarker | iperf | lscpu              |               0.0 |
| PerfKitBenchmarker | iperf | lscpu              |               0.0 |
| PerfKitBenchmarker | iperf | Throughput         |            1968.0 |
| PerfKitBenchmarker | iperf | Throughput         |            1972.0 |
| PerfKitBenchmarker | iperf | Throughput         |            1975.0 |
| PerfKitBenchmarker | iperf | Throughput         |            1970.0 |
+--------------------+-------+--------------------+-------------------+
You will learn to visualize such data, in the next section.
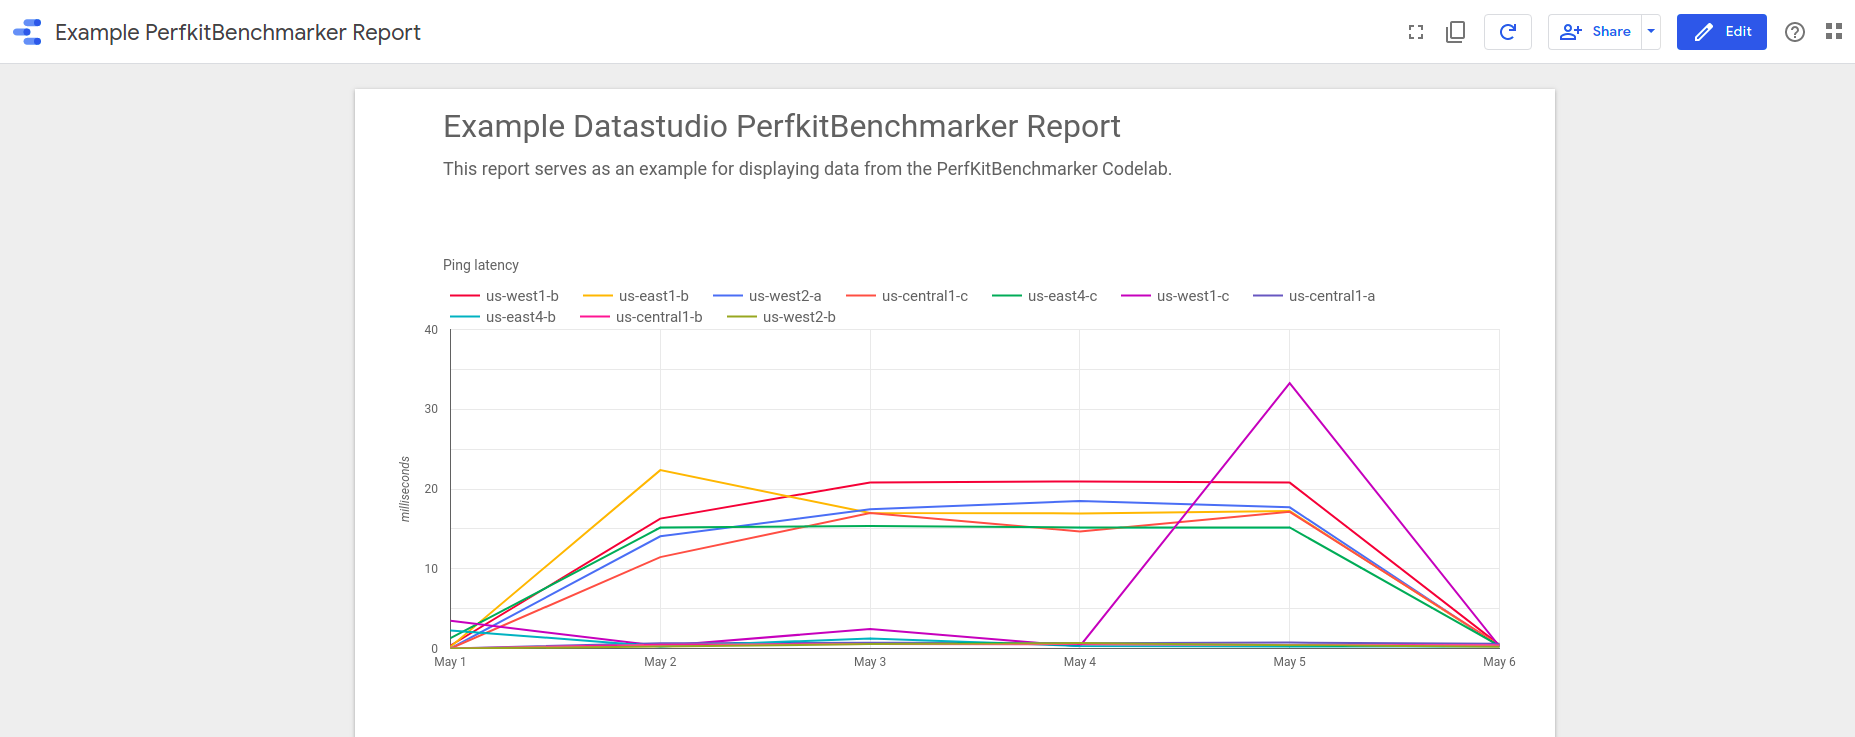
To really impact your business, though, you want to identify insights from your performance projects. You need to look through many passes of multiple tests over time. You may watch for unexpected spikes, variations over time, or differences from one geography to another.
Visualization tools help you to summarize large sets of result data into understandable charts, and tables.
Data Studio is a Google tool for data visualization. It can dynamically pull and display data from BiqQuery, and many other data sources.
With Data Studio, you can copy an existing sample dashboard, then customize it to fit your requirements. You can also create dashboards from scratch. The BigQuery tables with your PKB results become your data sources.
You can attach your dashboards to your data sources to easily view your performance data and start to identify critical insights. Data Studio maintains a complete version history, similar to history in Google Docs.
First, look at an Example Datastudio Report.
You will clone this report, then add your own data.
First, you need a set of performance data to use in this example.
To demonstrate the capabilities of Data Studio, load a larger collection of demo data.
-
Create an empty dataset where result tables and views can be created, secured and shared.
If you already did this earlier, skip to the next step.
Use the BigQuery command-line tool
bqin Cloud Shell.bq mk example_datasetOutput (do not copy)
Dataset '[PROJECT-ID]:example_dataset' successfully created.If you see the following error, don't worry, you already created the BigQuery dataset.
BigQuery error in mk operation: Dataset 'example_dataset' already exists -
Load data from a json file to the
resultstable inexample_dataset.The --autodetect flag is used to autodetect the table schema. The table need not exist before running the command.
export PROJECT=$(gcloud info --format='value(config.project)')
bq load --project_id=$PROJECT \
    --autodetect \
    --source_format=NEWLINE_DELIMITED_JSON \
    example_dataset.results \
    ./tutorials/beginner_walkthrough/data/bq_pkb_sample.json
Output (do not copy)
Upload complete.
Waiting on bqjob_xxxx ... (1s) Current status: DONE
Dataset views make reading and writing SQL queries simpler.
-
Create a file with the SQL command for defining the view.
cat << EOF > ./results_view.sql SELECT value, unit, metric, test, TIMESTAMP_MICROS(CAST(timestamp * 1000000 AS int64)) AS thedate, REGEXP_EXTRACT(labels, r"\|vm_1_cloud:(.*?)\|") AS vm_1_cloud, REGEXP_EXTRACT(labels, r"\|vm_2_cloud:(.*?)\|") AS vm_2_cloud, REGEXP_EXTRACT(labels, r"\|sending_zone:(.*?)\|") AS sending_zone, REGEXP_EXTRACT(labels, r"\|receiving_zone:(.*?)\|") AS receiving_zone, REGEXP_EXTRACT(labels, r"\|sending_zone:(.*?-.*?)-.*?\|") AS sending_region, REGEXP_EXTRACT(labels, r"\|receiving_zone:(.*?-.*?)-.*?\|") AS receiving_region, REGEXP_EXTRACT(labels, r"\|vm_1_machine_type:(.*?)\|") AS machine_type, REGEXP_EXTRACT(labels, r"\|ip_type:(.*?)\|") AS ip_type FROM \`$PROJECT.example_dataset.results\` EOF -
Create a new dataset view using the SQL file.
export PROJECT=$(gcloud info --format='value(config.project)')
bq mk \
--use_legacy_sql=false \
--description '"This is my view"' \
--view "$(cat ./results_view.sql)" \
example_dataset.results_view
Output (do not copy)
View '[project_id]:example_dataset.results_view' successfully created.This dataset view
example_dataset.results_viewwill be used as a data source in the Data Studio Report.
-
Clone the Example Datastudio Report.
Load the report, and click the Make a Copy of This Report button, near the top-right.
Note: If you see the Welcome to Google Data Studio welcome form, click GET STARTED.
- Then, acknowledge terms, and click ACCEPT.
- Finally, choose No, thanks, and click DONE.
-
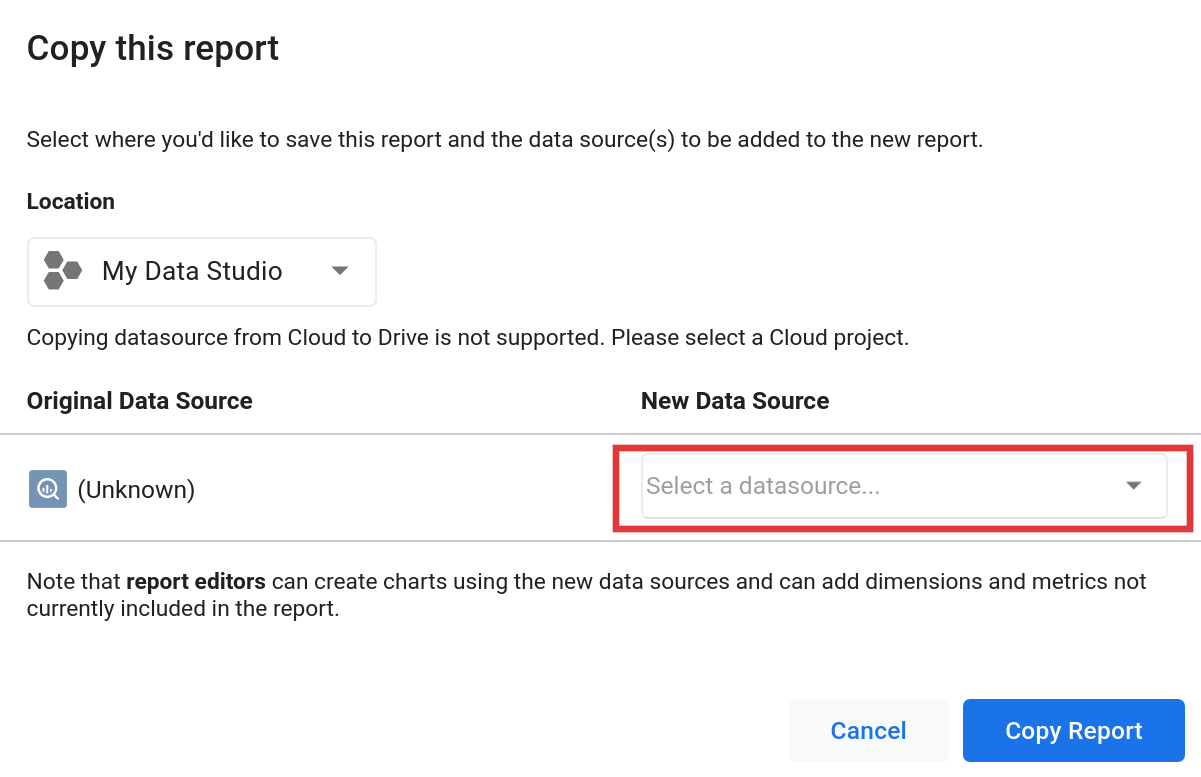
Click the Make a Copy of This Report button, near the top-right.
Create a new Data Source. Click Select a datasource...
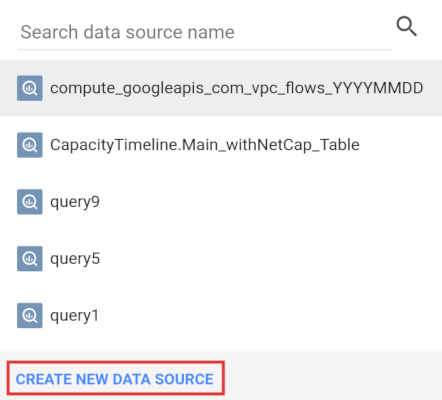
-
Click CREATE NEW DATA SOURCE.
-
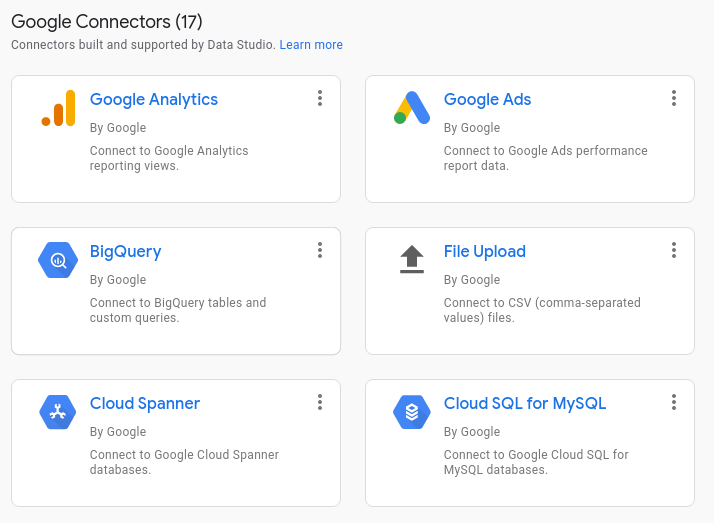
Click BigQuery.
Note: If you see the BigQuery Authorization screen, click AUTHORIZE.
- Click Allow to authorize Data Studio to access your BigQuery data.
-
Select the
results_viewtable.- Click your project under Project.
- Click
example_datasetunder Dataset. You may need to select the appropriate project. - Click
results_viewunder Table.
-
Click the CONNECT button on the top-right, to connect the datasource.
-
Click the
Add to Reportbutton on the top-right.You have created a new data source!
-
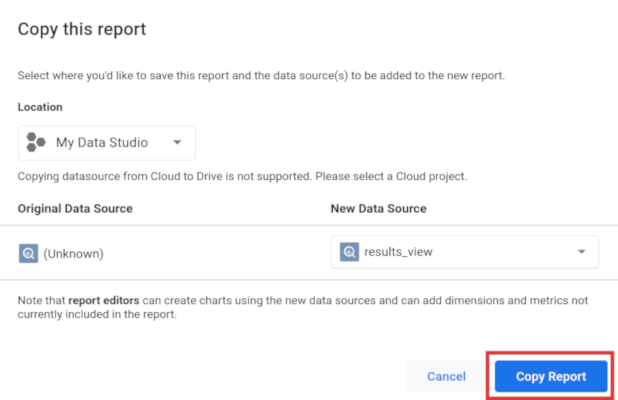
Click the Copy Report button, to complete the copy.
Note: You may be asked to allow Data Studio access to Drive to save your reports. Click Allow.
Your report copy looks just like the example, except it uses your data from BigQuery, through your Data Source.
-
Explore the report options. Change layout, or theme options.
Try adding new charts, using the new data source. Data Studio offers different chart types and options to visualize many different metrics, related to performance benchmarks.
Click View. Click Edit to edit again.
Enjoy.
Note that the following resources may have been created, that you may wish to remove.
- The
samples_martdataset in BigQuery - The
resultstable in thesamples_martdataset - The
example_datasetdataset in BigQuery - The
network_teststable in theexample_datasetdataset - Any reports you copied/created in Data Studio
You have completed the Cloud Network Benchmarking with PerfKitBenchmarker lab!
You installed PerfKit Benchmarker, and ran benchmark tests in the cloud.
You learned about PKB command-line flags, and a few different network benchmarks.
You learned how to build an end-to-end workflow for running benchmarks, gathering data, and visualizing performance trends.
- Watch Performance Benchmarking on Google Cloud Platform with tools, best practices, and methodologies from the PerfKitBenchmarker team.
- Check out the blog post: Performance art: Making cloud network performance benchmarking faster and easier
- Read about more details in the Measuring Cloud Network Performance with PerfKit Benchmarker white paper
- Follow the PKB repo.
Note: the original version of this lab was prepared by the networking research team at the AT&T Center for Virtualization at Southern Methodist University.
