The Apache Cassandra mixin is a set of configurable Grafana dashboards and alerts.
The Apache Cassandra mixin contains the following dashboards:
- Apache Cassandra overview
- Apache Cassandra nodes
- Apache Cassandra keyspaces
and the following alerts:
- HighReadLatency
- HighWriteLatency
- HighPendingCompactionTasks
- BlockedCompactionTasksFound
- HintsStoredOnNode
- UnavailableWriteRequestsFound
- HighCpuUsage
- HighMemoryUsage
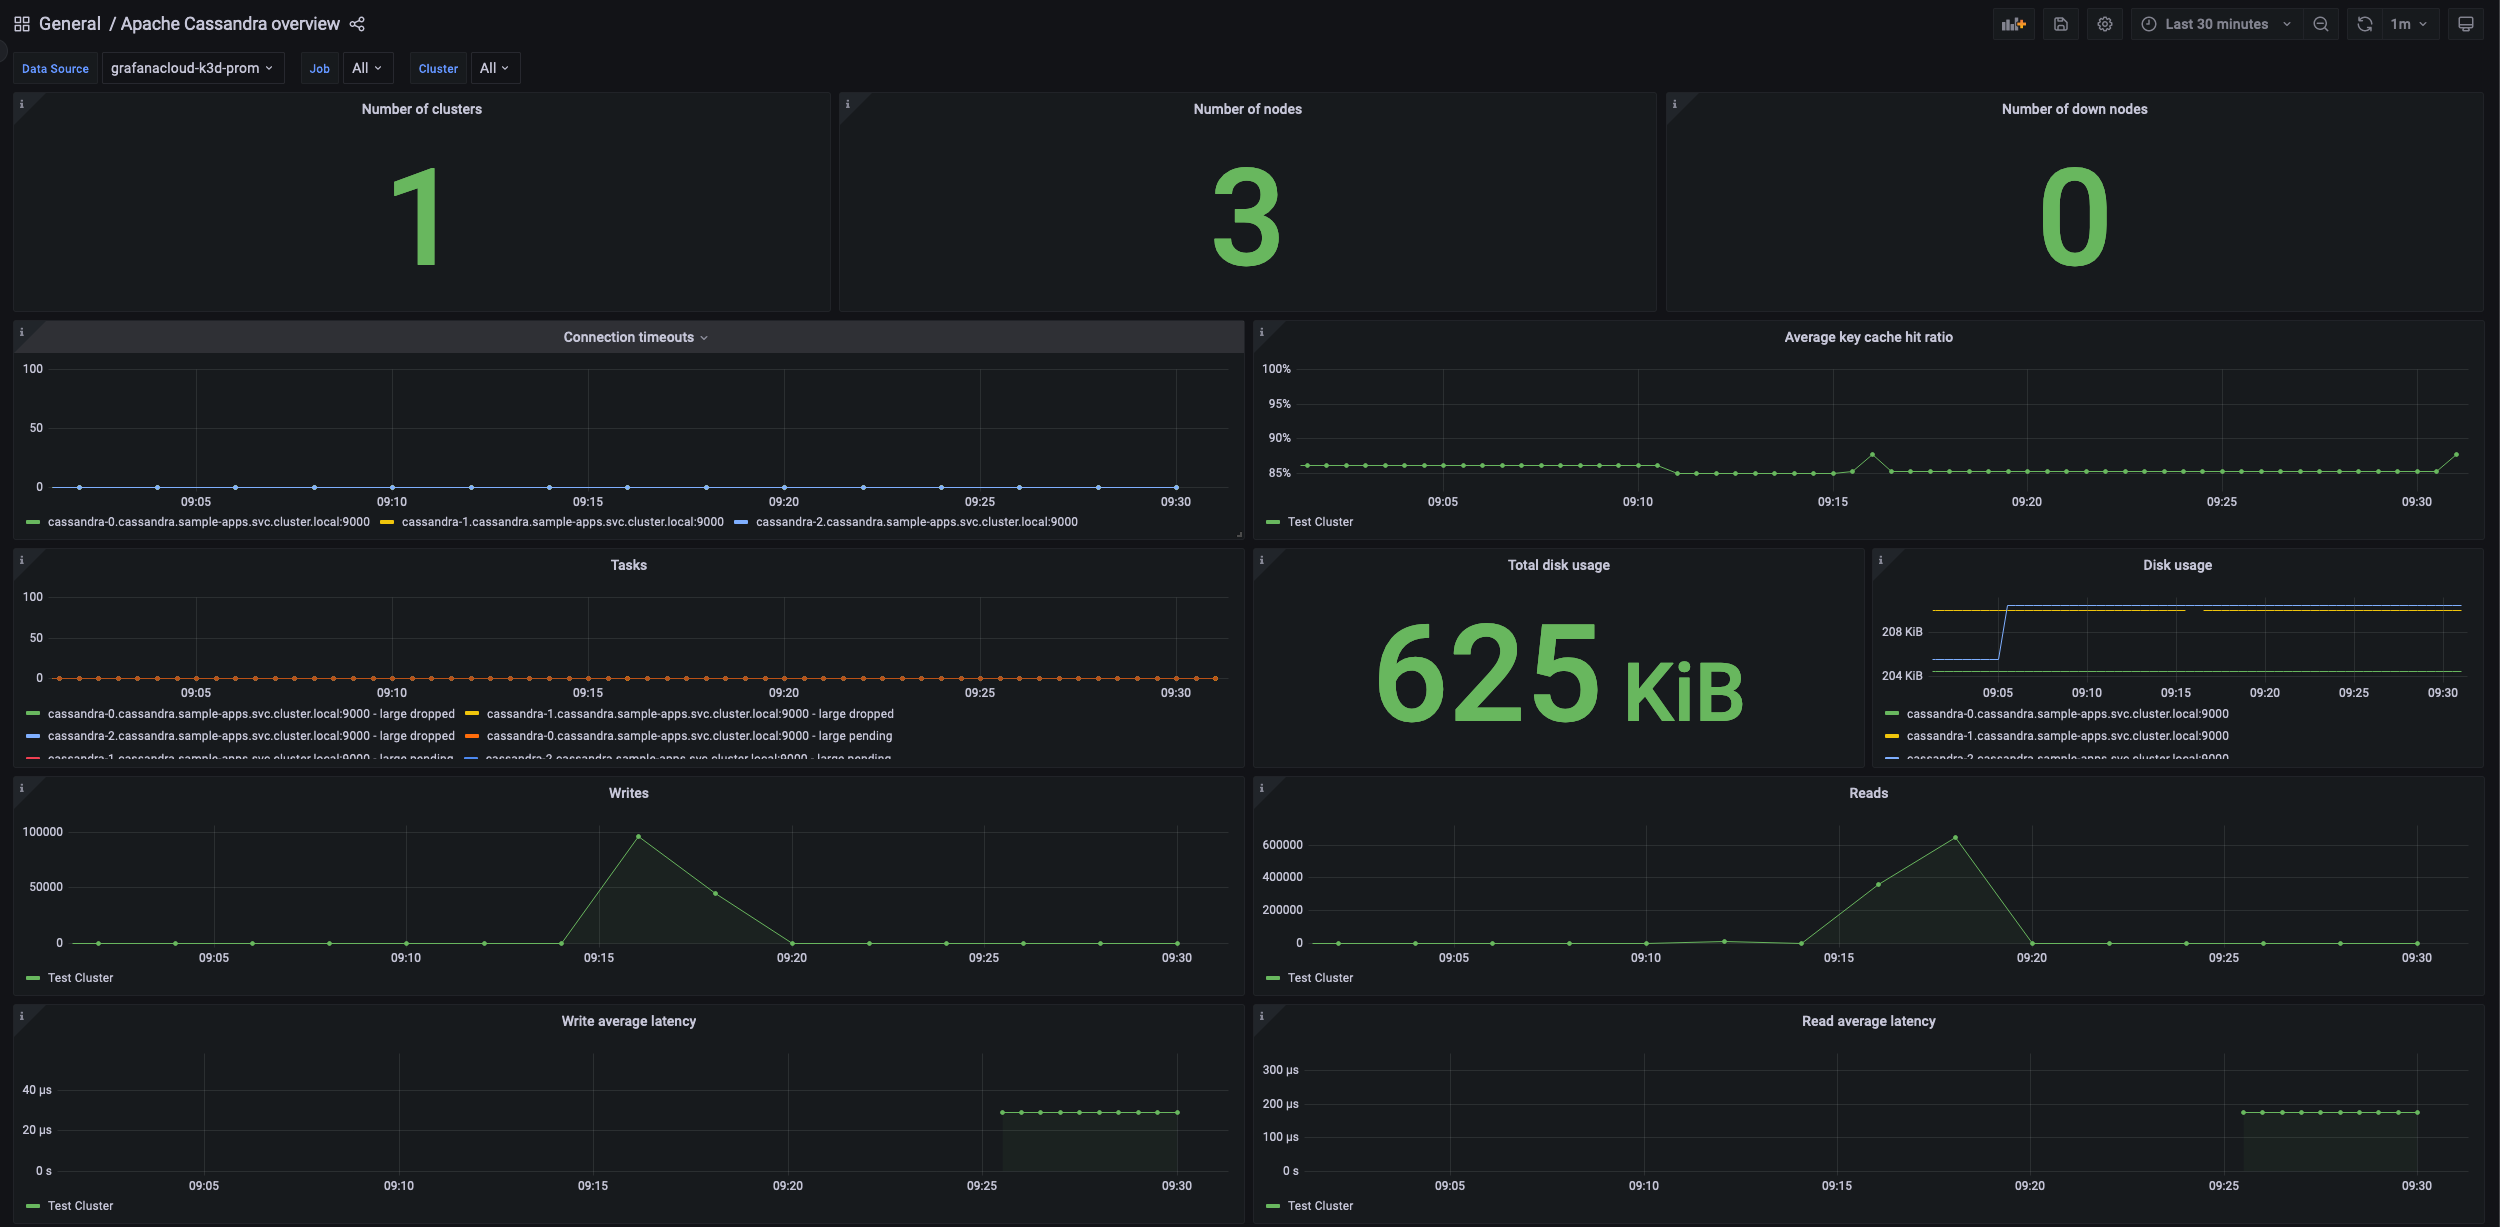
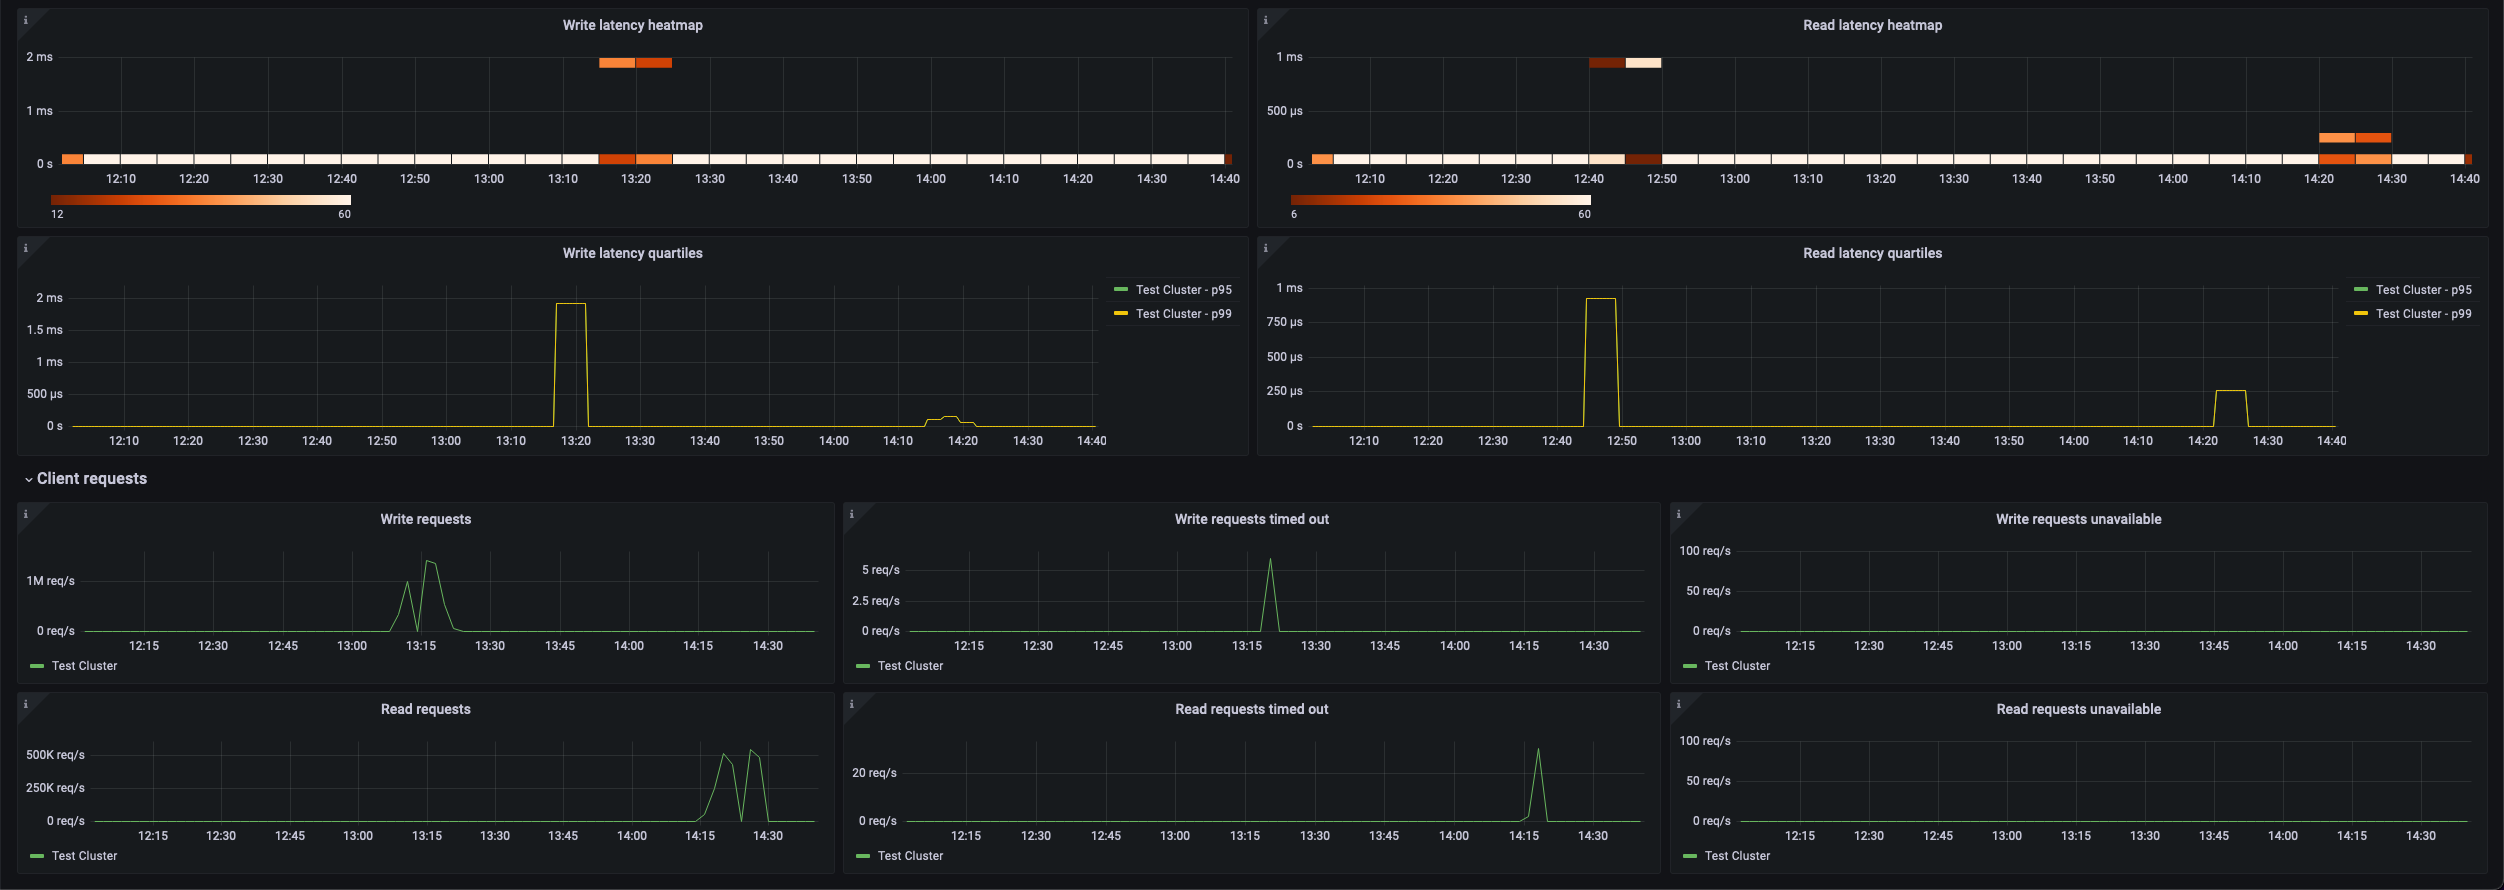
The Apache Cassandra overview dashboard provides details on number of clusters, nodes and down nodes per cluster, timeouts, disk usage, and read/write requests for a Cassandra cluster.
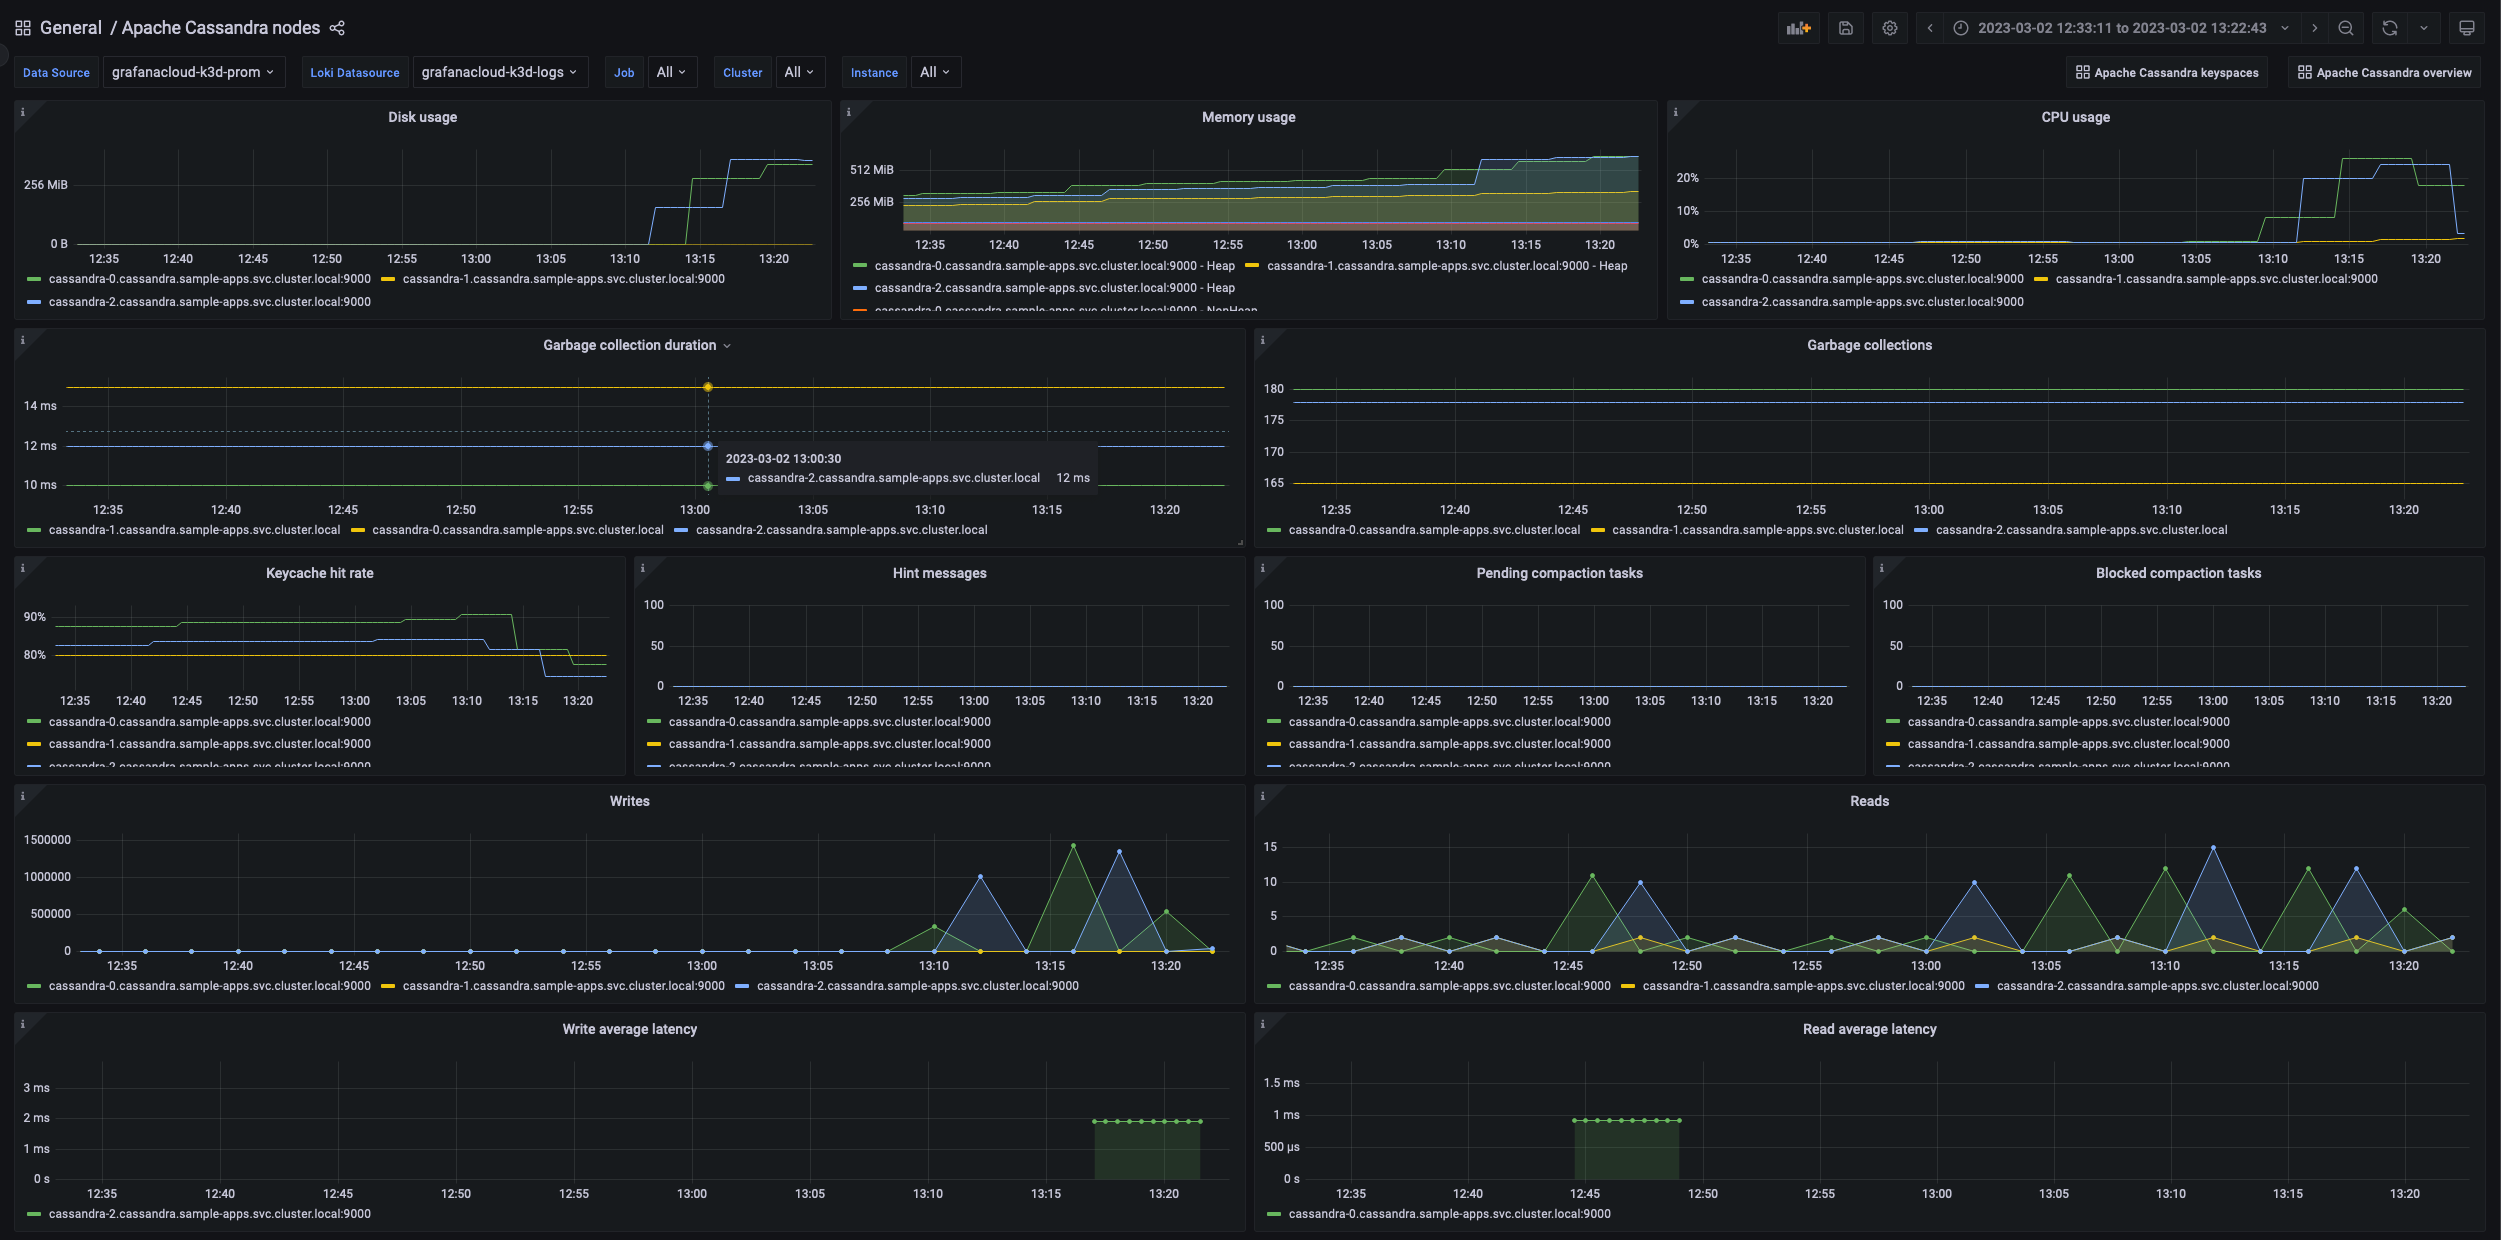
The Apache Cassandra nodes dashboard provides details on disk/memory/cpu usage, garbage collections, number of pending/blocked compaction tasks, number and latency of reads/writes, and logs for a specific node in the Cassandra cluster. To get Cassandra system logs, Promtail and Loki needs to be installed and provisioned for logs with your Grafana instance. The default Cassandra system log path is /var/log/cassandra/system.log on Linux.
Cassandra system logs are enabled by default in the config.libsonnet and can be removed by setting enableLokiLogs to false. Then run make again to regenerate the dashboard:
{
  _config+:: {
    enableLokiLogs: false,
  },
}
In order for the selectors to properly work for system logs ingested into your logs datasource, please also include the matching instance, job, and cassandra_cluster labels onto the scrape_configs as to match the labels for ingested metrics.
scrape_configs:
  - job_name: integrations/apache-cassandra
    static_configs:
      - targets: [localhost]
        labels:
          job: integrations/apache-cassandra
          instance: '<your-instance-name>'
          cassandra_cluster: '<your-cassandra-cluster-name>'
__path__: /var/log/cassandra/system.logThe Apache Cassandra keyspaces dashboard provides details on number and latency of Writes/Reads, Disk space used, number of pending compactions, and size of the largest table partition for a selected keyspace.
The configuration for this mixin also supports adding expected rack and datacenter labels. These selectors are not enabled by default but are easy to change by modifying the config.libsonnet.
{
  _config+:: {
    enableDatacenterLabel: true,
    enableRackLabel: true,
  },
}
- HighReadLatency: There is a high level of read latency within the node.
- HighWriteLatency: There is a high level of write latency within the node.
- HighPendingCompactionTasks: Compaction task queue is filling up.
- BlockedCompactionTasksFound: Compaction task queue is full.
- HintsStoredOnNode: Hints have been recently written to this node.
- UnavailableWriteRequestsFound: Unavailable exceptions have been encountered while performing writes in this cluster.
- HighCpuUsage: A node has a CPU usage higher than the configured threshold.
- HighMemoryUsage: A node has a higher memory utilization than the configured threshold.
go install github.com/jsonnet-bundler/jsonnet-bundler/cmd/jb@latest
go install github.com/monitoring-mixins/mixtool/cmd/mixtool@latest
For linting and formatting, you would also need jsonnetfmt installed. If you
have a working Go development environment, it's easiest to run the following:
go install github.com/google/go-jsonnet/cmd/jsonnetfmt@latestThe files in dashboards_out need to be imported
into your Grafana server. The exact details will be depending on your environment.
prometheus_alerts.yaml needs to be imported into Prometheus.
Edit config.libsonnet if required and then build JSON dashboard files for Grafana:
makeFor more advanced uses of mixins, see https://github.com/monitoring-mixins/docs.


