This project monitors the estimated arrival/departure time of buses at stops. It then compares it with the actual arrival/departure time and generates pretty graphs to validate the estimation.
These scripts work with any bus system based on the Availtec.com platform, for example: Birmingham, AL's.
This projects requires python3 with the following modules installed:
- requests
- sqlite3
- matplotlib
This project consists of two scripts. The first is the capturer
script. This takes a list of stop ids and begins to query Availtec's
API for the estimates times. This information is then saved to a local
database. You will need to run the capturer script over a period of
time before you can begin to create graphs. The second is the
grapher. This reads captured data from the database and plots it,
generating PDF reports.
You will need to edit the config.py and configure both the URL and
the stops list. Each stop needs to have:
id: This is the stop's id in Availtec's system. You can go to the agency's Real Time system and search for the stops by name to get an id. Every bus / route that stops at this stop will be recorded.description: A human readable name for this stop that show up in the reports.direction: Since a bus may pass through the same stop going inbound or outbound, we need to know the desired direction so we can match the estimates. Typically this is eitherIfor inbound orOfor outbound, but may also beLif the bus does a one way loop.hit_line: This is a line segment that should cross the stop perpendicular to the direction of travel of the bus. This is used to determine when a bus has passed through a stop. Make sure this line segment only intersects with the bus route at a single location: the desired stop. This should be specified as a tuple of two points:((point0_latitude, point0_longitude), (point1_latitude, point1_longitude))
You can configure as many stops as desired, however, if you have too many, you may reach limits in the number of requests allowed to Availtec's API, which may cause those requests to fail.
You can start capturing data by running:
python3 capturer
You can leave this running for as long as you want. Data will be
stored in a local database named: availtec-times.db. You can stop
this script, make changes to the config, and restart it at any
time. New data will just be appended to the database.
It is not recommended to run multiple capturers instances at the same time!
You will need to wait until the capturer has collected enough
database before you can run it. You can run the grapher while the
capturer is still capturing data. To plot all the data for today,
you can run:
python3 grapher
This will generate a file called output.pdf. If you are capturing
many stops and routes, this pdf may be VERY large. The grapher comes
with several flags to customize the reports:
--file=FILE: Output the report to a user specified filename:python3 grapher --file=Route44_20190730.pdf--date=2019-07-28: By default, the report is generated for today's data. You can specify a specific date by passing tin the date flag:python3 grapher --date=2019-07-28 --file=Route44_2019-07-28.pdf--include-stop=ID: By default, all stops are included. This flags allows you to list the exact stops you want.You can include multiple stops by listing the flag multiple times:python3 grapher --include-stop=2473python3 grapher --include-stop=2473 --include-stop=1944--exclude-stop=ID: Instead of listing each stop you want to include in the report, you can instead have the report include ALL stops except those listed. To include all stops except 2473:You can exclude multiple stops by listing the flag multiple times:python grapher --exclude-stop=2473python grapher --exclude-stop=2473 --exclude-stop=2534--include-route=ID: For each stop we are plotting, only plot these specific routes. This is useful when multiple routes share a single stop. This can be included with the--include-stopor--exclude-stopflags. It can also be specified multiple times to include multiple routes. To include just route 44 from stop 2473:python grapher --include-stop=2473 --include-route=44--exclude-route=ID: Instead of listing each route you want to include, you can instead specify the routes you don't want. It can be combined with the--include-stopor--exclude-stopflags and can be specified multiple times. For example, to show all routes going through stop 2473 EXCEPT 44:python grapher --include-stop=2473 --exclude-route=44
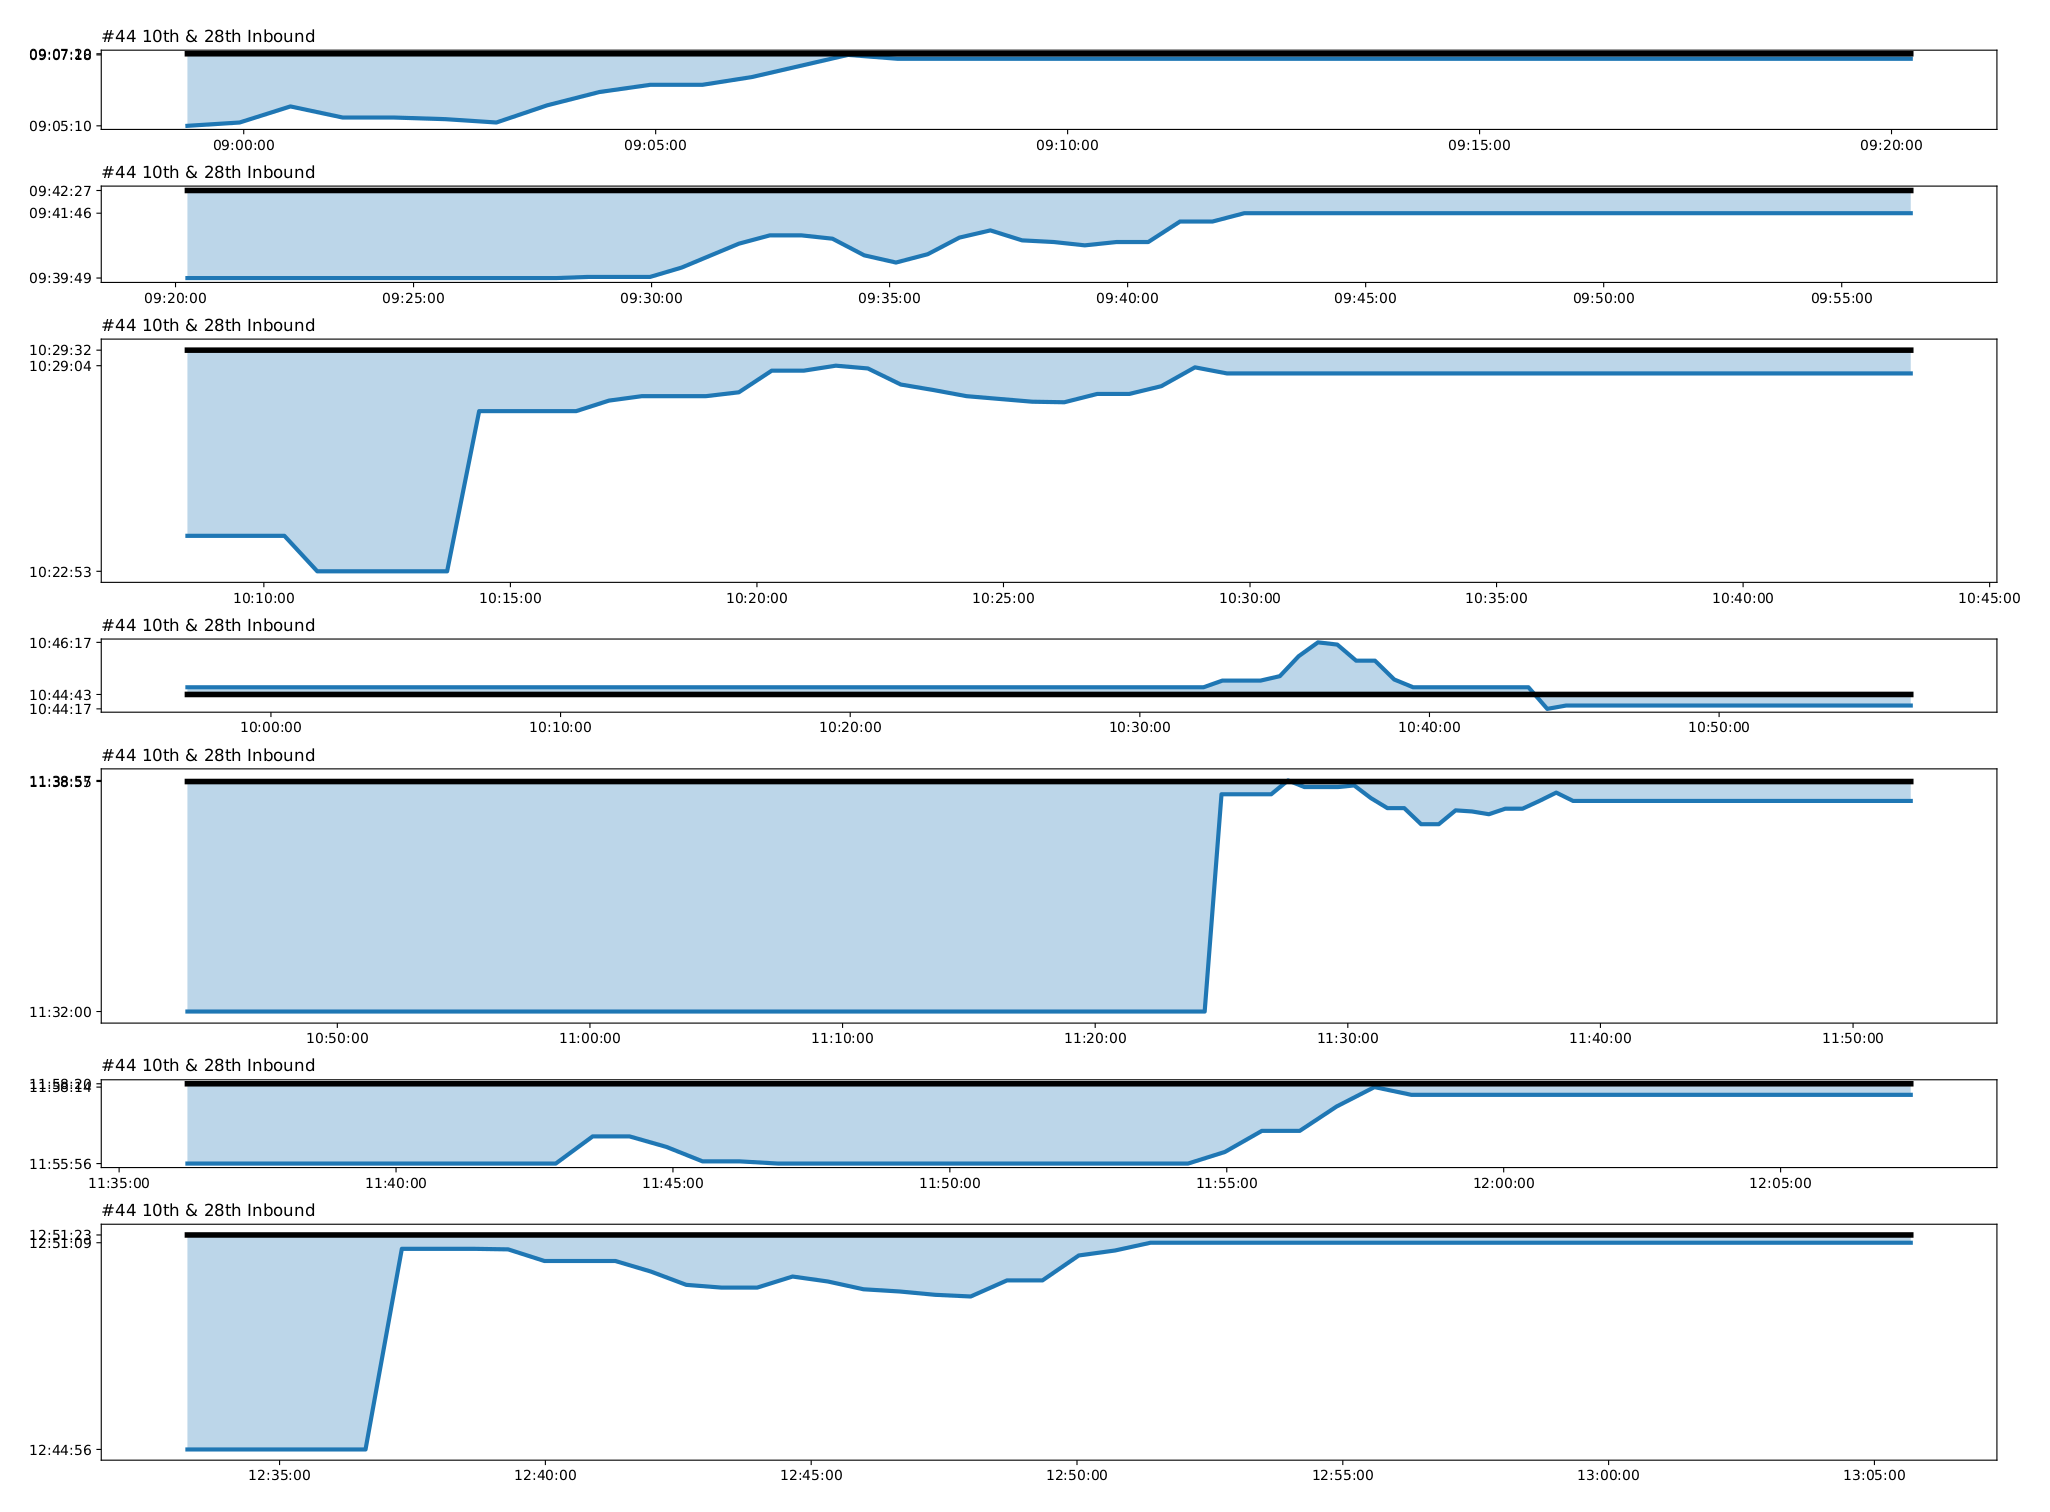
The output shows a separate graph for each stop and bus trip. The x-axis is the time of day that trip was running. The y-axis shows what Availtec predicated the arrival of the bus at the stop would be. The dark black horizontal line shows the actual time the bus arrived.
Filled in blue beneath the black line indicates that Availtec predicted the bus would arrival earlier than it actually did (i.e. said the bus would be here in 5 minutes, but it actually came in 7 minutes). Filled in blue above the black line indicates that Availtec predicted the bus would arrive later than it actually did. Ideally the blue area would be as small as possible and centered exactly on the black line.
Also note that the black line is not a perfect time of when the bus
arrived. It is based upon the bus crossing the hit_line in your
config.py, so it is important to get that accurate. Also, the
location of buses are only updated every 30 seconds, so it may be
around 30 seconds late.
- (c) 2019 Marcus Dillavou [email protected]
- Released under the MIT License
