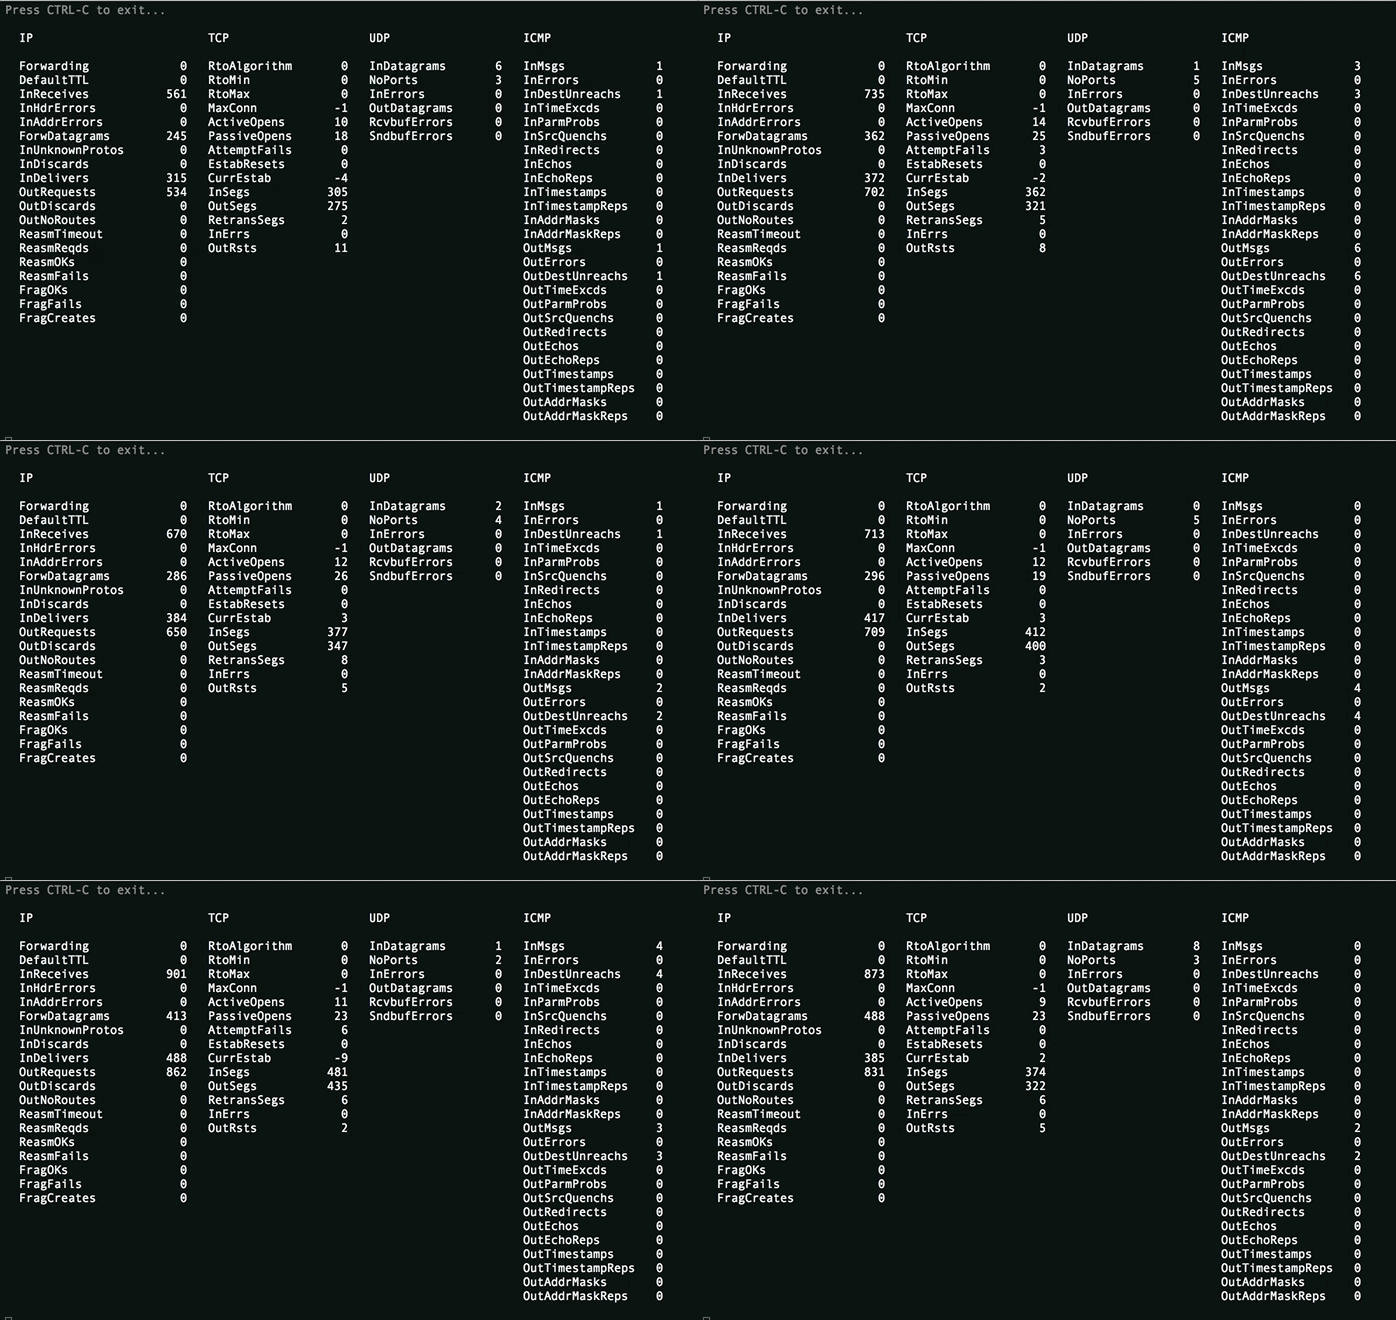
It's a useful utils to simplify Linux network troubleshooting and performance tuning, developed in order to help Carbon Reductor techsupport and automate the whole linux performance tuning process out of box (ok, except the best RSS layout detection with multiple network devices). These utils may be useful for datacenters and internet service providers with heavy network workload (you probably wouldn't see an effect at your desktop computer). It's now in production usage with 300+ deployment and save us a lot of time with hardware and software settings debugging. Inspired by packagecloud's blog post.
You'll need pip.
pip install netutils-linuxAll these top-like utils don't require root priveledges or sudo usage. So you can install and use them as non-priveledged user if you care about security.
pip install --user netutils-linuxBrief explanation about highlighting colors for CPU and device groups: green and red are for NUMA-nodes, blue and yellow for CPU sockets. Screenshots are taken from different hosts with different hardware.
Most useful util in this repo that includes almost all linux network stack performance metrics and allow to monitor interrupts, soft interrupts, network processing statistic for devices and CPUs. Based on following files:
- /proc/interrupts (vectors with small amount of irqs/second are hidden by default)
- /proc/net/softnet_stat - packet distribution and errors/squeeze rate between CPUs.
- /proc/softirqs (only NET_RX and NET_TX values).
- /sys/class/net/<NET_DEVICE>/statistic/<METRIC> files (you can specify units, mbits are default)
There are also separate utils if you want to look at only specific metrics: irqtop, softirq-top, softnet-stat-top, link-rate.
Basic /proc/net/smmp file watcher.
Automatically set smp_affinity_list for IRQ of NIC rx/tx queues that usually work on CPU0 out of the box).
Based on lscpu's output.
It also supports double/quad ladder in case of multiprocessor systems (but you better explicitly specify queue count == core per socket as NIC's driver's param). Example output:
# rss-ladder eth1 0
- distributing interrupts of eth1 (-TxRx-) on socket 0
  - eth1: irq 67 eth1-TxRx-0 -> 0
  - eth1: irq 68 eth1-TxRx-1 -> 1
  - eth1: irq 69 eth1-TxRx-2 -> 2
  - eth1: irq 70 eth1-TxRx-3 -> 3
  - eth1: irq 71 eth1-TxRx-4 -> 8
  - eth1: irq 72 eth1-TxRx-5 -> 9
  - eth1: irq 73 eth1-TxRx-6 -> 10
  - eth1: irq 74 eth1-TxRx-7 -> 11
Enables RPS on all available CPUs of NUMA node local for the NIC for all NIC's rx queues. It may be good for small servers with cheap network cards. You also can explicitely pass --cpus or --cpu-mask. Example output:
# autorps eth0
Using mask 'fc0' for eth0-rx-0.
Sets every CPU scaling governor mode to performance and set max scaling value for min scaling value. So you will be able to use all power of your processor (useful for latency sensible systems).
rx-buffers-increase utils, that finds and sets compromise-value between avoiding dropped/missing pkts and keeping a latency low.
Example output:
# ethtool -g eth1

Ring parameters for eth1:
Pre-set maximums:
RX:           4096
...
Current hardware settings:
RX:           256

# rx-buffers-increase eth1

run: ethtool -G eth1 rx 2048

# rx-buffers-increase eth1

eth1's rx ring buffer already has fine size.

# ethtool -g eth1

Ring parameters for eth1:
Pre-set maximums:
RX:           4096
...
Current hardware settings:
RX:           2048
Much alike lshw but designed for network processing role of server.
# server-info show
cpu:
  info:
    Architecture: x86_64
    BogoMIPS: 6799.9899999999998
    Byte Order: Little Endian
    CPU MHz: 3399.998
    CPU family: 6
    CPU op-mode(s): 32-bit, 64-bit
    CPU(s): 2
    Core(s) per socket: 1
    Hypervisor vendor: KVM
    L1d cache: 32K
    L1i cache: 32K
    L2 cache: 4096K
    Model: 13
    Model name: QEMU Virtual CPU version (cpu64-rhel6)
    NUMA node(s): 1
    NUMA node0 CPU(s): 0,1
    On-line CPU(s) list: 0,1
    Socket(s): 2
    Stepping: 3
    Thread(s) per core: 1
    Vendor ID: GenuineIntel
    Virtualization type: full
  layout:
    '0': '0'
    '1': '1'
disk:
  sr0:
    model: QEMU DVD-ROM
  vda:
    model: null
    size: 64424509440
    type: HDD
memory:
  MemFree: 158932
  MemTotal: 1922096
  SwapFree: 4128764
  SwapTotal: 4128764
net:
  eth1:
    buffers:
      cur: 2048
      max: 4096
    conf:
      ip: 10.144.63.1/24
      vlan: true
    driver:
      driver: e1000
      version: 7.3.21-k8-NAPI
    queues:
      own: []
      rx: []
      rxtx: []
      shared:
      - virtio1, eth0, eth1
      tx: []
      unknown: []
It also can rate hardware and its features in range of 1..10.
# server-info rate
cpu:
  BogoMIPS: 7
  CPU MHz: 7
  CPU(s): 1
  Core(s) per socket: 1
  L3 cache: 1
  Socket(s): 10
  Thread(s) per core: 10
  Vendor ID: 10
 disk:
   sr0:
     size: 1
     type: 2
   vda:
     size: 1
     type: 1
 memory:
   MemTotal: 1
   SwapTotal: 10
 net:
   eth1:
     buffers:
       cur: 5
       max: 10
     driver: 1
     queues: 1
 system:
   Hypervisor vendor: 1
   Virtualization type: 1


