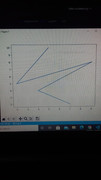
Data Visualization is the presentation of data in graphical format. It helps people understand the significance of data by summarizing and presenting huge amount of data in a simple and easy-to-understand format and helps communicate information clearly and effectively.
First Open the terminal and write pip install matplotlib this will install required package then after make file program.py and take any one program out of three and write it
and run the program.py file . Sit relax and enjoy Data Visualization Process