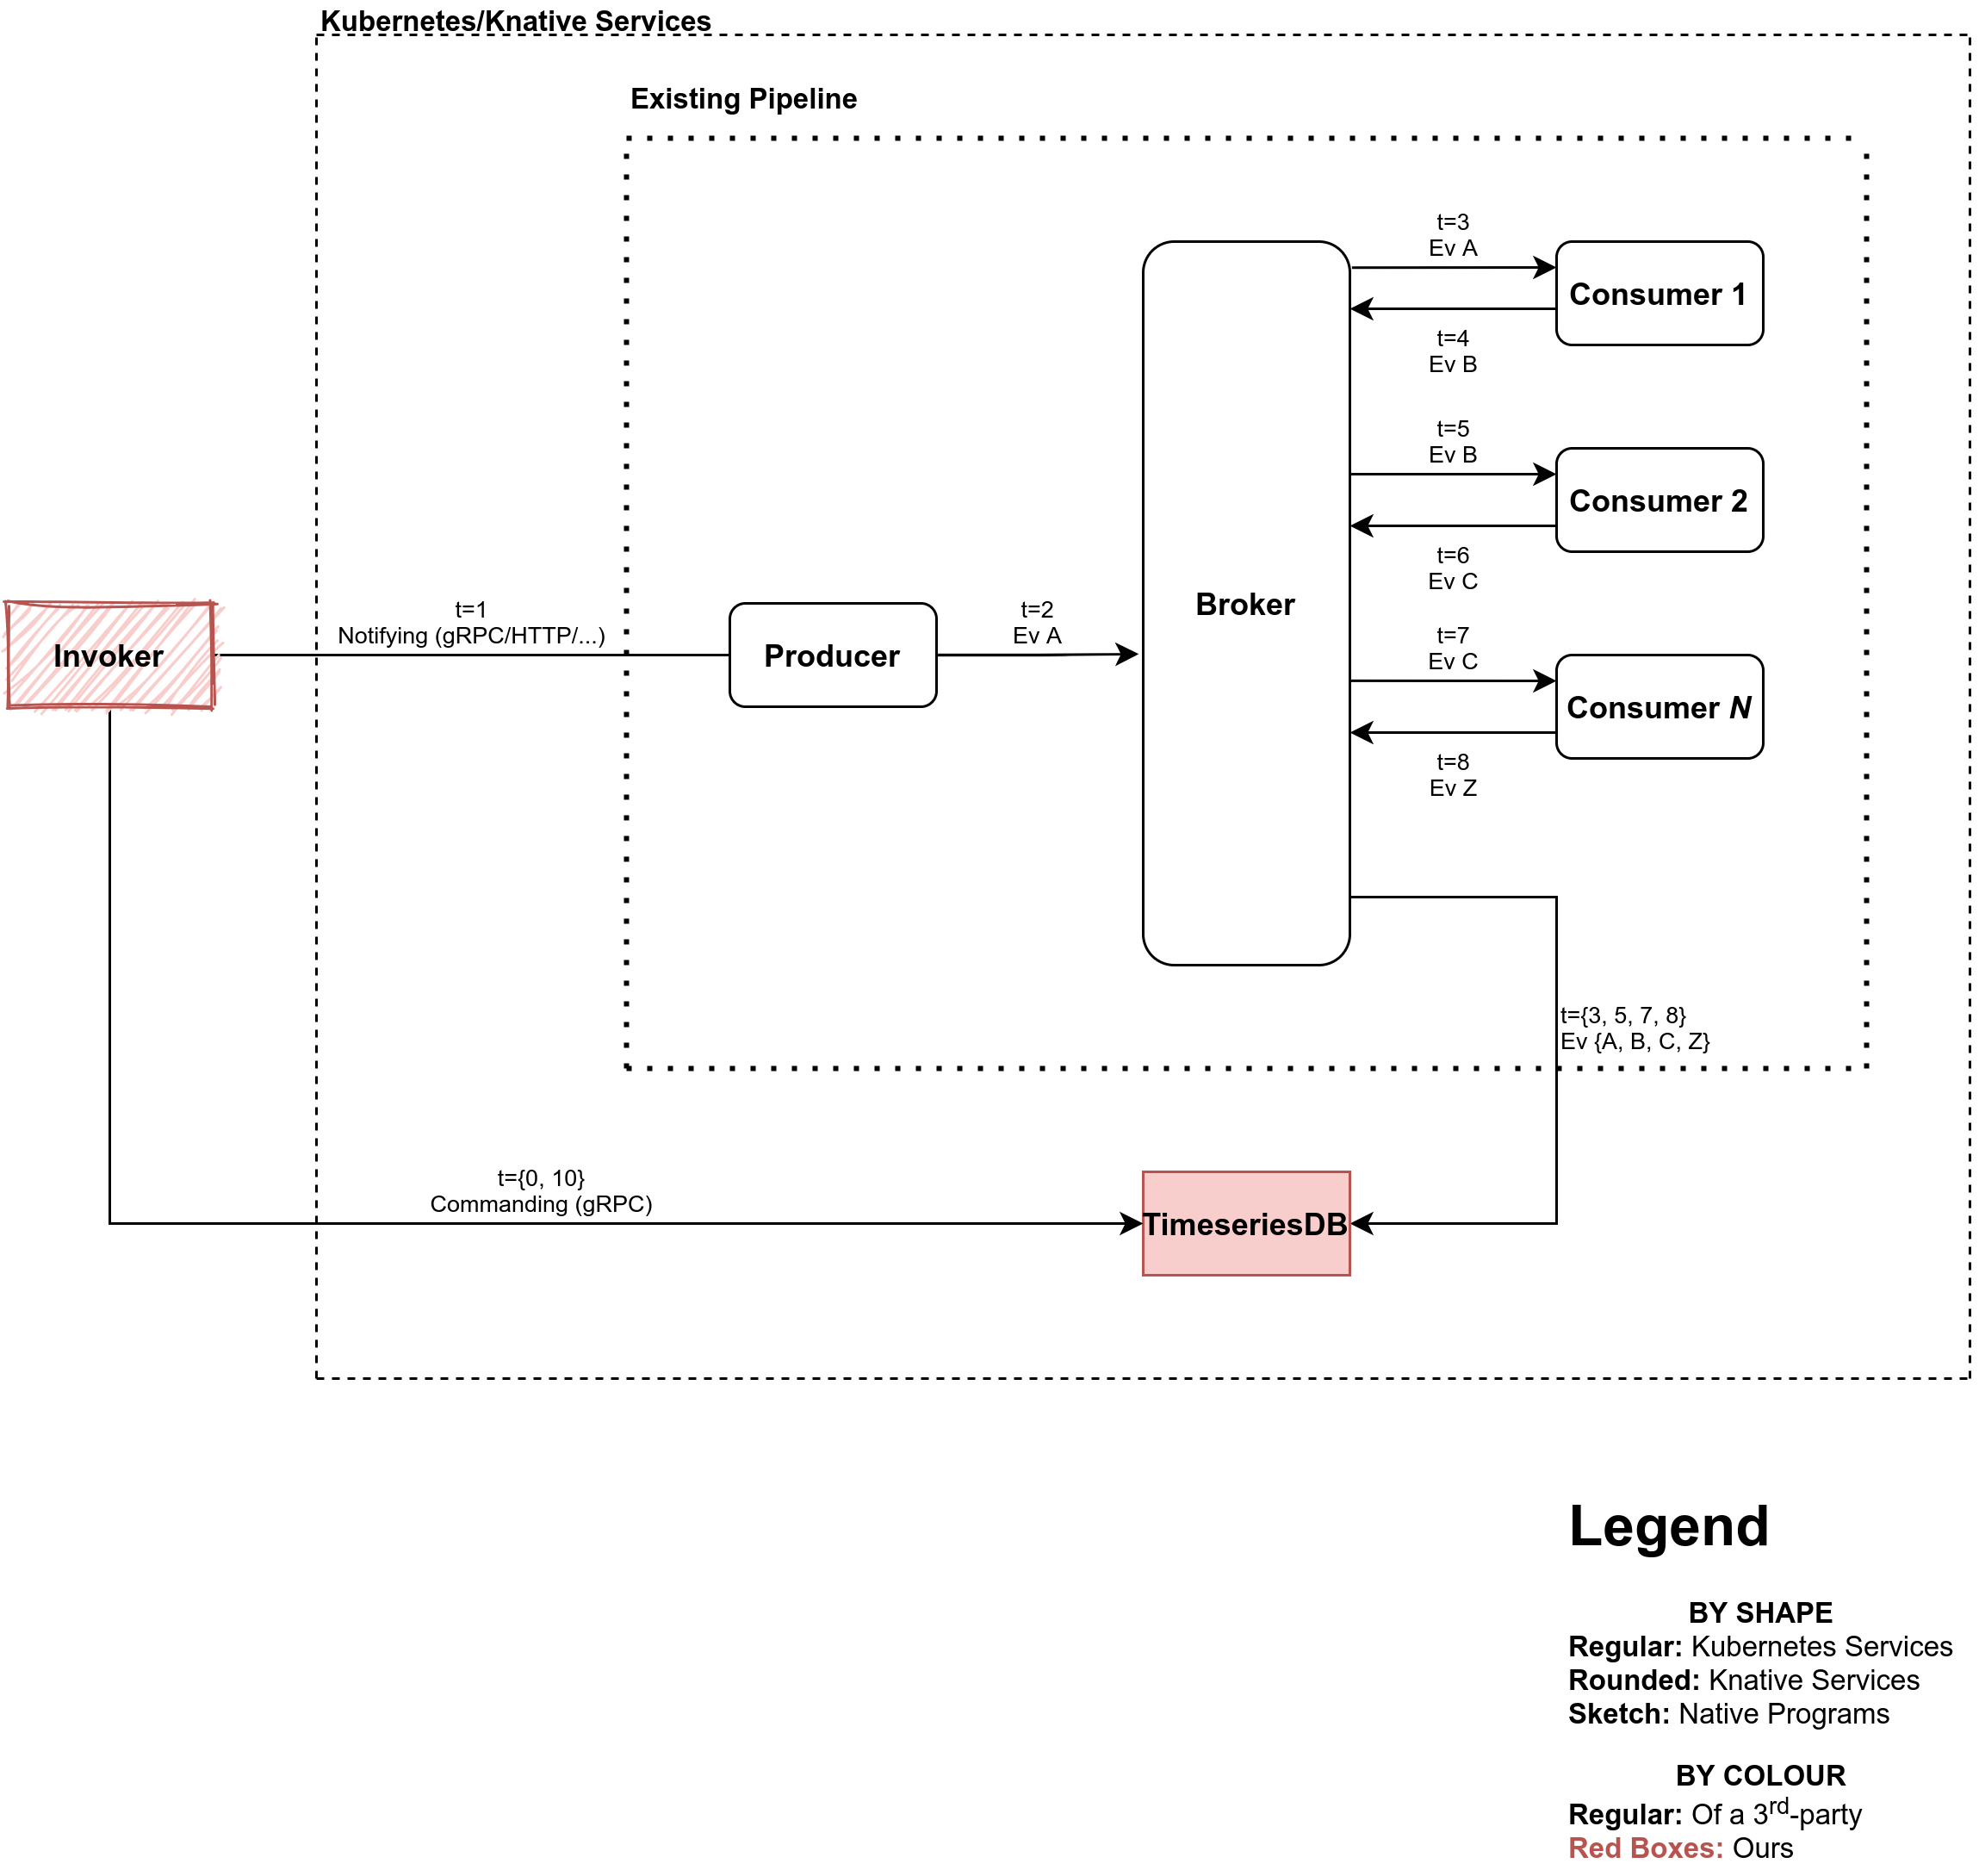
This guide aims to introduce the benchmarking methodology used in vHive and how to run the benchmarks.
The key points are:
- The invoker (examples/invoker) steers load to a collection of serverless benchmarks (also called workflows).
- Benchmarks can comprise a single or a collection of functions calling one another, as well as asynchronous (i.e., eventing) pipelines.
- For synchronous single- and multi-function benchmarks, the invoker measures the latency end to end.
- For asynchronous benchmarks, the invoker requires a workflow with
a TimeseriesDB service.
- For each invocation, the invoker saves a timestamp of the workflow being invoked whereas TimeseriesDB waits for the corresponding completion events and takes a timestamp when the last completion event is received.
- See chained-function-eventing for an example.
- At the end of an experiment, the invoker collects all records of synchronous benchmarks, retrieves the records of asynchronous workflows, adding these records to those for the synchronous benchmarks.
 Diagram of TimeseriesDB in a sample asynchronous pipeline
vHive Metadata is some high-level information for a given asynchronous request that is relied on by the TimeseriesDB. For the purposes of pipeline developers, it can simply be thought as an opaque binary object that is to be passed around in gRPC requests and CloudEvents. vHive Metadata is created at the invoker, and eventually consumed by TimeseriesDB.
In gRPC requests, vHive Metadata is passed as field
bytes vHiveMetadata = 15 of HelloRequest message. In CloudEvents,
vHive metadata is stored in vhivemetadata extension attribute of type
byte array---this is also what TimeseriesDB looks for.
Developers can use utils/benchmarking/eventing/vhivemetadata to read
and create vHive metadata objects.
You can use examples/invoker (the "invoker") to get the end-to-end latencies of your serving and eventing workflows.
On any node, execute the following instructions below at the root of vHive repository using bash:
-
Build the invoker:
(cd examples/invoker; go build github.com/ease-lab/vhive/examples/invoker)- Keep the parenthesis so not to change your working directory.
-
Create your
endpoints.jsonfile. It is created automatically for you if you use examples/deployer (the "deployer"), however eventing workflows are not supported by the deployer so the following guide is presented; you may use it for manually deployed serving workflows too.endpoints.jsonis a serialization of a list of Endpoint structs with the following fields:-
hostnamestring
Hostname of the starting point of a workflow/pipeline. Its difference from a URL is not containing a port number. -
eventingbool
True if the workflow uses Knative Eventing and thus its duration/latency is to be measured using TimeseriesDB. TimeseriesDB must have been deployed and configured correctly! An example can be found in chained-function-eventing μBenchmark -
matchersmap[string]string
Only relevant ifeventingis true,matchersis a mapping of CloudEvent attribute names and values that are sought in completion events to exist.
Example:
[ // This JSON object is an Endpoint: { "hostname": "xxx.namespace.192.168.1.240.sslip.io", "eventing": true, "matchers": { "type": "greeting", "source": "consumer" } }, ... ] -
-
Execute the invoker:
./examples/invoker/invoker
Command-line Arguments:
-rps <integer>
Targeted requests per second (RPS); default1.-time <integer>
Duration of the experiment in seconds; default5.-endpointsFile <path>
Path to the endpoints file; default./endpoints.json.
One may include a Docker-compose manifest which helps with testing deployment locally without Knative. All images deployed with Docker-compose will be on the same network so they can communicate over a shared network, and one can use the names of services as addresses since they are translated automatically by Docker. Make sure to expose a port so that a client can communicate with the initial function in the workload. See the serving Docker-compose for an example.