During this workshop you will deploy a Cloud-Native application, inspect it, change its configuration to use different services and play around with it to get familiar with Kubernetes and Cloud-Native tools that can help you to be more effective in your cloud journey.
During this workshop you will be using GKE (Managed Kubernetes Engine inside Google Cloud) to deploy a complex application composed by multiple services. But none of the applications or tools used are tied in any way to Google infrastructure, meaning that you can run these steps in any other Kubernetes provider, as well as in an On-Prem Kubernetes installation.
The main goal of the workshop is to guide you step by step to work with an application that you don't know but that will run on a real infrastructure (in contrast to run software in your own laptops). Due the time constraints, the workshop is focused on getting things up and running, but it opens the door for a lot of extensions and experimentation, that we encourage. You can find more instructions to try all over the workshop under the sections labelled with Extra. For beginers and for people who wants to finish the workshop on time we recommend to leave the extras for later. We highly encourage you to check the Next Steps section at the end of this document if you are interested in going deeper into how this application is working, how different tools are being used under the hood and other possible tools that can be integrated with this application.
This workshop is divided into the following sections:
- Creating accounts and Clusters to run our applications
- Setting up the Clusters and installing Knative
- Deploying Version 1 of your Cloud-Native application
- Deploying Version 2 of your Cloud-Native application, which uses CloudEvents, Knative Eventing and Camunda Cloud for visualization
- Deploying Version 3 of your Cloud-Native application, which uses all of the above but with a focus on orchestration
- Next Steps
During this workshop you will be using a Kubernetes Cluster and a Camunda Cloud Zeebe Cluster for Microservices orchestration. You need to setup these accounts and create these clusters early on, so they are ready for you to work for the reminder of the workshop.
Important requisites
- You need a Gmail account to be able to do the workshop. You will not be using your account for GCP, but you need the account to access a free GCP account for QCon.
- You need Google Chrome installed in your laptop, we recommend Google Chrome, as this workshop has been tested with it, and it also provides Incognito Mode which is needed for the workshop.
- Download this ZIP file with resources and Unzip somewhere that you can find it again (like your Desktop):
Login to Google Cloud by clicking into this link (if you are a QCon Plus attendee, we will provide you with one, if not you can find other Kubernetes providers free credits list)
Creating a Kubernetes Cluster (Click to Expand)
We recommend to use an Incognito Window in Chrome (File -> New Incognito Window) to run the following steps, as with that you will avoid having issues with your personal Google Account
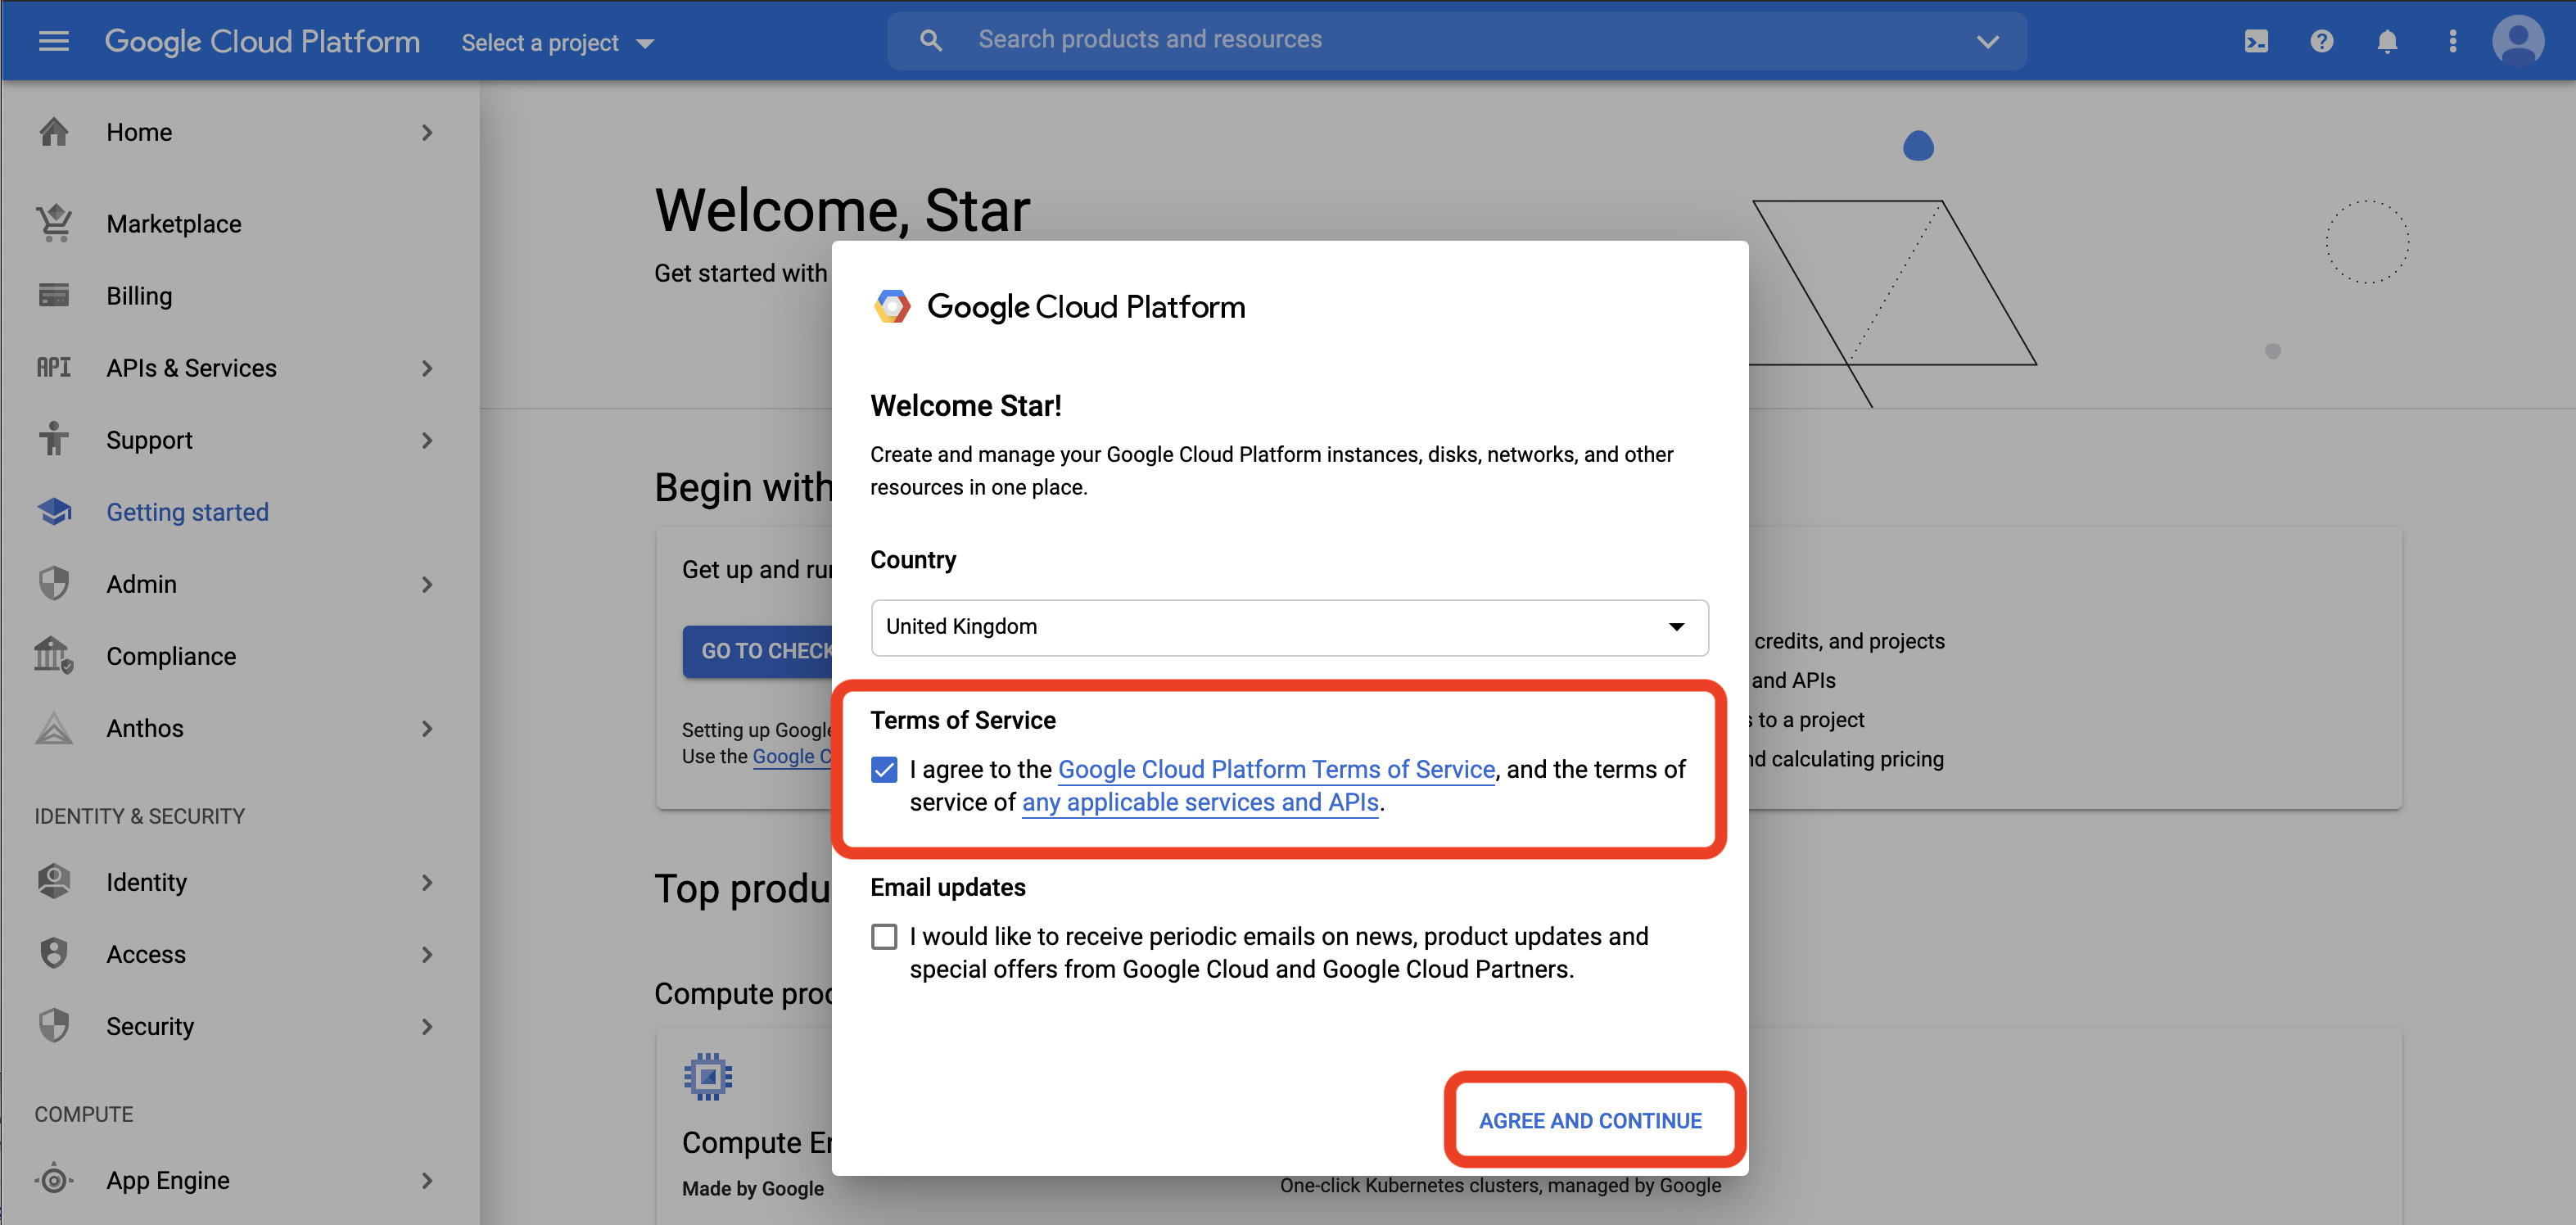
Once you are logged in, you will be asked to accept the terms and continue:
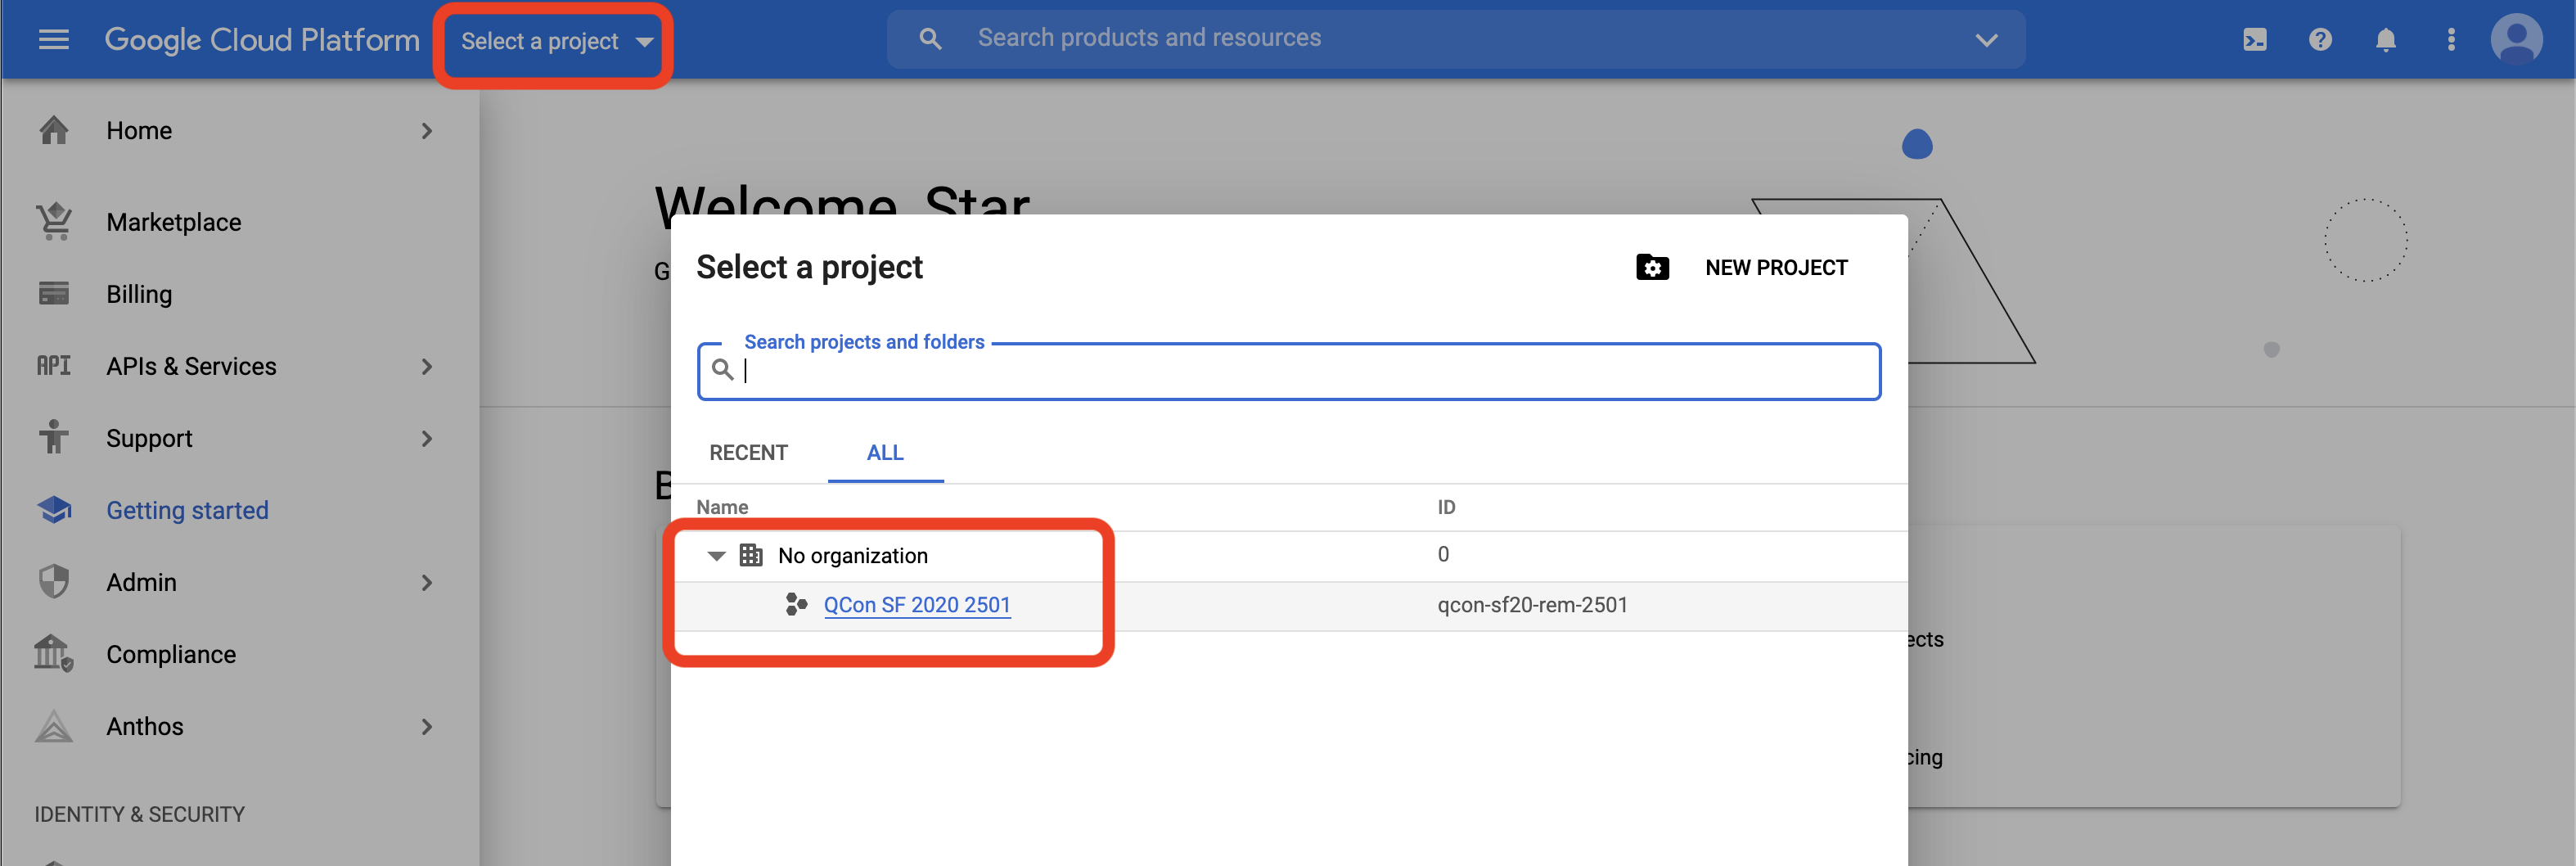
Once the terms are accepted, it is extremely important that you select the correct project to work on. On the top bar, there is a project dropdown that opens the project list. You need to click into the QCon SF 2020 ... project to select it.
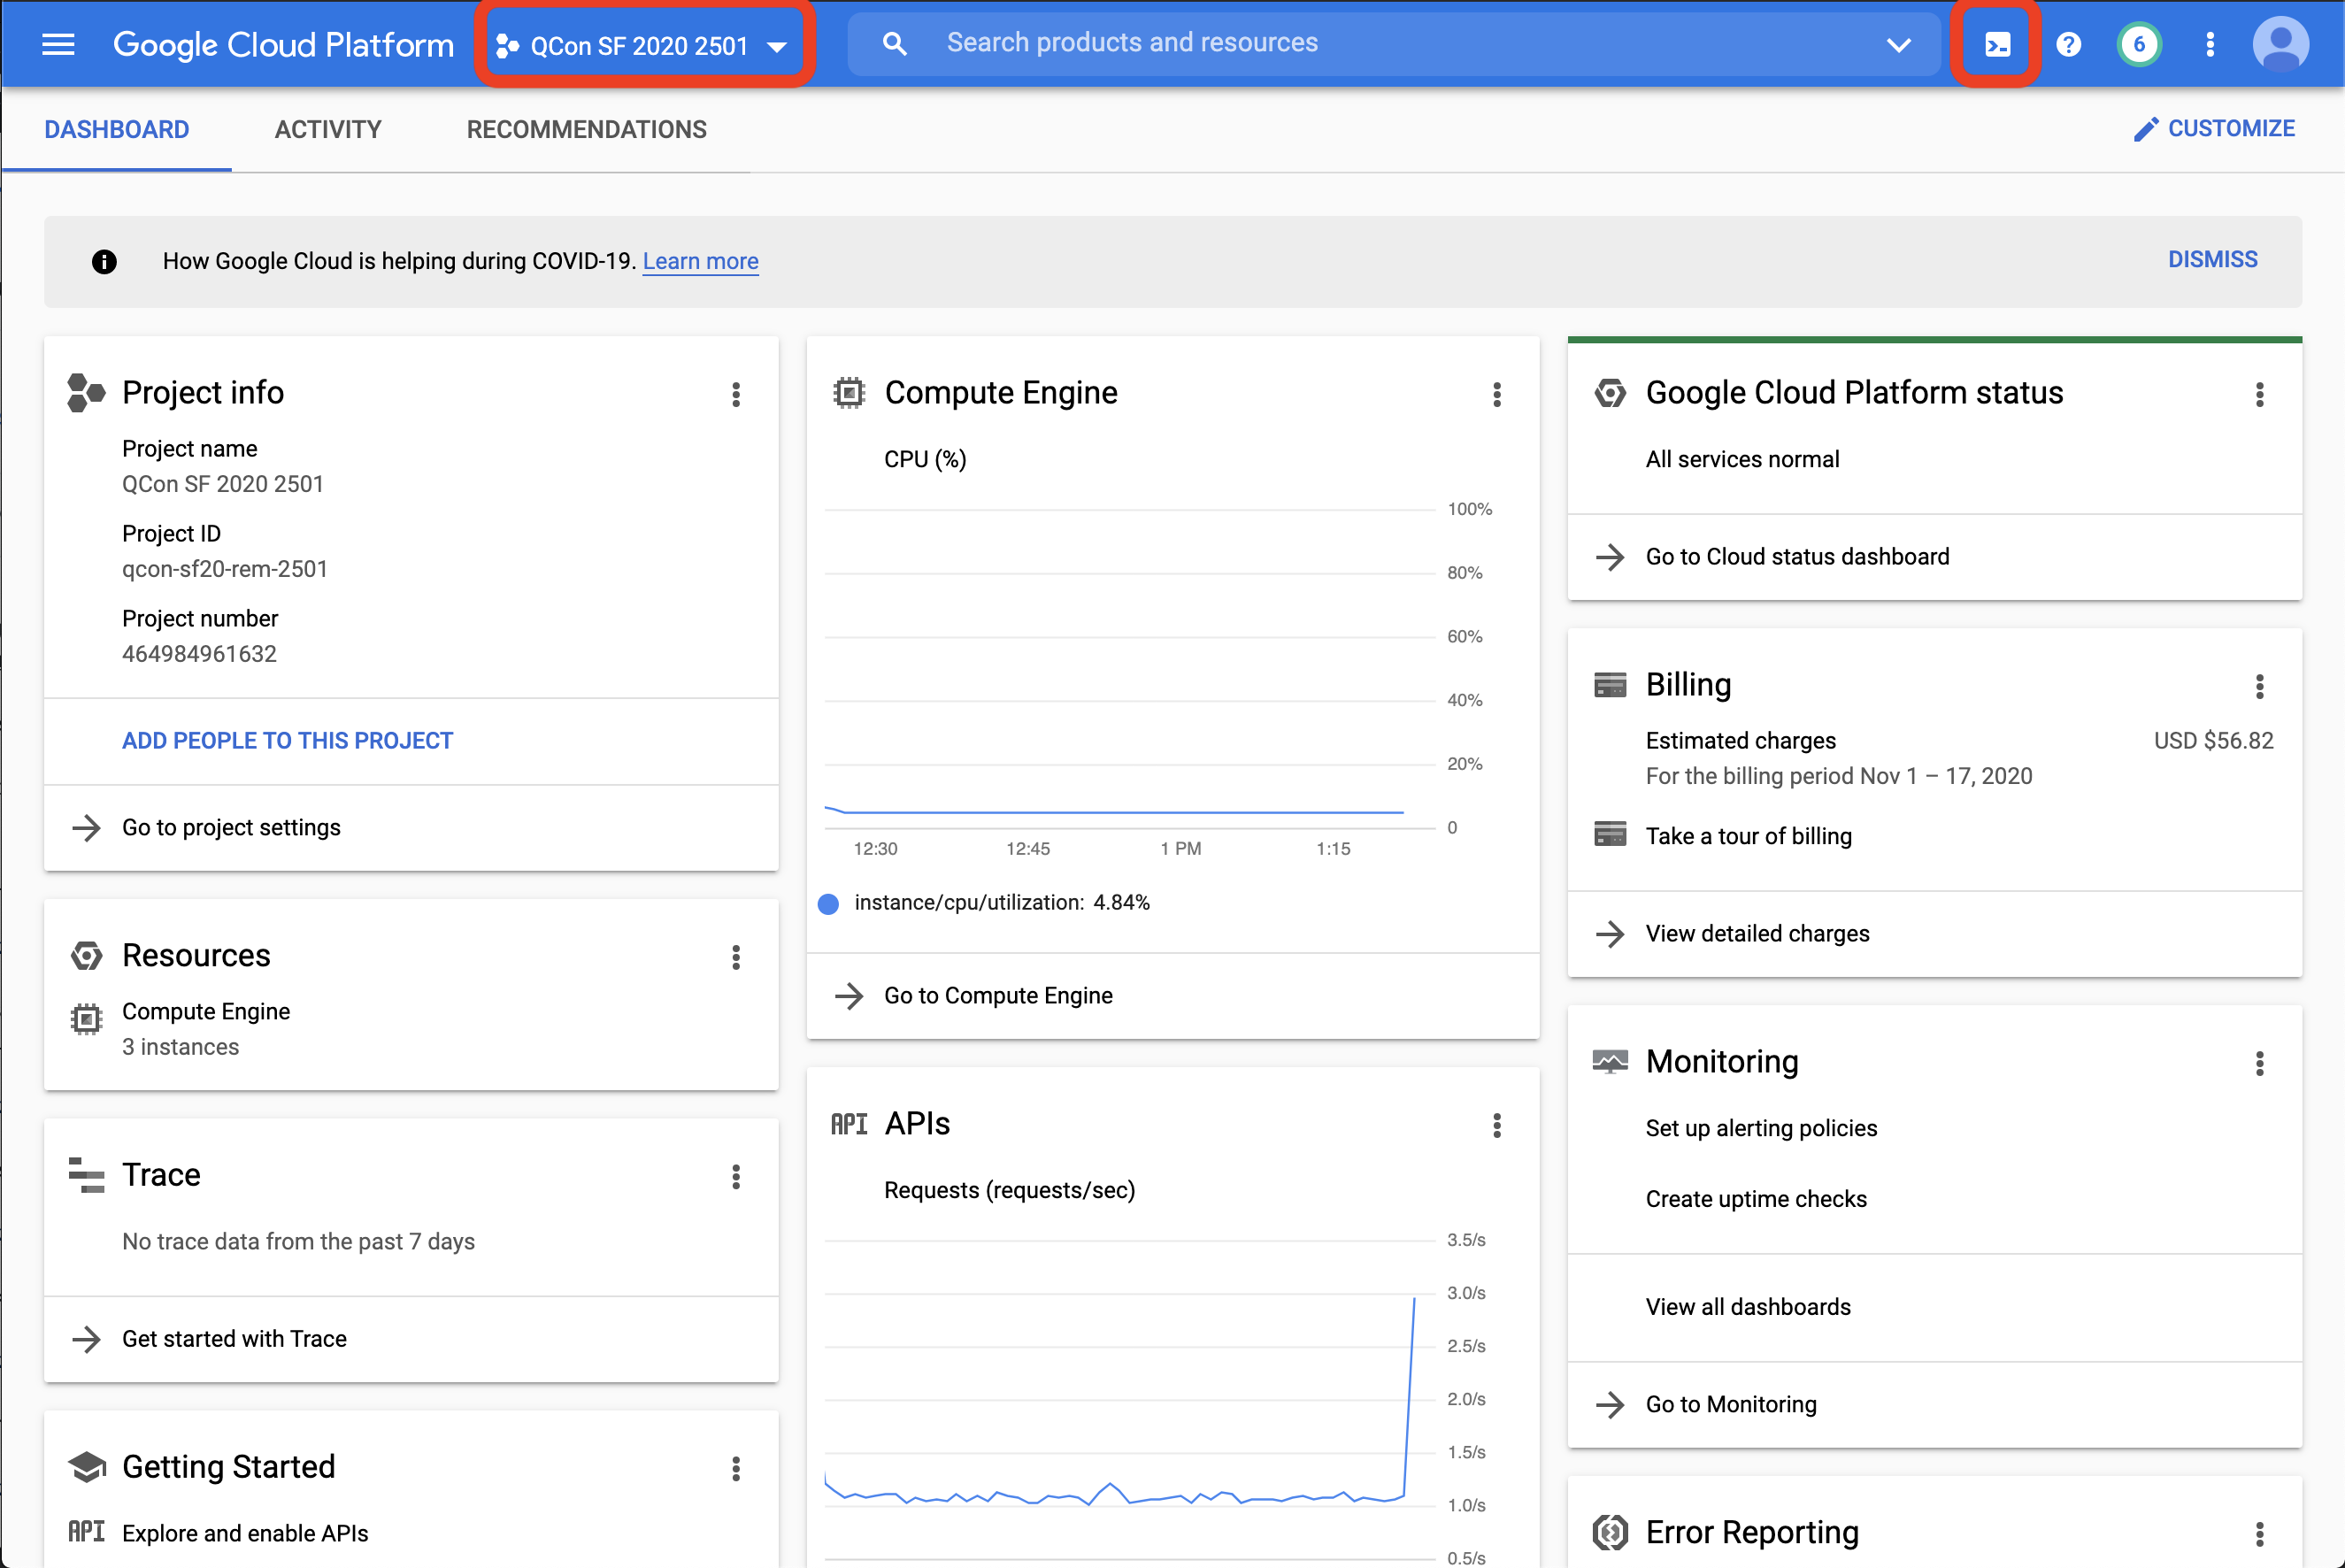
With the project selected, you can now open Cloud Sheel
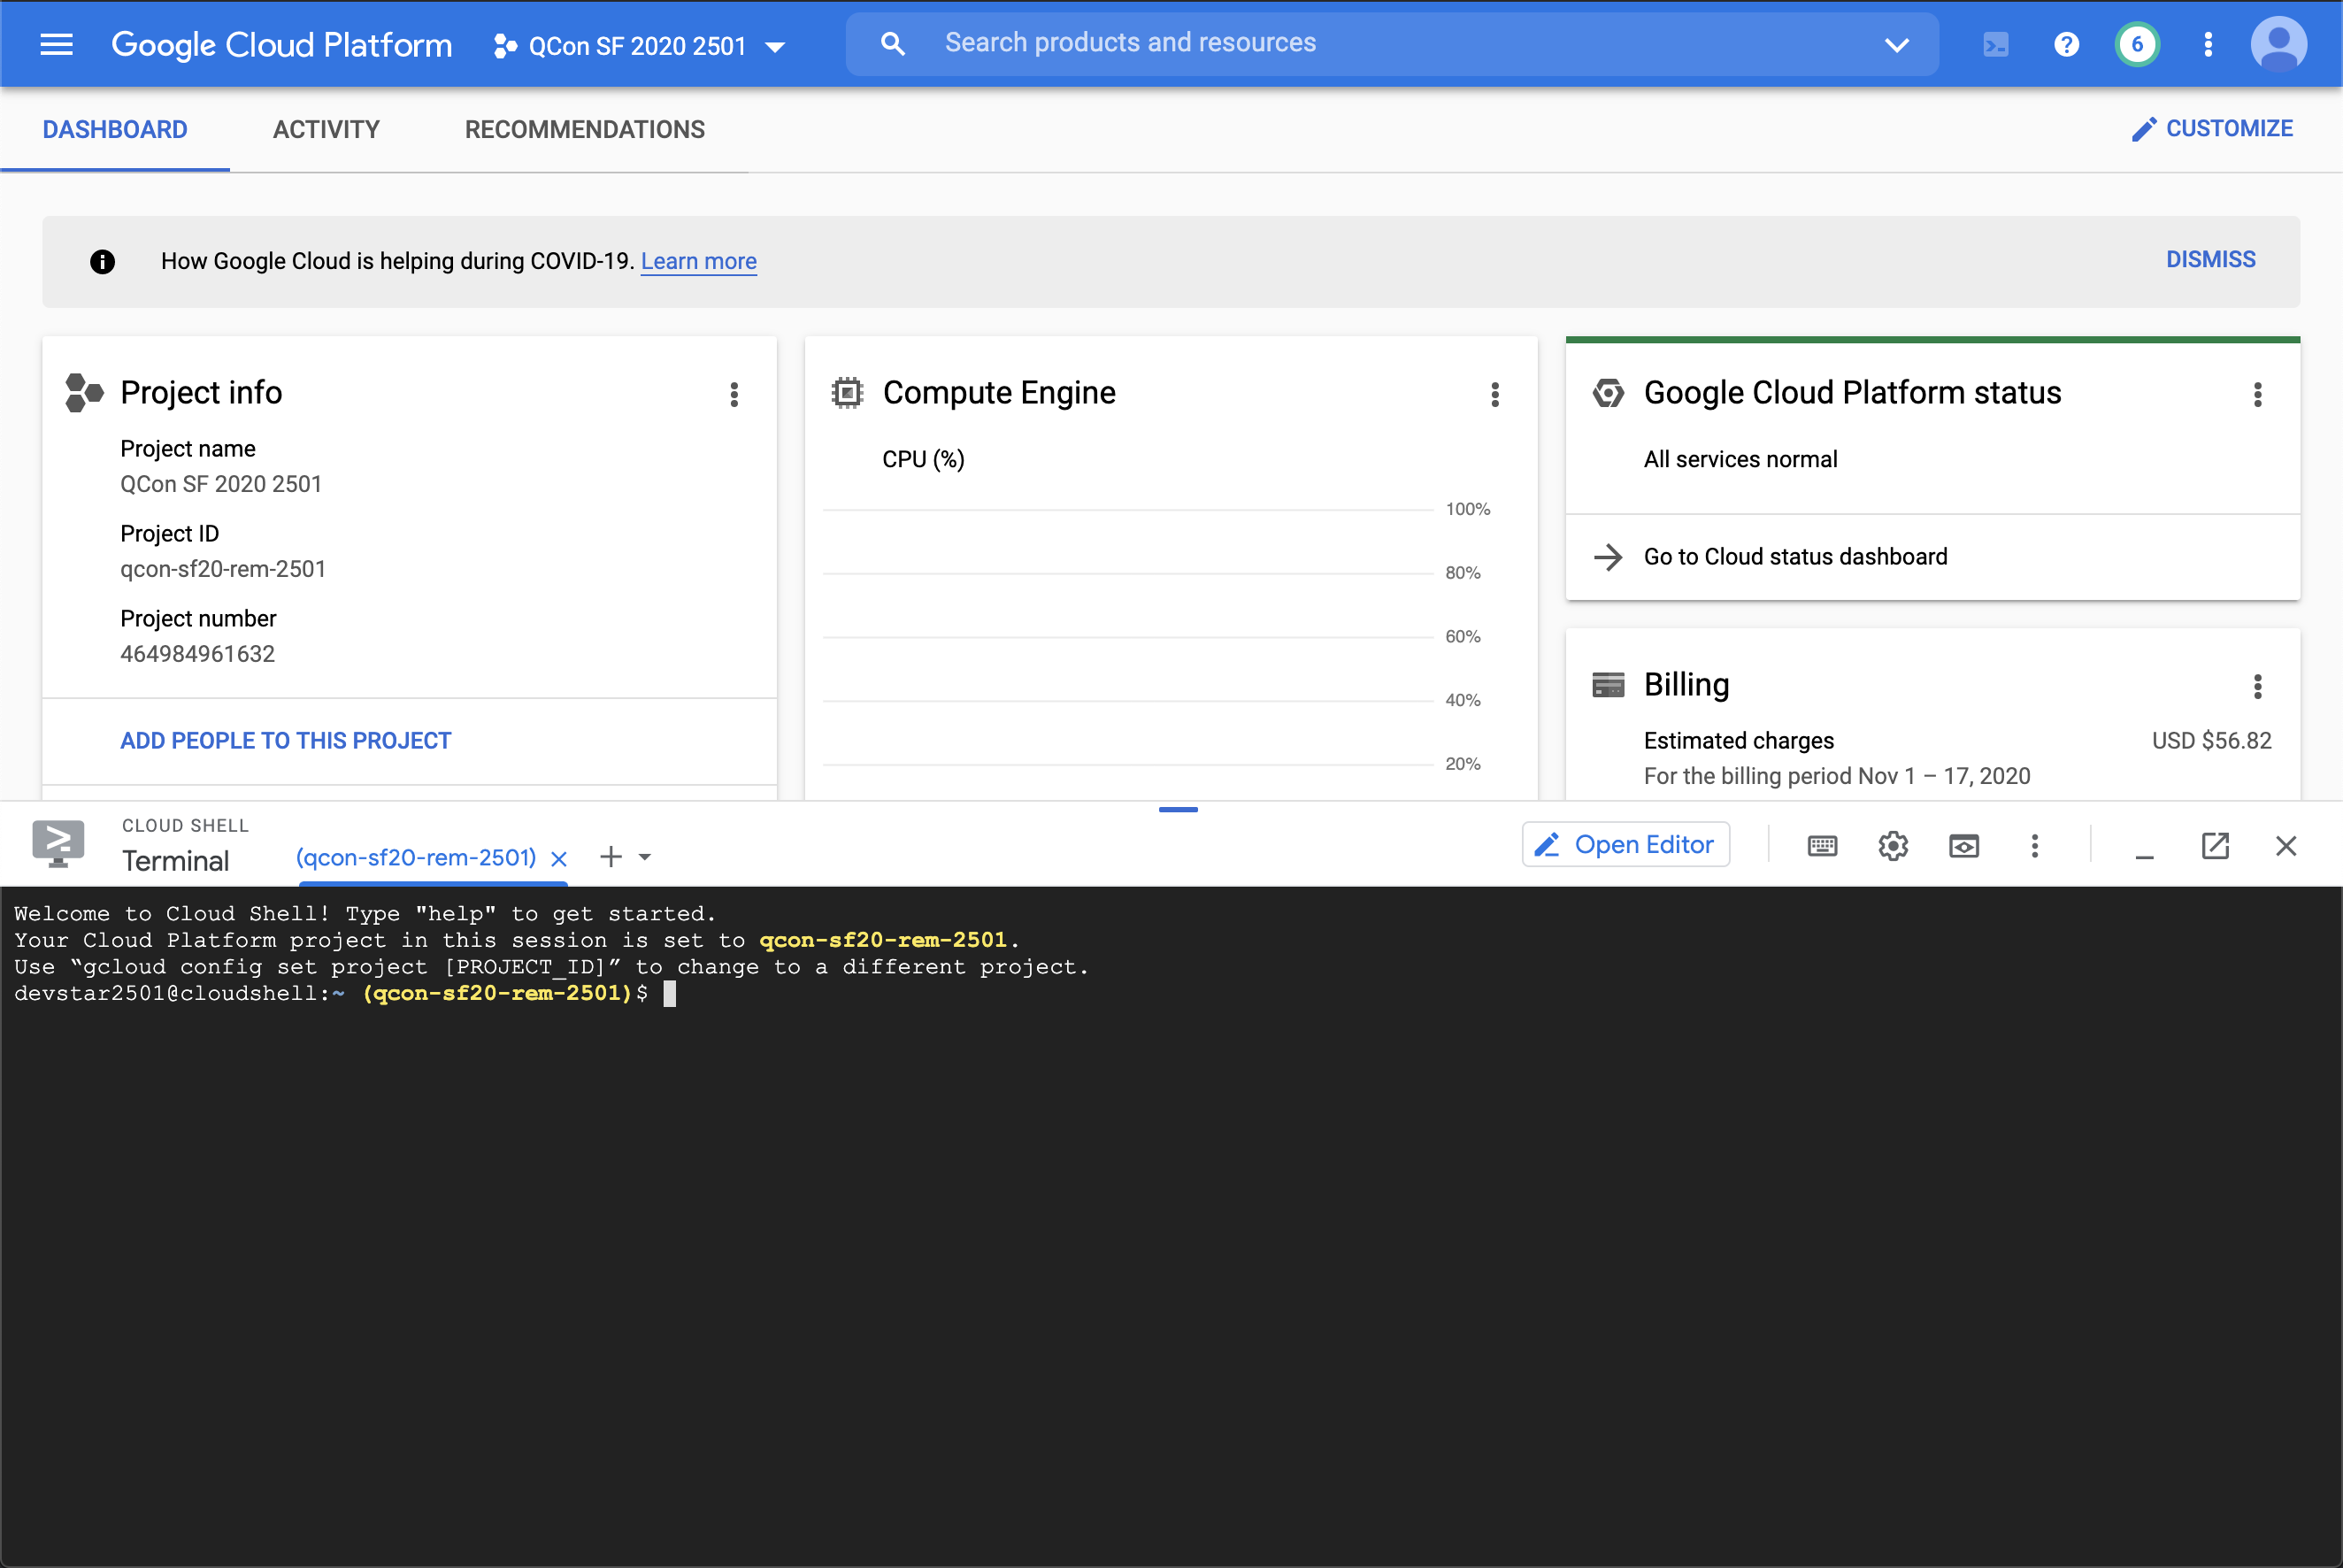
You should see Cloud Shell at the bottom half of the screen, notice that you can resize it to make it bigger:
The first step is to create a cluster to work with. You will create a Kubernetes cluster using Google Kubernetes Engine.
Everything on GCP is operated with API (even from the console!). Enable the Google Cloud Platform APIs so that you can create a Kubernetes cluster.
gcloud services enable compute.googleapis.com \
    container.googleapis.com \
    containerregistry.googleapis.com
Set default region and zone for our cluster:
gcloud config set compute/zone us-central1-c
gcloud config set compute/region us-central1
You can now create a Kubernetes cluster in Google Cloud Platform! Use Kubernetes Engine to create a cluster:
gcloud container clusters create workshop \
      --cluster-version 1.16 \
      --machine-type n2-standard-4 \
      --num-nodes 3 \
      --scopes cloud-platform
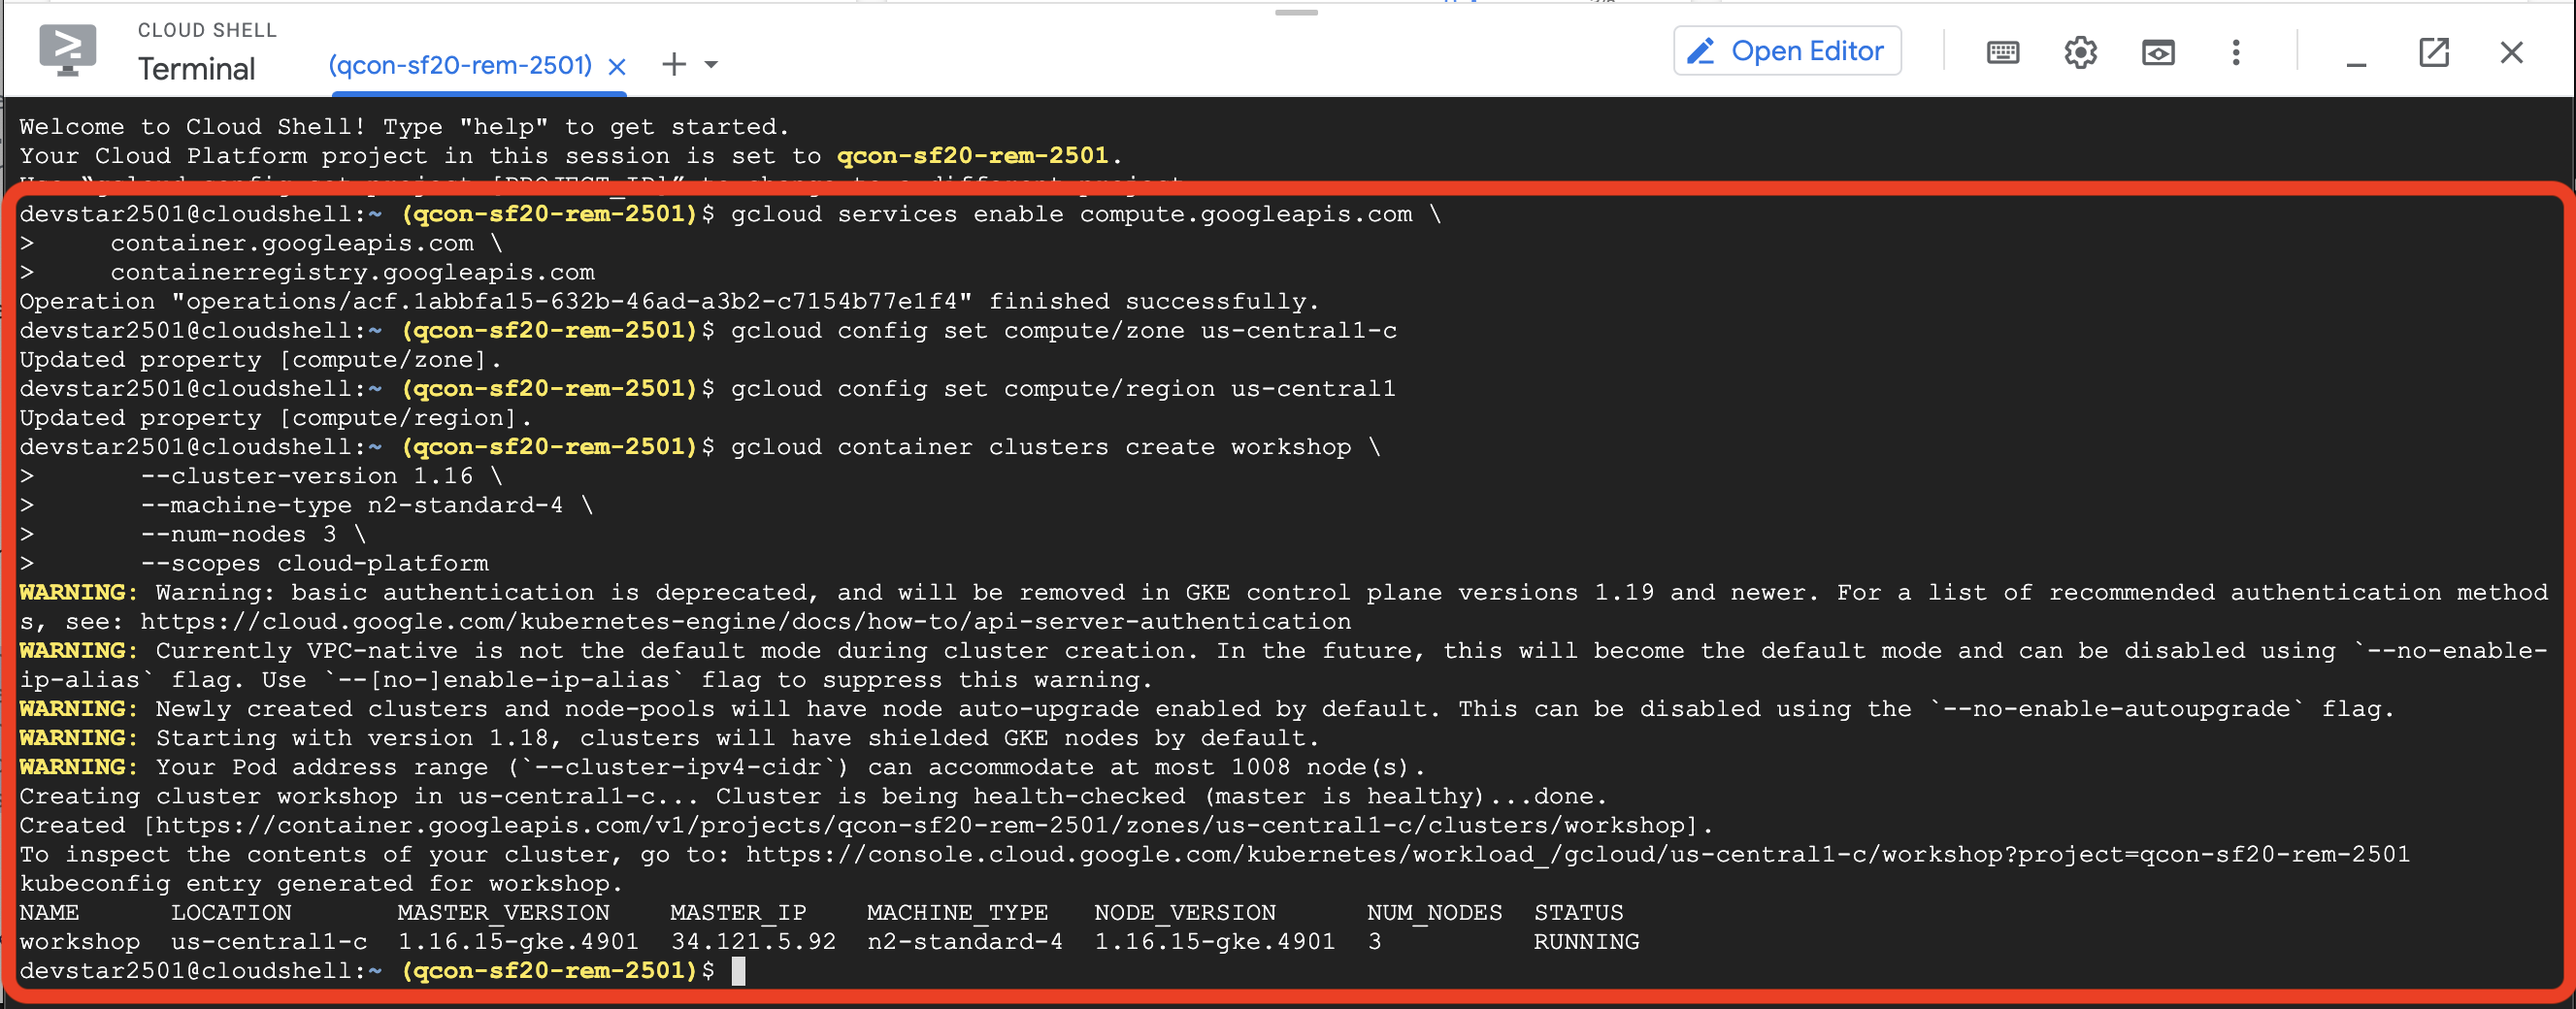
This will take some minutes, leave the Tab open so you can move forward to Camunda Cloud Account and Cluster while the Kubernetes Cluster is being created.
Create a Camunda Cloud Account and Cluster
Login into your account and create a Cluster (Click to Expand)
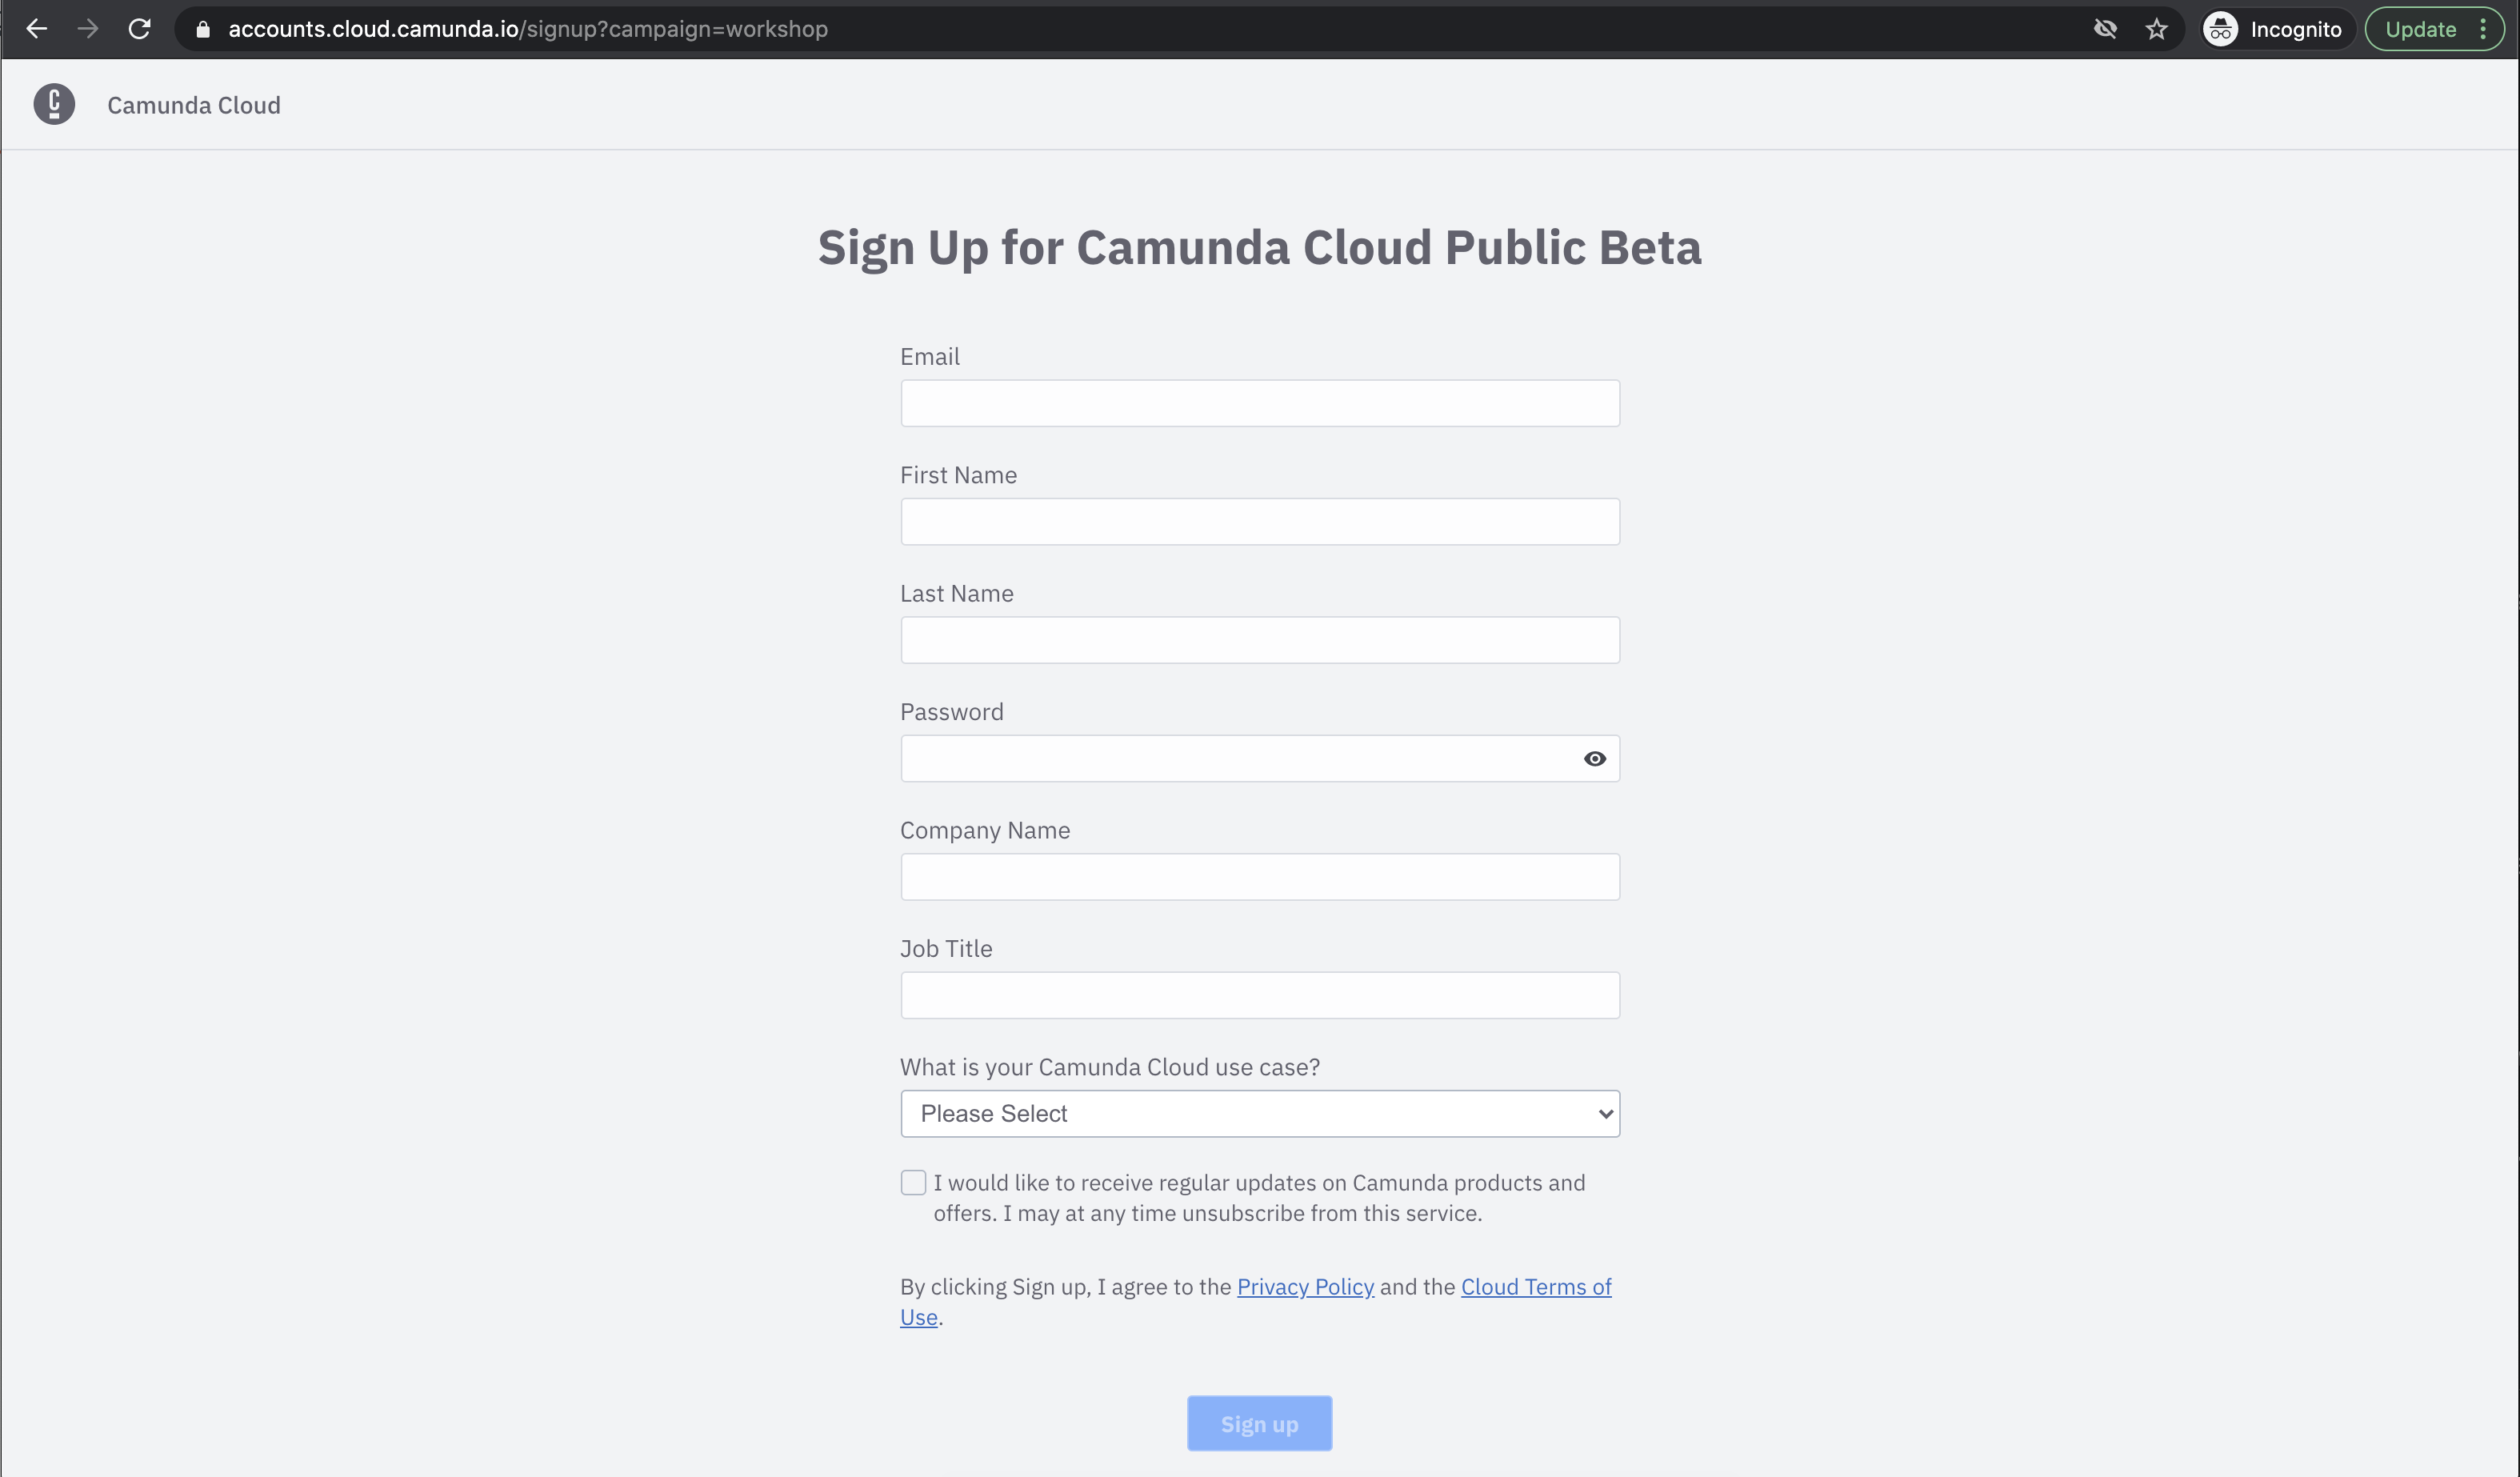
Fill the form to create a new account, you will need to use your email to confirm your account creation. You will be using Camunda Cloud for Microservices Orchestration ;)
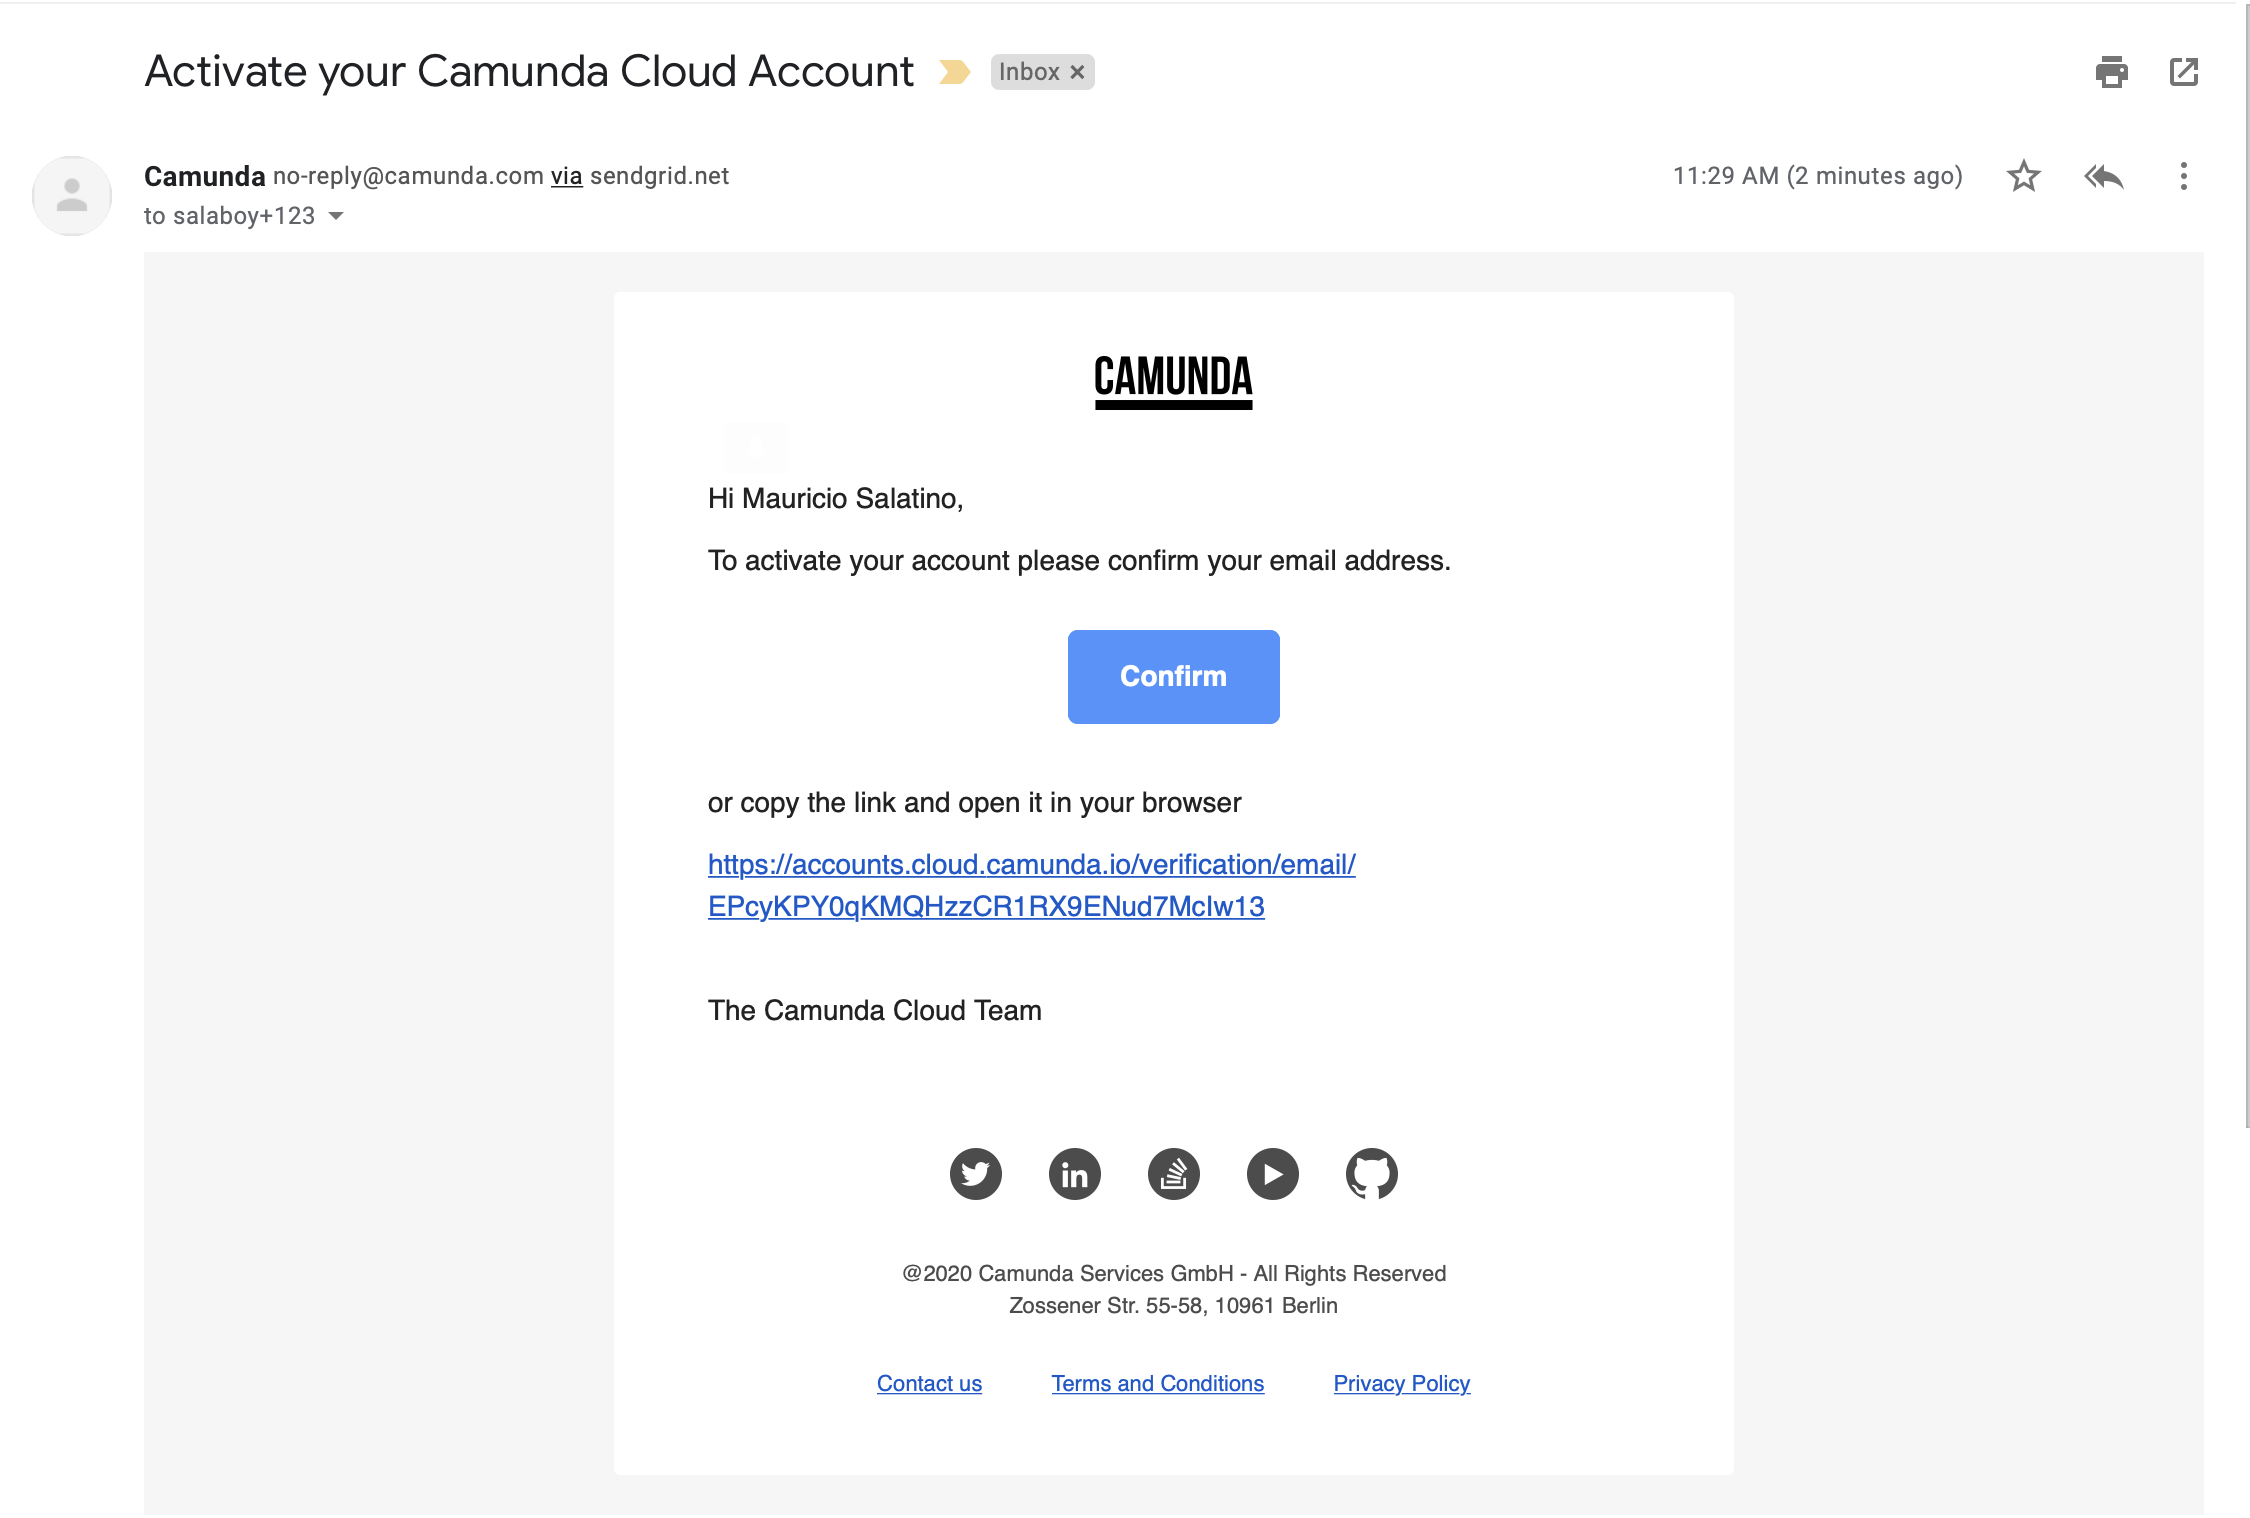
Check your inbox to Activate your account and follow the links to login, after confirmation:
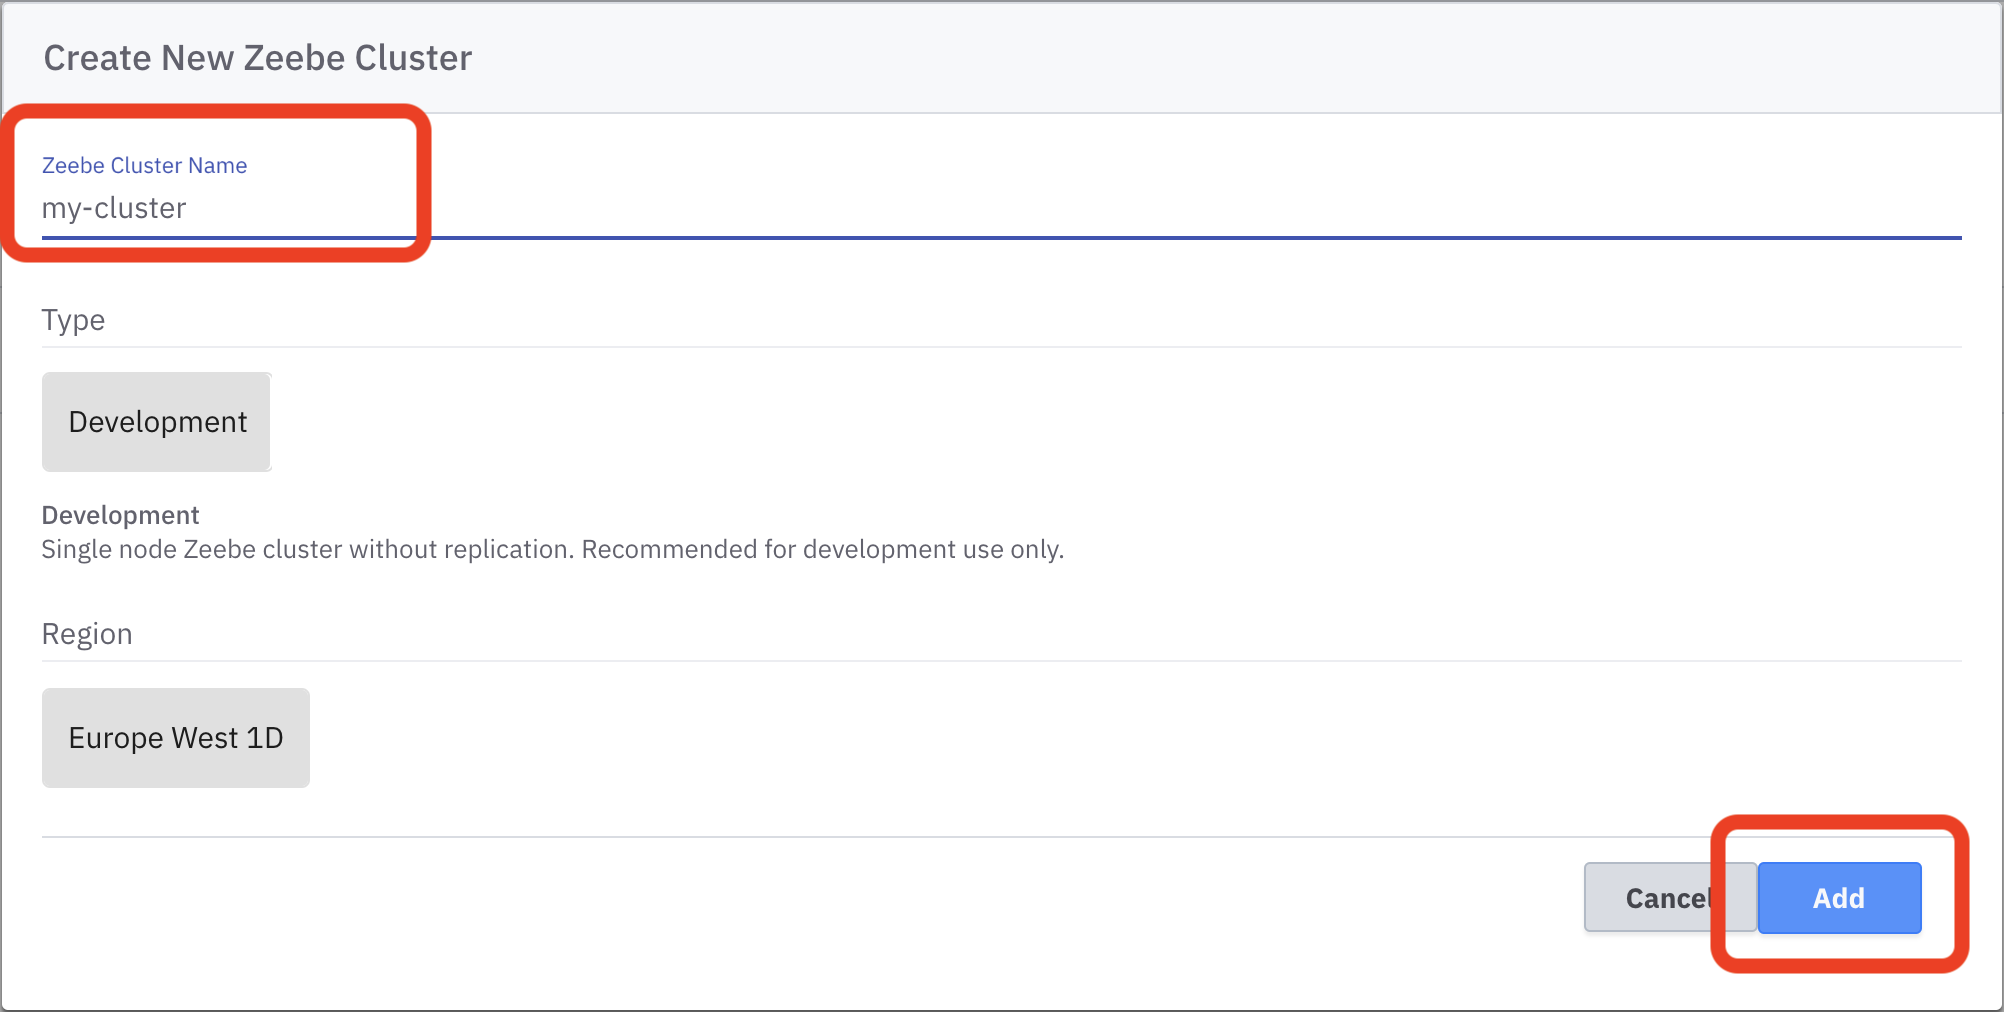
Once activated, Login with your credentials and let's create a new Zeebe Cluster, you will be using this cluster later on in the workshop, but it is better to set it up early on.

Create a new cluster called my-cluster:
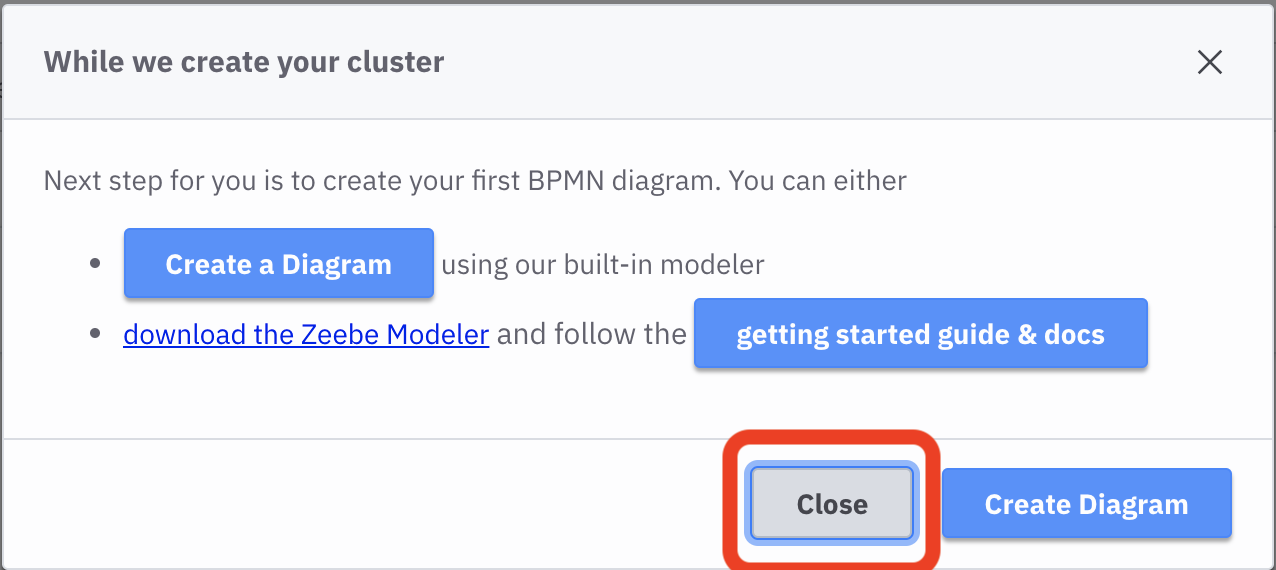
Disregard, creating a model if you are asked to and just close the popup:
Your cluster is now being created:

Make sure that you have followed the steps in Setting up your Google Cloud account and Setting up your Camunda Cloud account, as both of these accounts needs to be ready to proceed to the next sections.
Let's switch back to Google Cloud to setup your Kubernetes Cluster to start deploying your Cloud-Native Applications! 🚀
During this workshop, you will be using Cloud Shell to interact with your Kubernetes Cluster, this avoids you setting up tools in your local environment and it provides quick access to the cluster resources.
Cloud Shell comes with pre-installed tools like: kubectl and helm.
Because you will be using the kubectl and helm commands a lot during the next couple of hours we recommend you to create the following aliases:
alias k=kubectl
alias h=helm
Now instead of typing kubectl or helm you can just type k and h respectivily.
You can now type inside Cloud Shell:
k get nodesYou should see something like this:
Next step you will install Knative Serving and Knative Eventing. The Cloud-Native applications that you will deploy in later steps were built having Knative in mind.
If you have the previous aliases set up, you can copy the entire block and paste it Cloud Shell
k apply --filename https://github.com/knative/serving/releases/download/v0.18.0/serving-crds.yaml
k apply --filename https://github.com/knative/serving/releases/download/v0.18.0/serving-core.yaml
k apply --filename https://github.com/knative/net-kourier/releases/download/v0.18.0/kourier.yaml
k patch configmap/config-network \
  --namespace knative-serving \
  --type merge \
  --patch '{"data":{"ingress.class":"kourier.ingress.networking.knative.dev"}}'
k apply --filename https://github.com/knative/serving/releases/download/v0.18.0/serving-default-domain.yaml
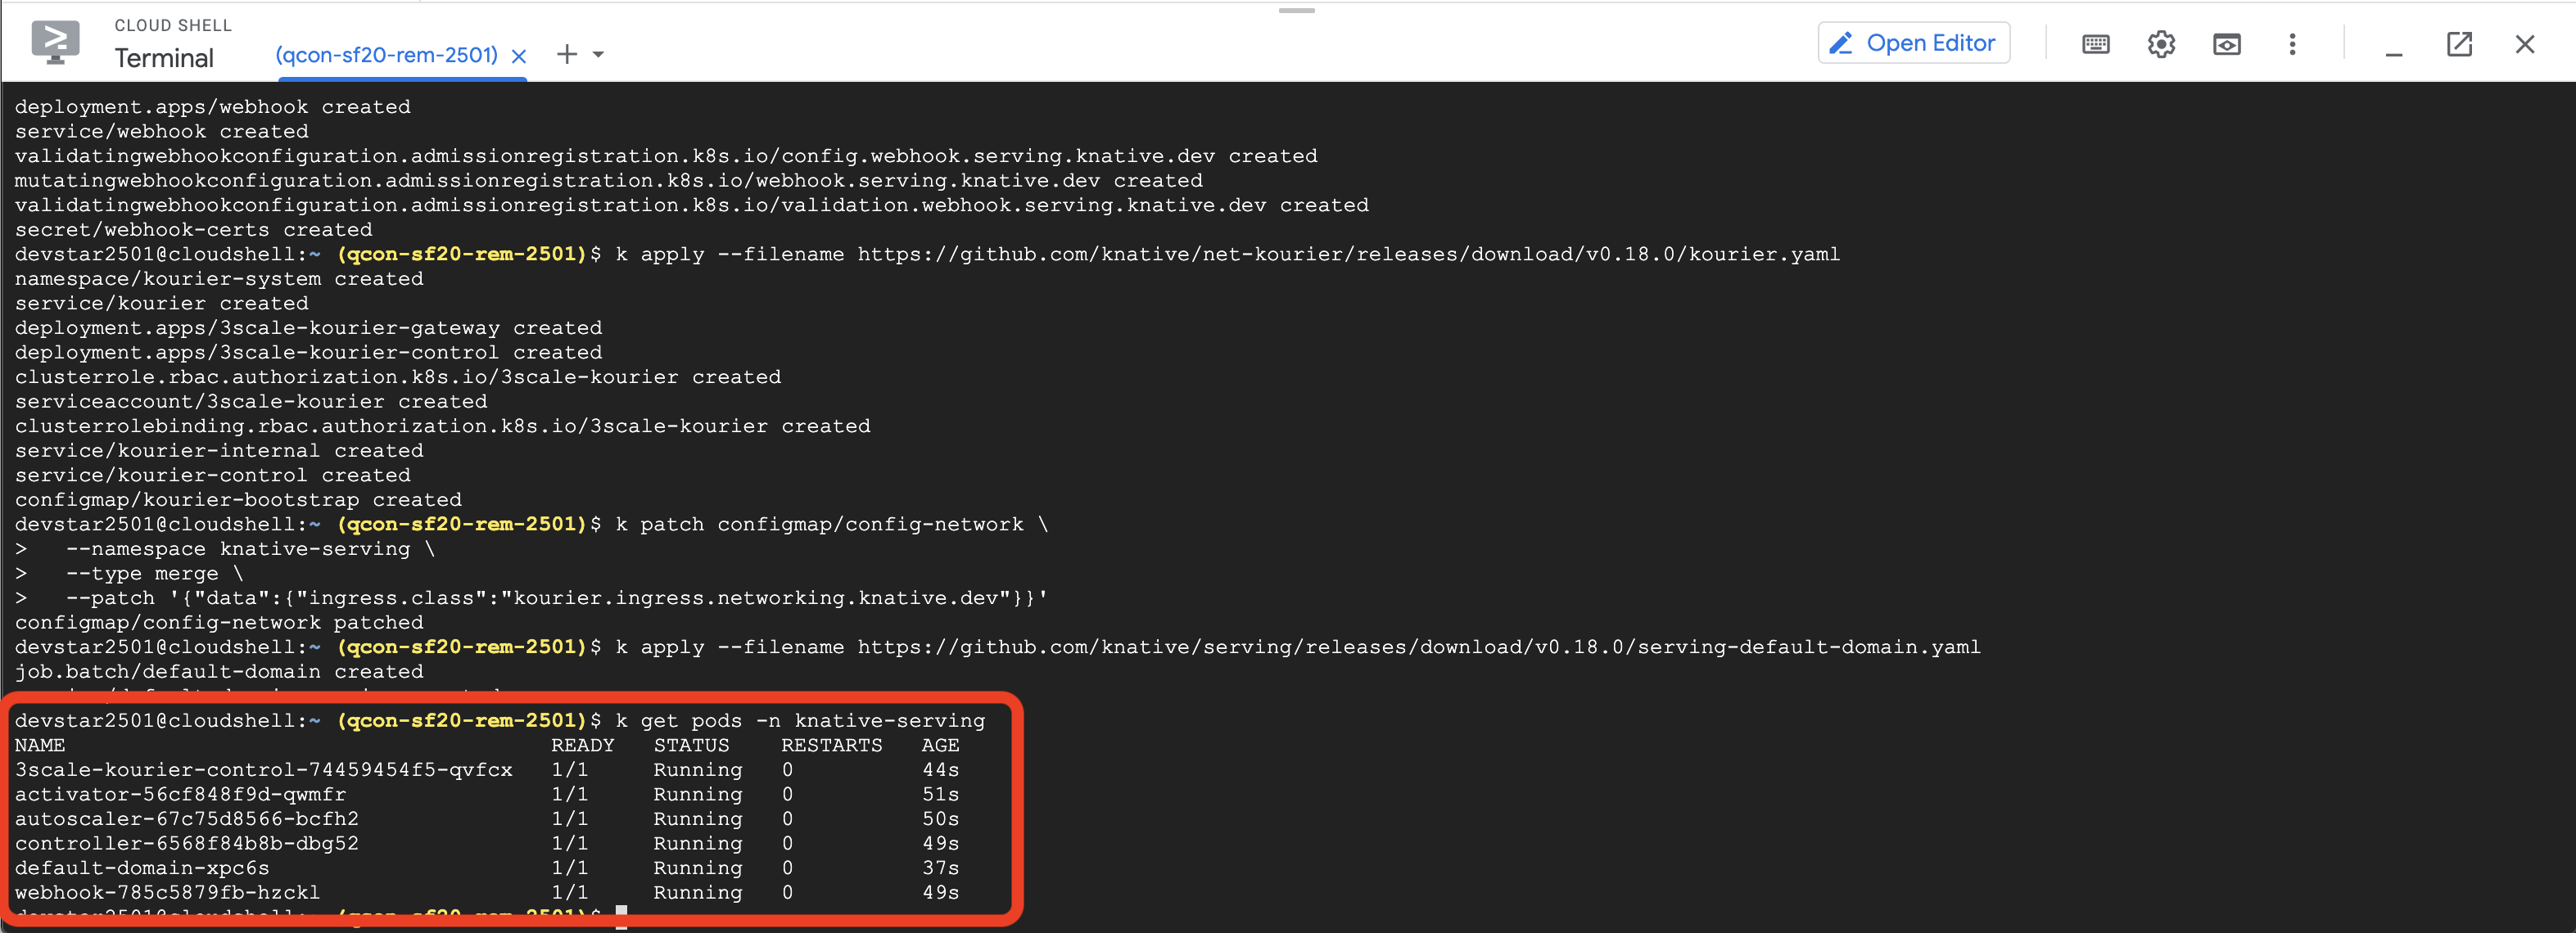
You can check that the installation worked out correctly by checking that all the Knative Serving pods are running:
k get pods -n knative-servingYou should see something like this:
k apply --filename https://github.com/knative/eventing/releases/download/v0.18.0/eventing-crds.yaml
k apply --filename https://github.com/knative/eventing/releases/download/v0.18.0/eventing-core.yaml
k apply --filename https://github.com/knative/eventing/releases/download/v0.18.0/in-memory-channel.yaml
k apply --filename https://github.com/knative/eventing/releases/download/v0.18.0/mt-channel-broker.yaml
k create -f - <<EOF
apiVersion: eventing.knative.dev/v1
kind: Broker
metadata:
 name: default
 namespace: default
EOF
You can check that the installation worked out correctly by checking that all the Knative Eventing pods are running:
k get pods -n knative-eventingYou should see something like this:
Important: if you see Error in the imc-dispatcher*** pod try copy & pasting the previous k apply.. commands again and check again.
Now, you have everything ready to deploy your Cloud-Native applications to Kubernetes. 🎉 🎉
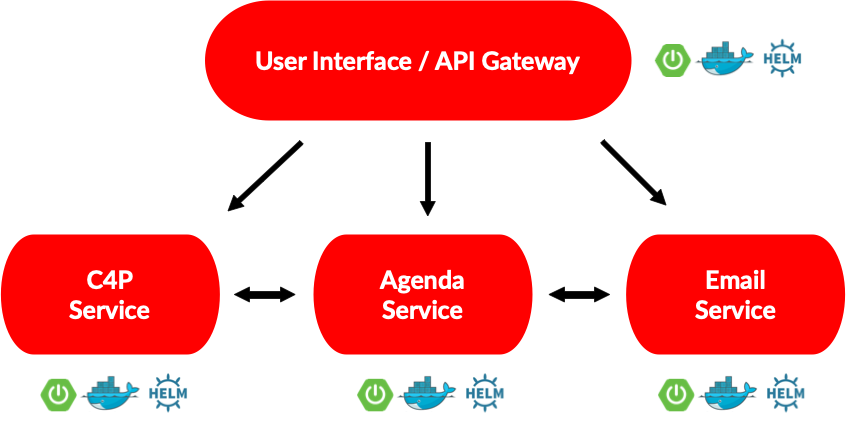
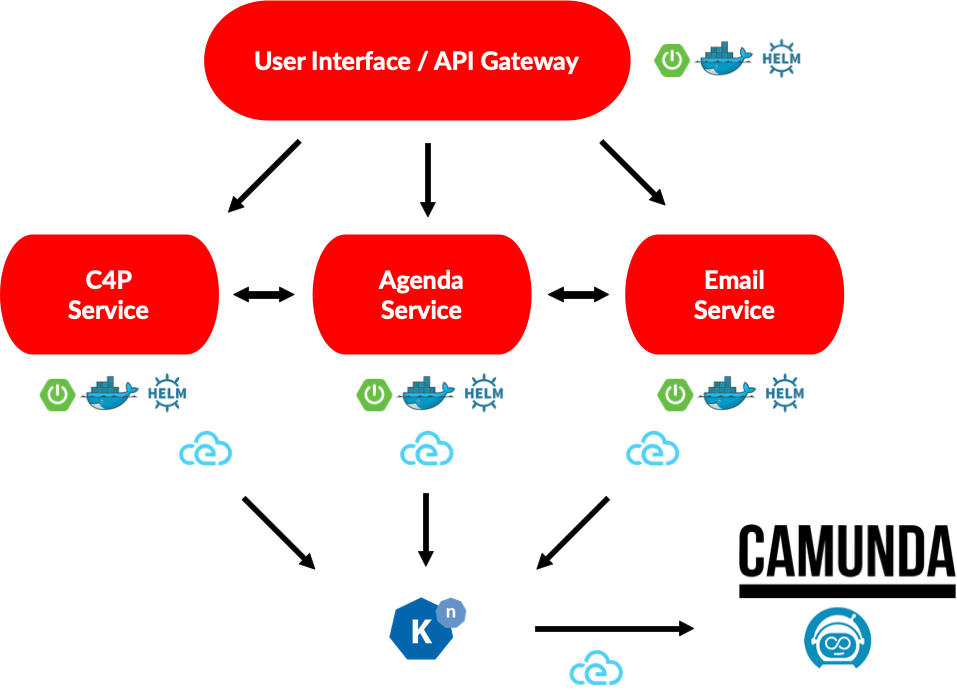
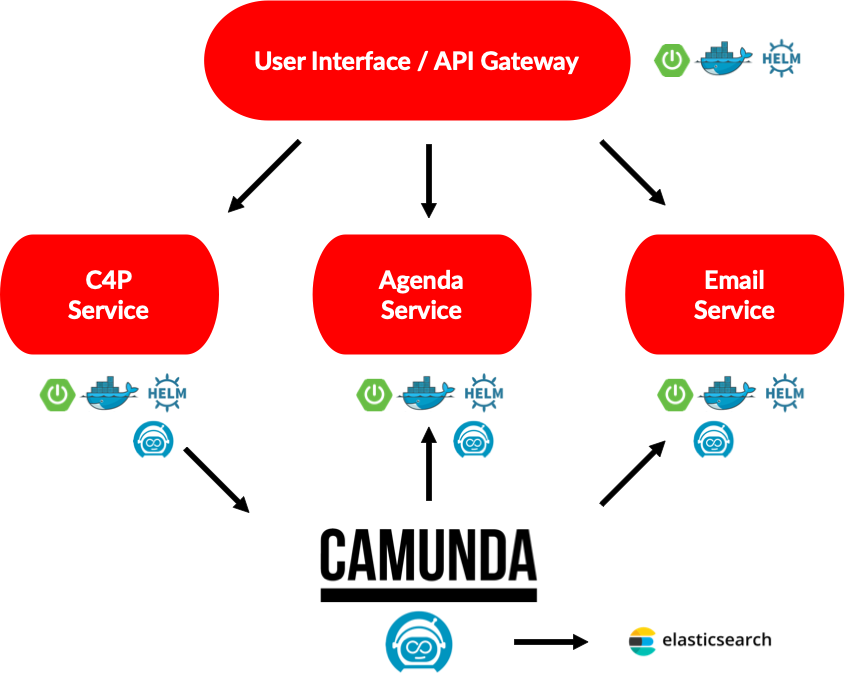
In this section you will be deploying a Conference Cloud-Native application composed by 4 simple services.
These services communicate between each other using REST calls.
With Knative installed you can proceed to install the first version of the application. You will do this by using Helm a Kuberenetes Package Manager. As with every package manager you need to add a new Helm Repository where the Helm packages/charts for the workshop are stored.
You can do this by runnig the following commands:
h repo add workshop http://chartmuseum-jx.35.222.17.41.nip.io
h repo update
Now you are ready to install the application by just running the following command:
h install fmtok8s workshop/fmtok8s-app
You should see something like this (ignore the warnings):
The application Helm Chart source code can be found here.
You can check that the application running with the following two commands:
- Check the pods of the running services with:
k get pods- You can also check the Knative Services with:
k get ksvc
You should see that pods are being created or they are running and that the Knative Services were created, ready and have an URL:
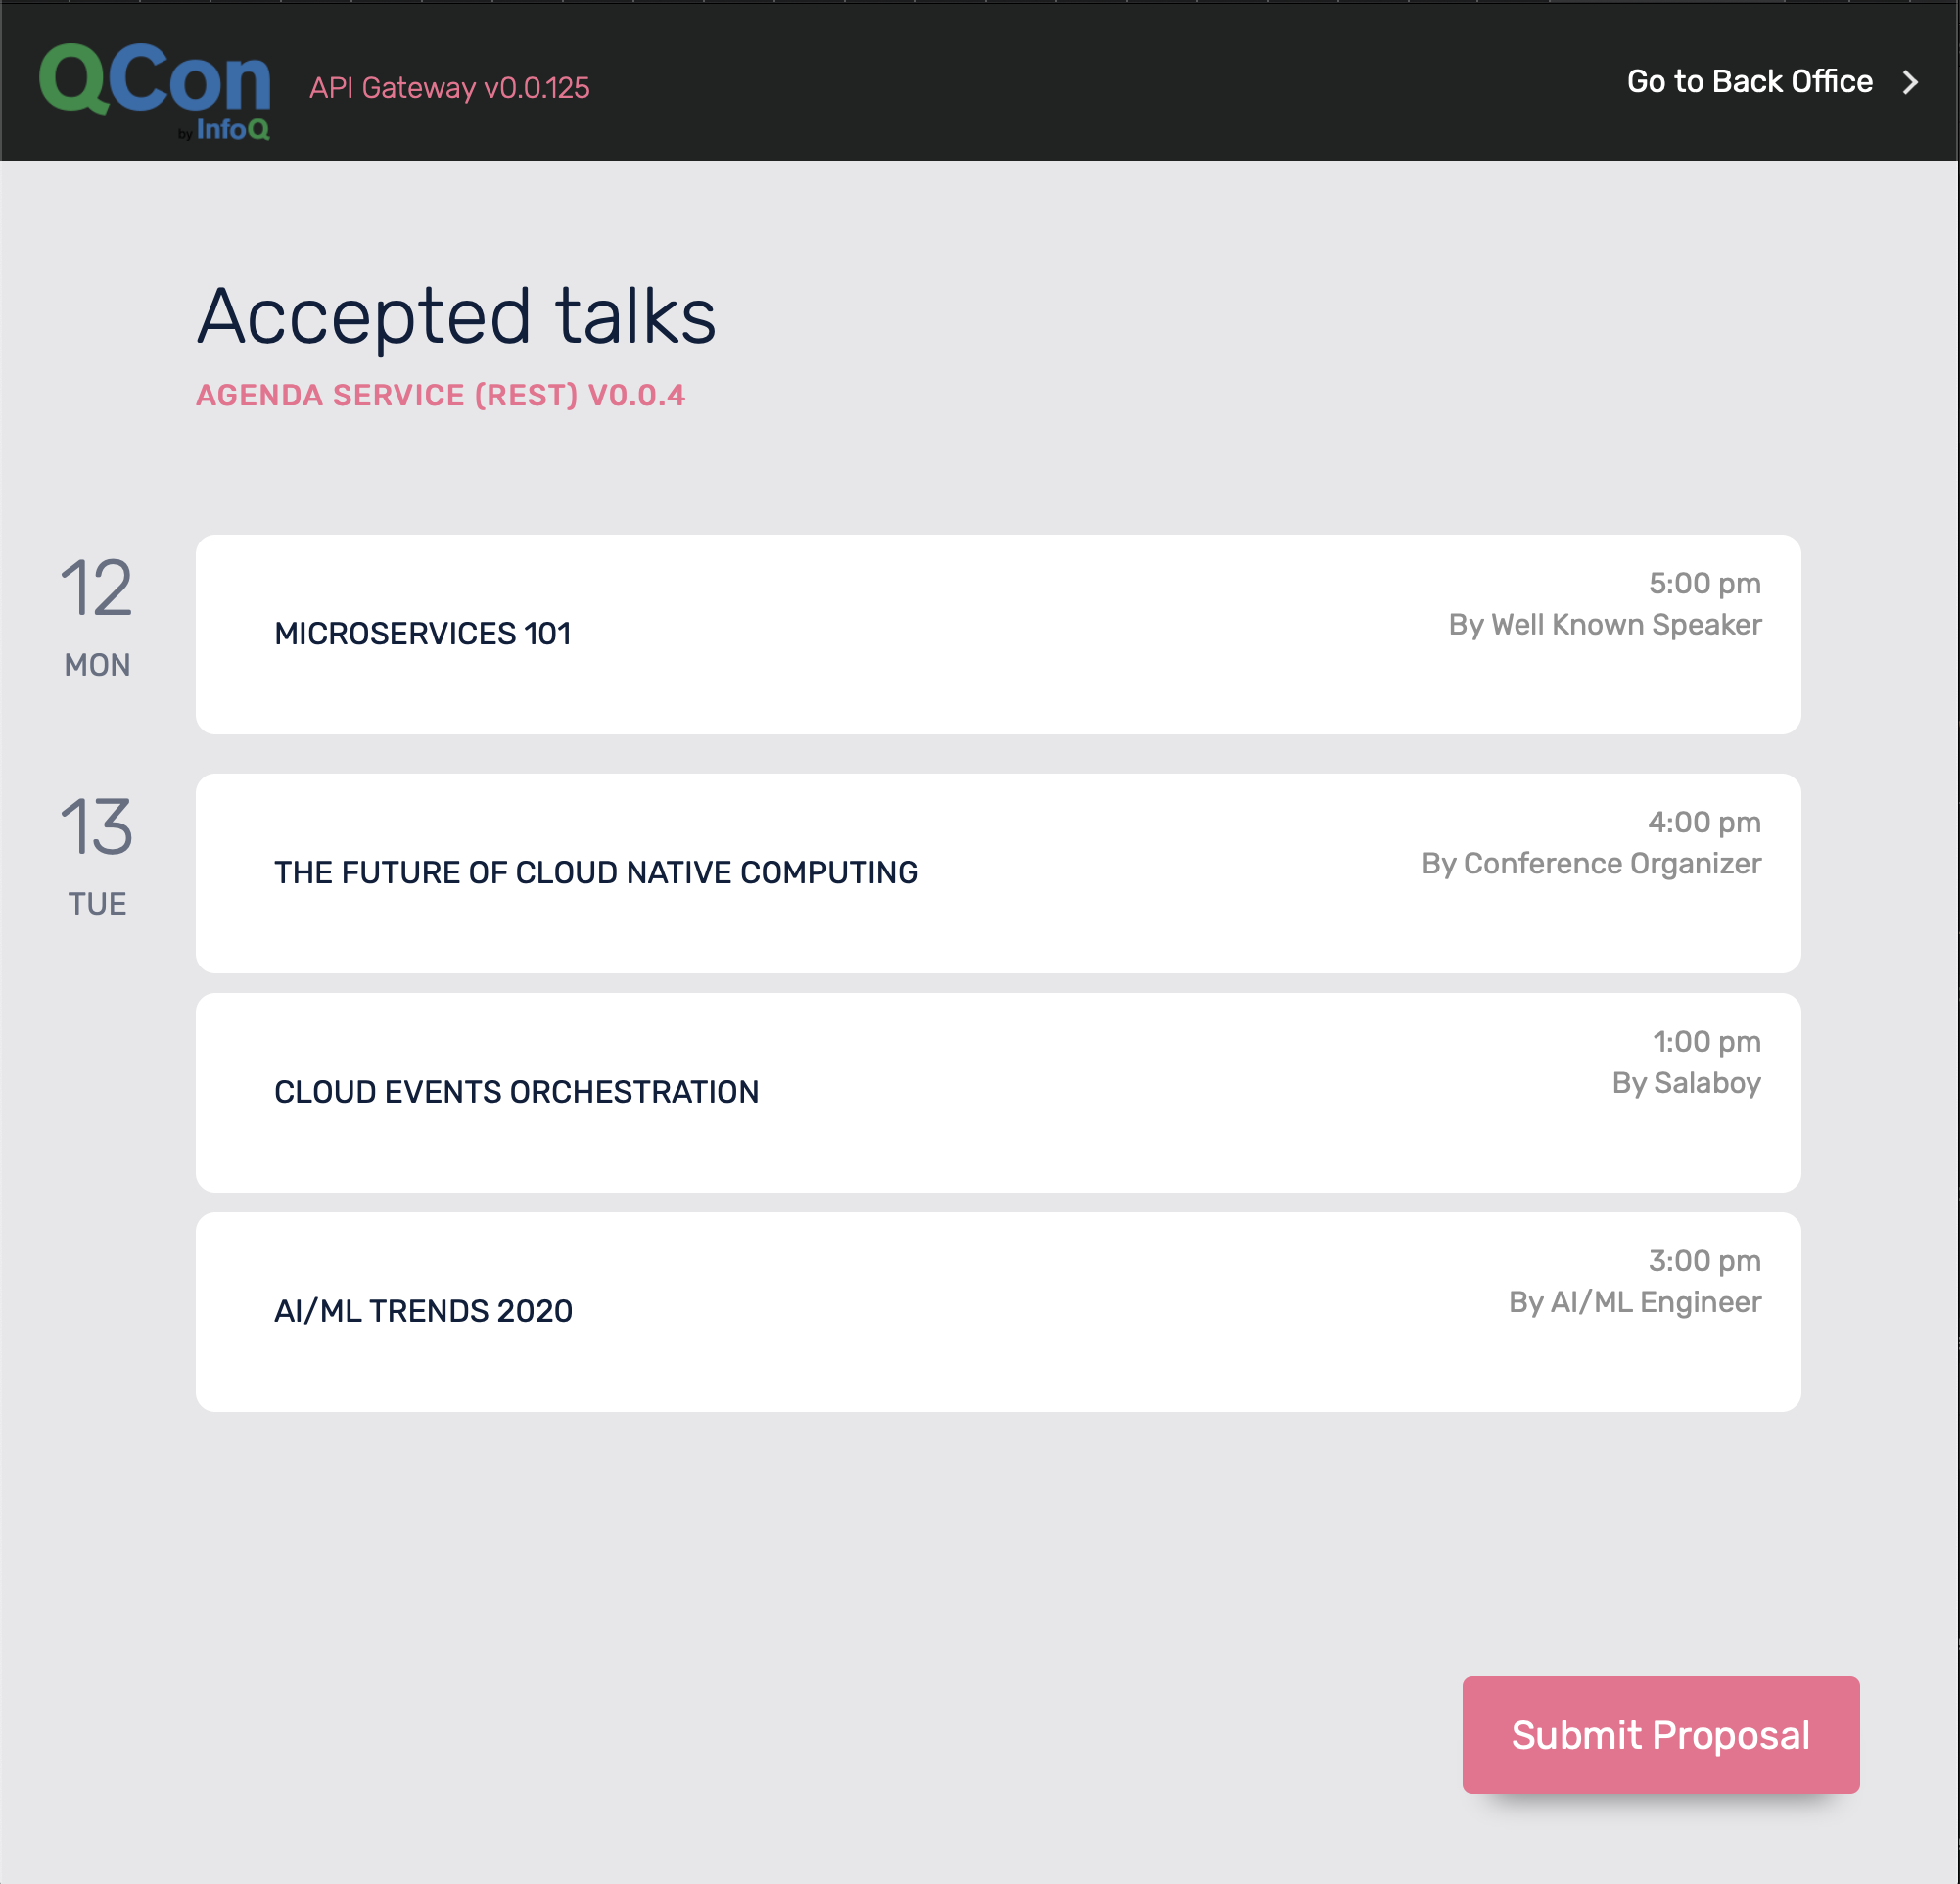
As soon all the pods are running and the services are ready you can copy and paste the fmtok8s-api-gateway URL into a different tab in your browser to access the application http://fmtok8s-api-gateway.default.XXX.xip.io
Now you can go ahead and:
-
Submit a proposal by clicking the Submit Proposal button in the main page
-
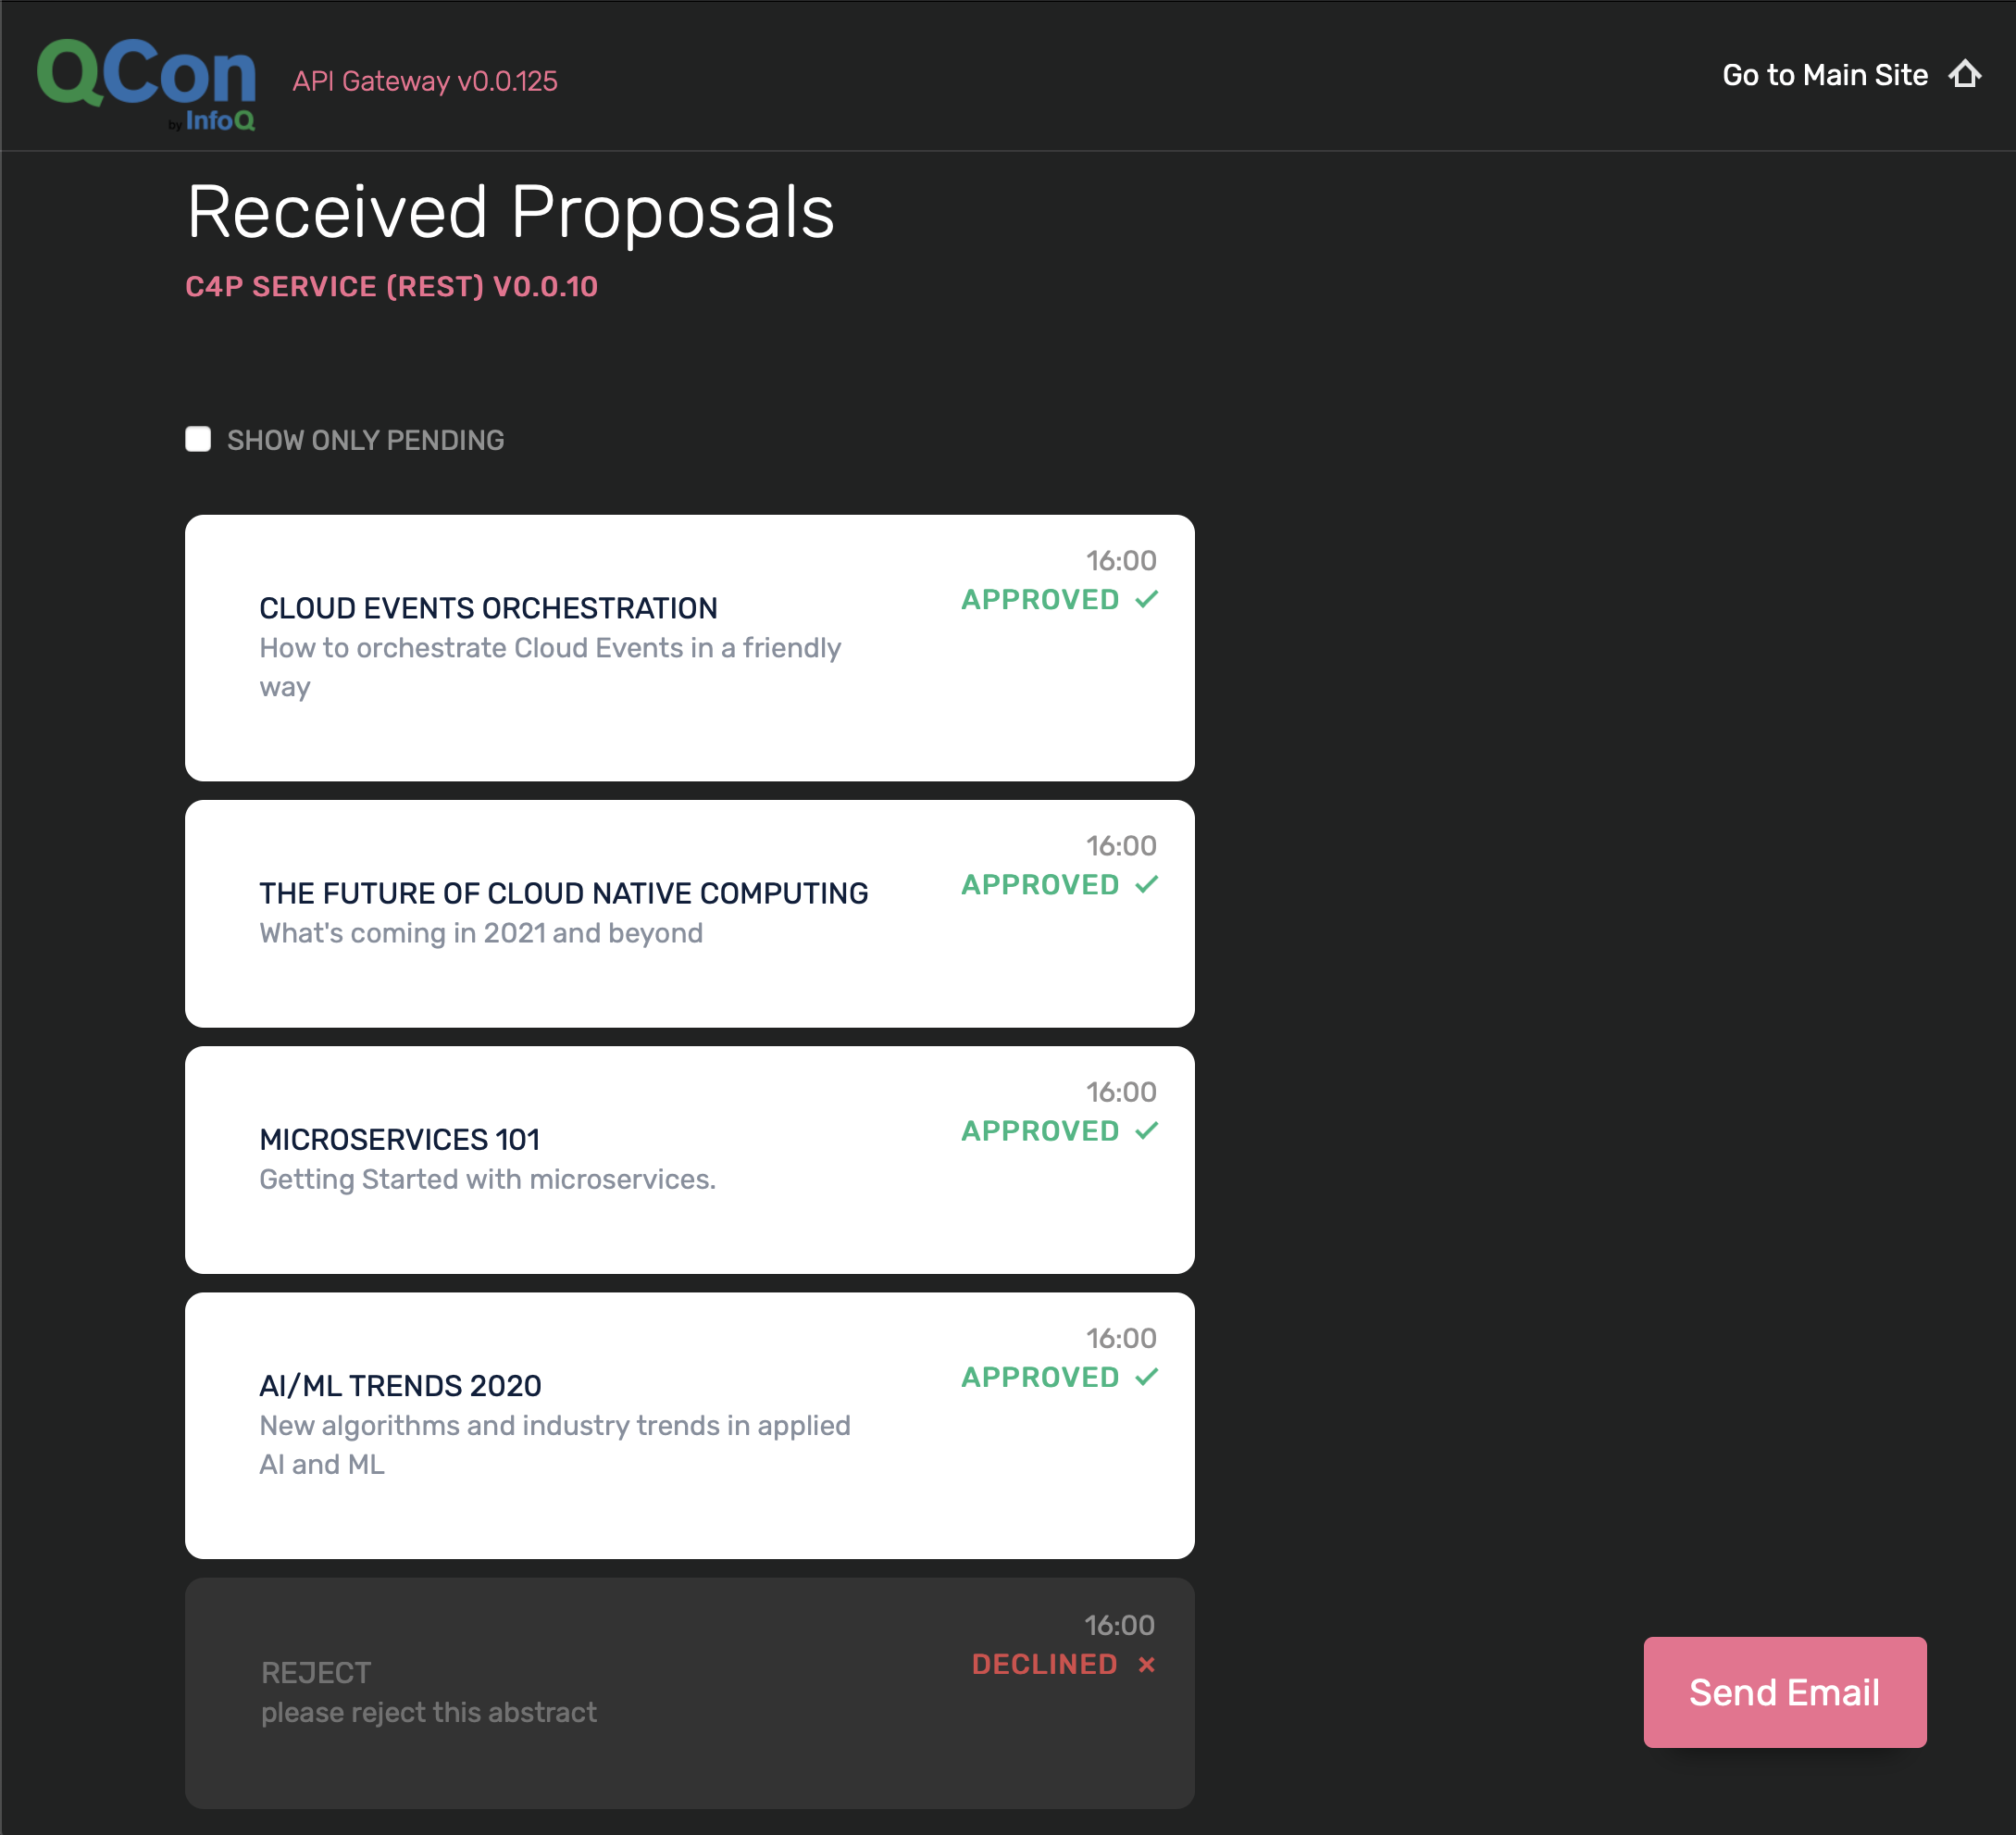
Go to the back office (top right link) and Approve or Reject the proposal
- Check the email service to see the notification email sent to the potential speaker, this can be done with
k get podsWhere you should see the Email Service pod:
And then you can tail the logs by running:
k logs -f fmtok8s-email-<YOUR POD ID> user-containerYou should see the service logs being tailed, you can exit/stop taling the logs with CTRL+C.
And if you approved the submitted proposal you should also see something like this:
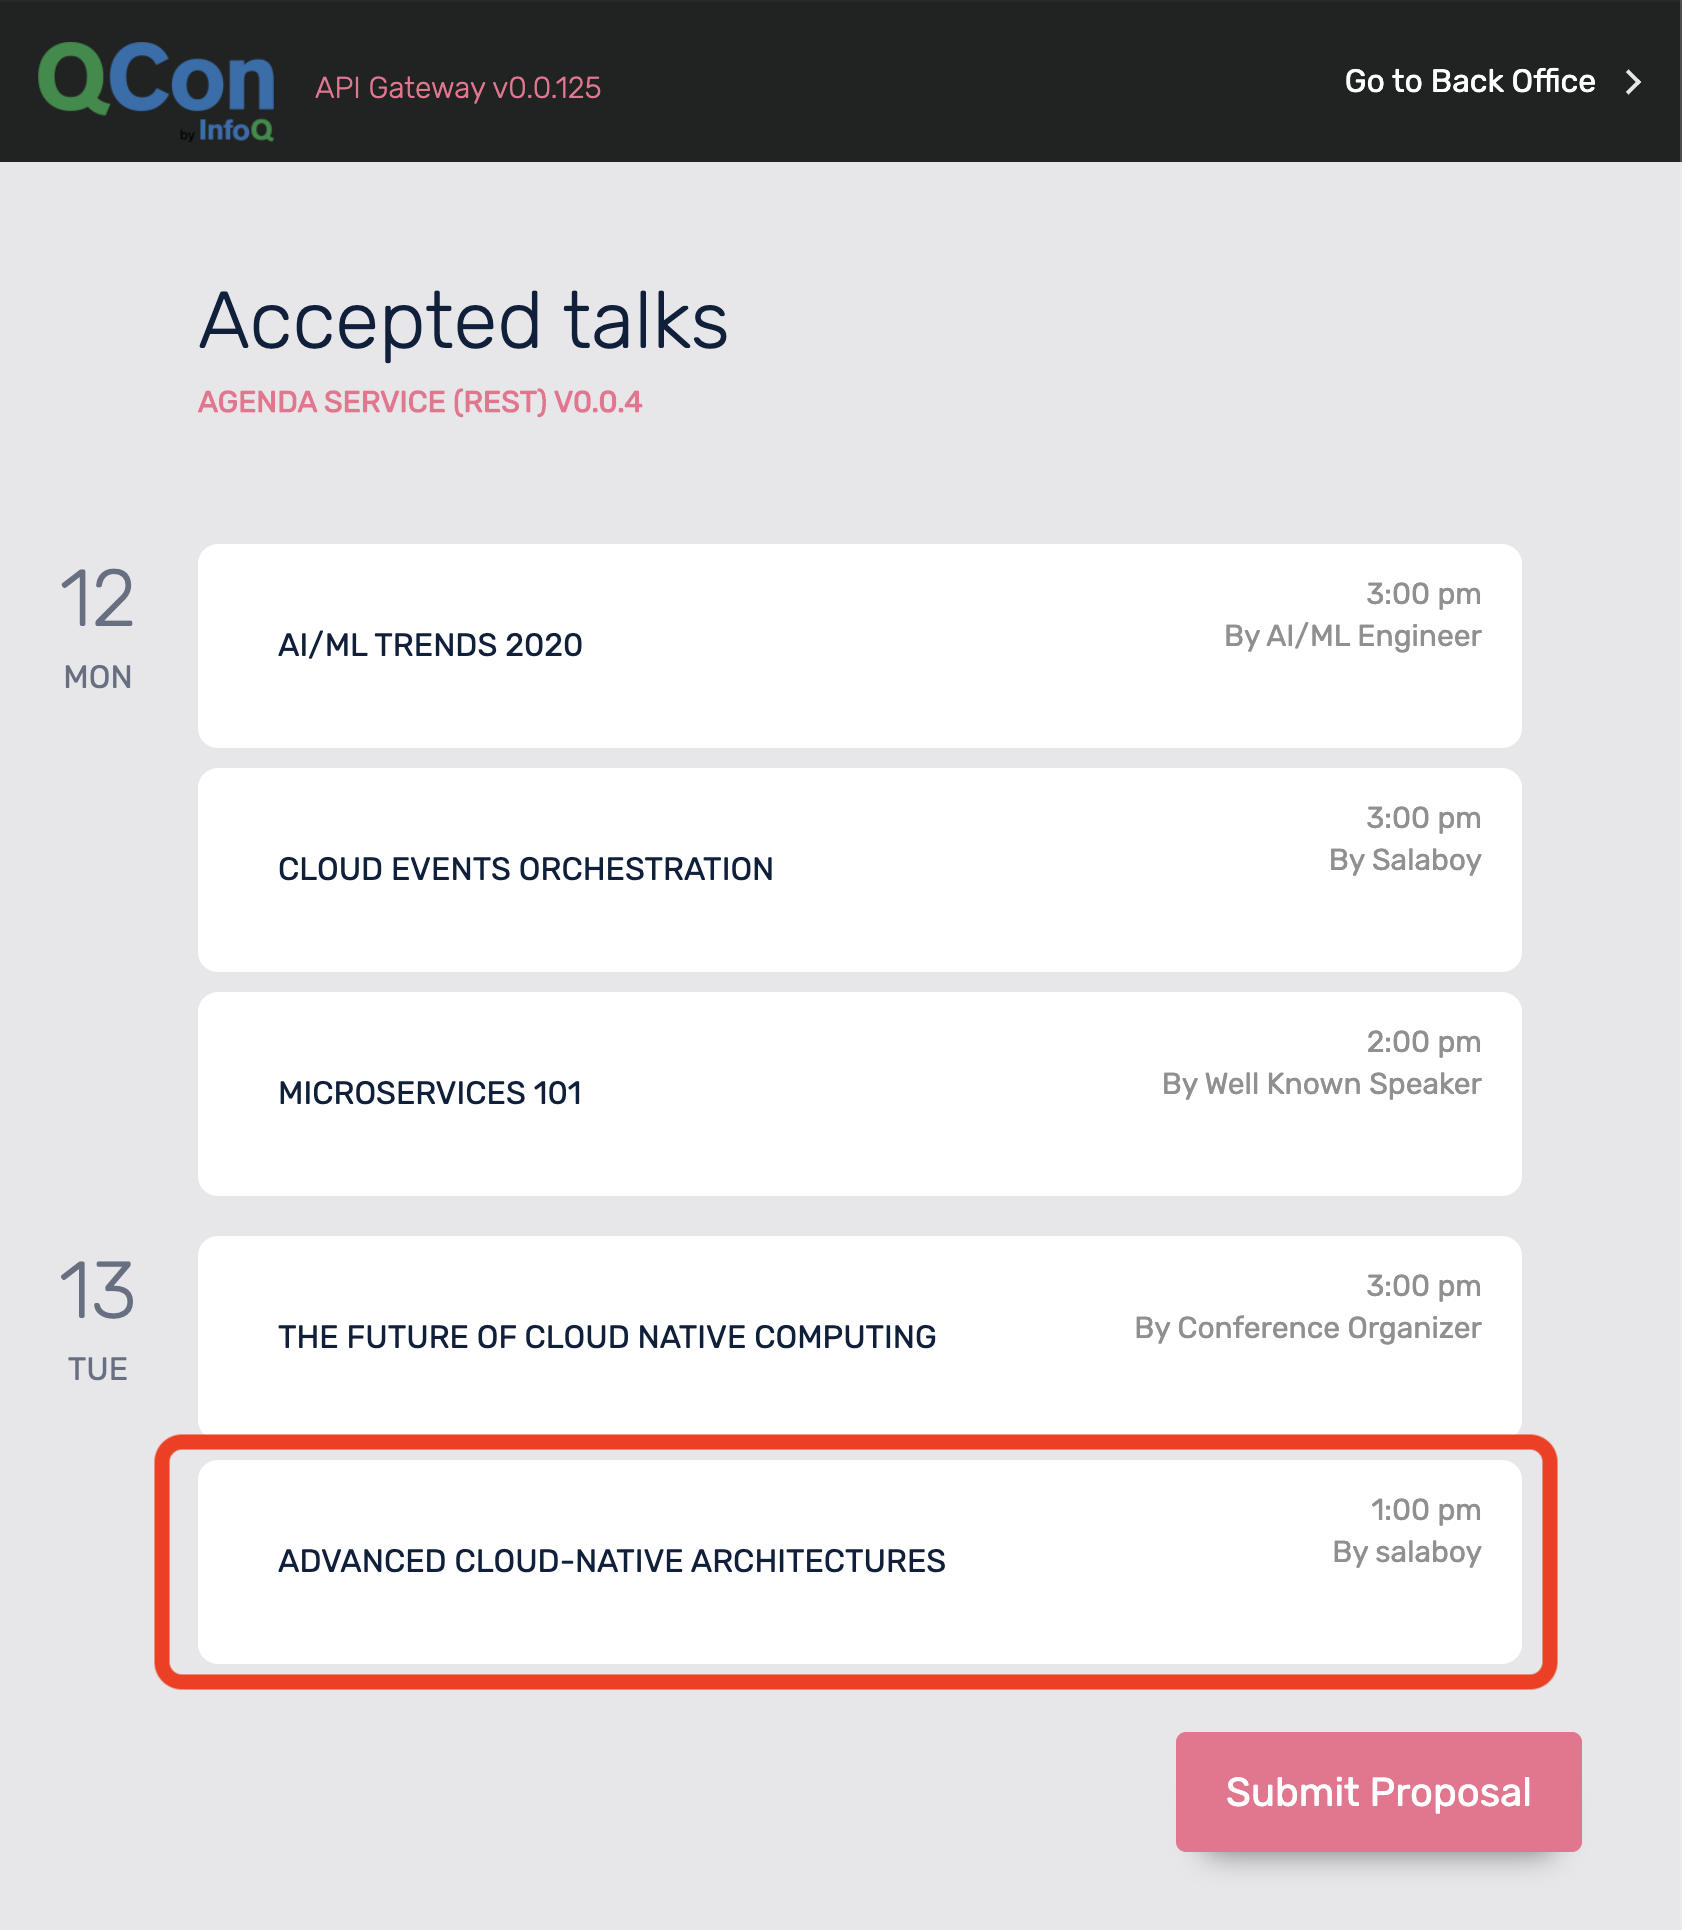
- If you approved the proposal, the proposal should pop up in the Agenda (main page) of the conference.
If you made it this far, you now have a Cloud-Native application running in a Kubernetes Managed service running in the Cloud! 🎉 🎉
Let's take a deeper look on what you just did in this section.
In the previous section you installed an application using Helm.
For this example, there is a parent Helm Chart that contains the configuration for each of the services that compose the application.
You can find each service that is going to be deployed inside the requirements.yaml file defined inside the chart here.
This can be extended to add more components if needed, like for example adding application infrastructure components such as Databases, Message Brokers, ElasticSearch, etc. (Example: ElasticSearch, MongoDB and MySQL, Kafka charts).
The configuration for all these services can be found in the value.yaml file here. This values.yaml file can be overriden as well as any of the settings from each specific service when installing the chart, allowing the chart to be flexible enough to be installed with different setups.
There are a couple of configurations to highlight for this version which are:
- Knative Deployments are enabled, each service Helm Chart enable us to define if we want to use a Knative Service or a Deployment + Service + Ingress type of deployment. Because we have Knative installed, and you will be using Knative Eventing later on, we enabled in the chart configuration the Knative Deployment.
- Because we are using Knative Services a second container (
queue-proxy) is boostrapped as a side-car to your main container which is hosting the service. This is the reason why you see2/2in theREADYcolumn when you list your pods. This is also the reason why you need to specifyuser-containerwhen you runk logs POD, as the logs command needs to know which container inside the pod you want to tail the logs. - Both the
C4Pservice and theAPI Gatewayservice need to know where the other services are to be able to send requests. If you are using Kubernetes Services instead of Knative Services the namin for the services changes a bit. Notice that here for Knative we are using<Service Name>.default.svc.cluster.local. In this first version of the applicationfmtok8s-appall the interactions between the services happen via REST calls. This push the caller to know the other services names.
You can open different tabs in Cloud Shell to inspect the logs of each service when you are using the application (submitting and approving/rejecting proposals). Remember that you can do that by listing the pods with k get pods and then k logs -f <POD ID> user-container
This section covers some of the challenges that you might face when working with these kind of applications inside Kubernetes. This section is not needed to continue with the workshop, but it highlight the need for some other tools to be used in conjuction with the application.
To see more details about the challenges Click to Expand
Among some of the challenges that you might face are the following big topics:
- Flow buried in code and visibility for non-technical users: for this scenario the
C4Pservice is hosting the core business logic on how to handle new proposals. If you need to explain to non-technical people how the flow goes, you will need to dig in the code to be 100% sure about what the application is doing. Non-technical users will never sure about how their applications are working, as they can only have limited visibility of what is going on. How would you solve the visibility challenge? - Edge Cases and Errors: This simple example, shows what is usually called the happy path, where all things goes as expected. In real life implementations, the amount of steps that happens to deal with complex scenarios grows. If you want to cover and have visibility on all possible edge cases and how the organization deals with logical errors that might happen in real life situations, it is key to document and expose this information not only to technical users. How would you document and keep track of every possible edge case and errors that can happen in your distributed applications? How would you do that for a monolith application?
- Dealing with changes: for an organization, being able to understand how their applications are working today, compared on how they were working yesterday is vital for communication, in some cases for compliance and of course to make sure that different deparments are in sync. The faster that you want to go with microservices, the more you need to look outside the development departments to apply changes into the production environments. You will need tools to make sure that everyone is in the same page when changes are introduced. How do you deal with changes today in your applications? How do you expose to non-technical users the differences between the current version of your application that is running in production compared with the new one that you want to promote?
- Implementing Time-Based Actions/Notifications: I dare to say that about 99% of applications require some kind of notification mechanism that needs to deal with scheduled actions at some point in the future or require to be triggered every X amount of time. When working with distributed system, this is painful, as you will need a distributed scheduler to guarantee that things scheduled to trigger are actually triggered when the time is right. How would you implement these time based behaviours? If you are thinking about Kubernetes Cron Jobs that is definitely a wrong answer.
- Reporting and Analytics: if you look at how the services of applications are storing data, you will find out that the structures used are not optimized for reporting or doing analytics. A common approach, is to push the infomration that is relevant to create reports or to do analytics to ElasticSearch where data can be indexed and structured for efficient querying. Are you using ElasticSearch or a similar solution for building reports or running analytics?
In version 2 of the application you will be working to make your application's internals more visibile to non-technical users.
You will now undeploy version 1 of the application to deploy version 2. You only need to undeploy version 1 to save resources. In order to undeploy version 1 of the application you can run:
h delete fmtok8s --no-hooksVersion 2 of the application is configured to emit CloudEvents, whenever something relevant happens in any of the services. For this example, you are interested in the following events:
Proposal ReceivedProposal Decision MadeEmail Sent- In the case of the proposal being approved
Agenda Item Created
The main goal for Version 2 is to visualize what is happening inside your Cloud-Native appliction from a Business Perspective. You will achieve that by emitting relevant CloudEvents from the backend services to a Knative Eventing Broker, which you installed before, that can be used as a router to redirect events to Camunda Cloud (an external service that you will use to correlated and monitor these events).
Version 2 of the application still uses the same version of the services found in Version 1, but these services are configured to emit events to a Knative Broker that was created when you installed Knative. This Knative Broker, receive events and routed them to whoever is interested in them. In order to register interest in certain events, Knative allows you to create Triggers (which are like subscriptions with filters) for this events and specify where these events should be sent.
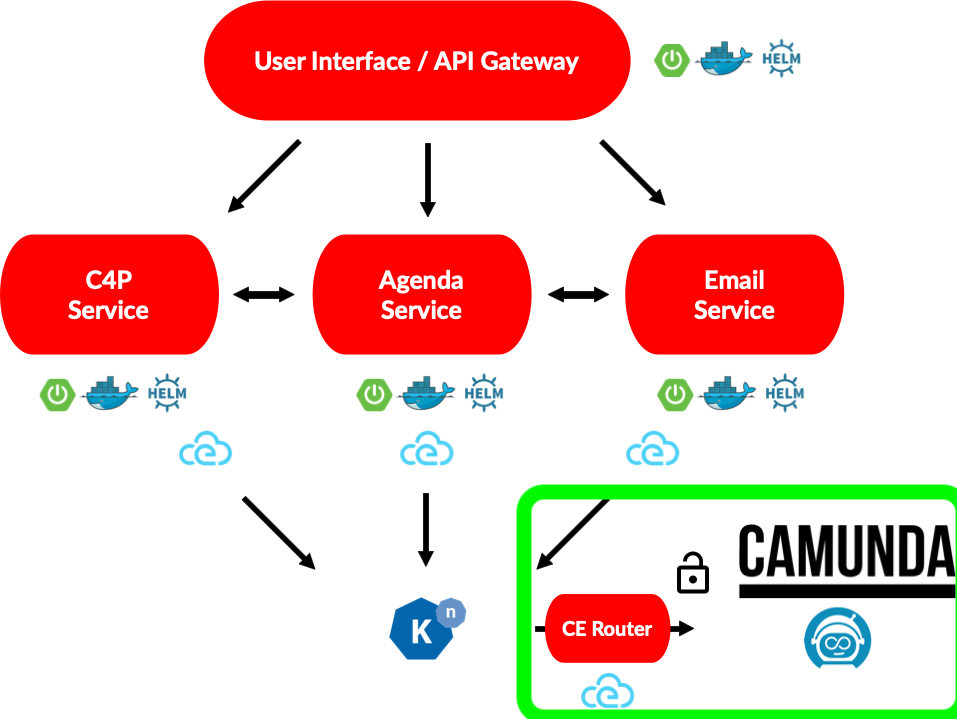
For Version 2, you will use the Zeebe Workflow Engine provisioned in your Camunda Cloud account to capture and visualize these meaninful events. In order to route these CloudEvents from the Knative Broker to Camunda Cloud a new component is introduced along your Application services. This new component is called Zeebe CloudEvents Router and serves as the bridge between Knative and Camunda Cloud, using CloudEvents as the standardize communication protocol.
As you can imagine, in order for the Zeebe CloudEvents Router to connect with your Camunda Cloud Zeebe Cluster you need to create a new Client, a set of credentials which allows these components to connect and communicate.
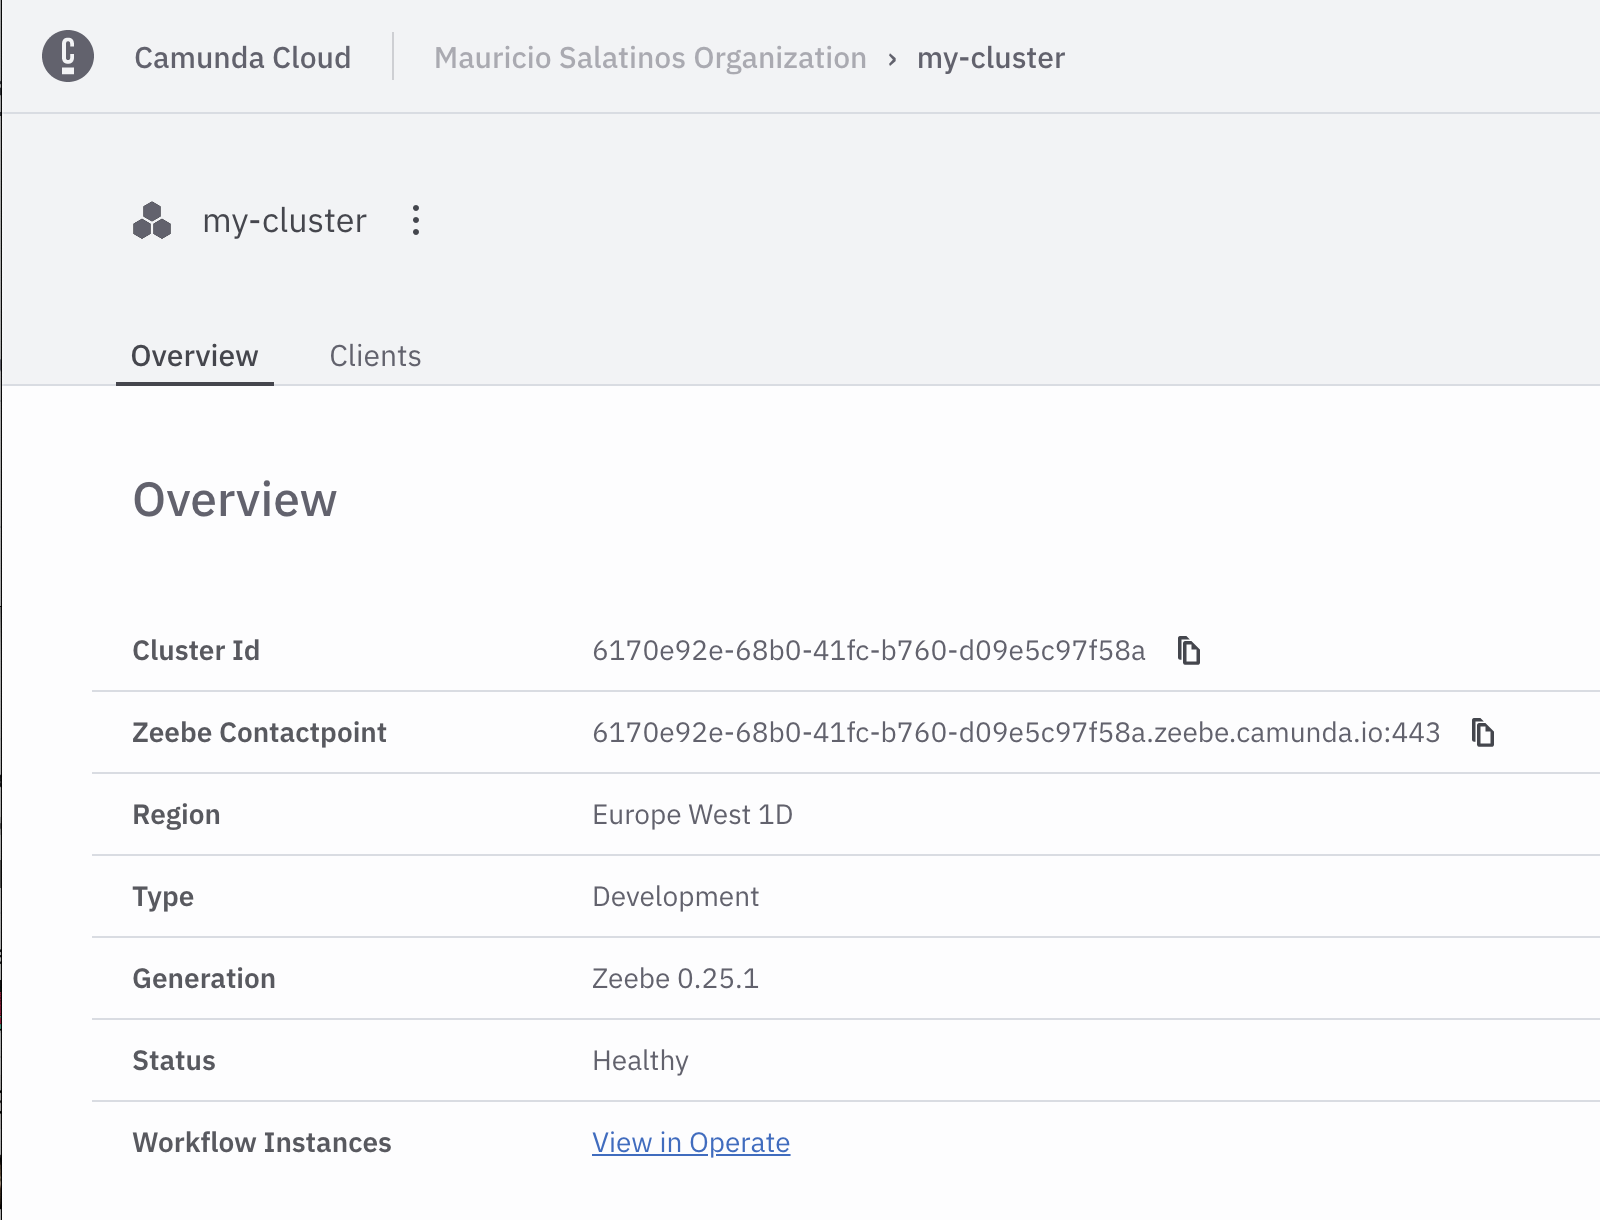
Go to the Camunda Cloud console, click on your cluster to see your cluster details:
Go to the Clients tab and then Create a New Client:
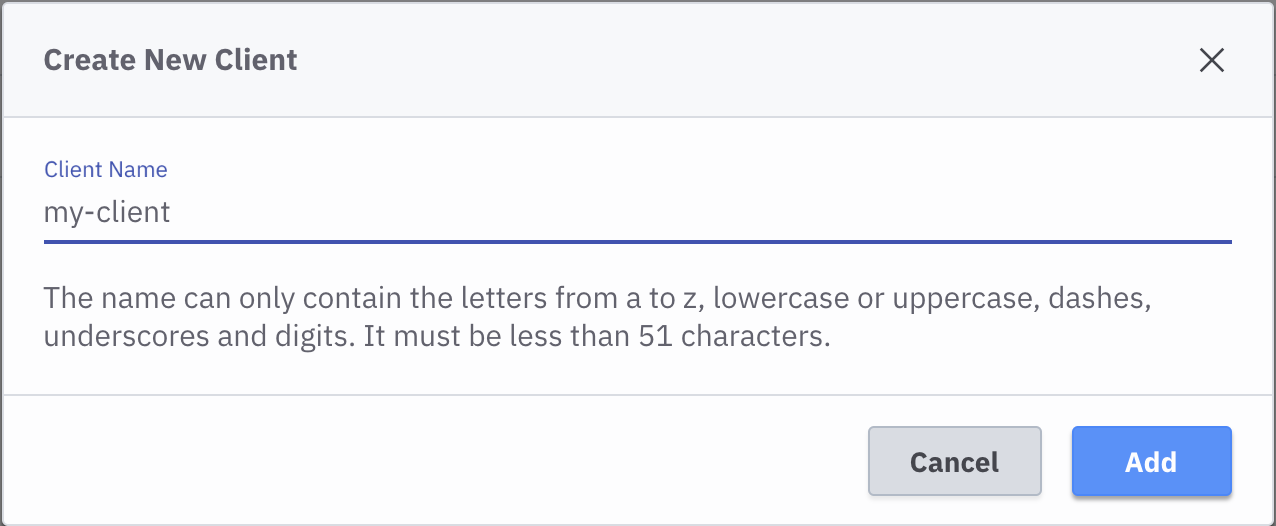
Call it my-client and click Add:
The new client called my-client will be created:
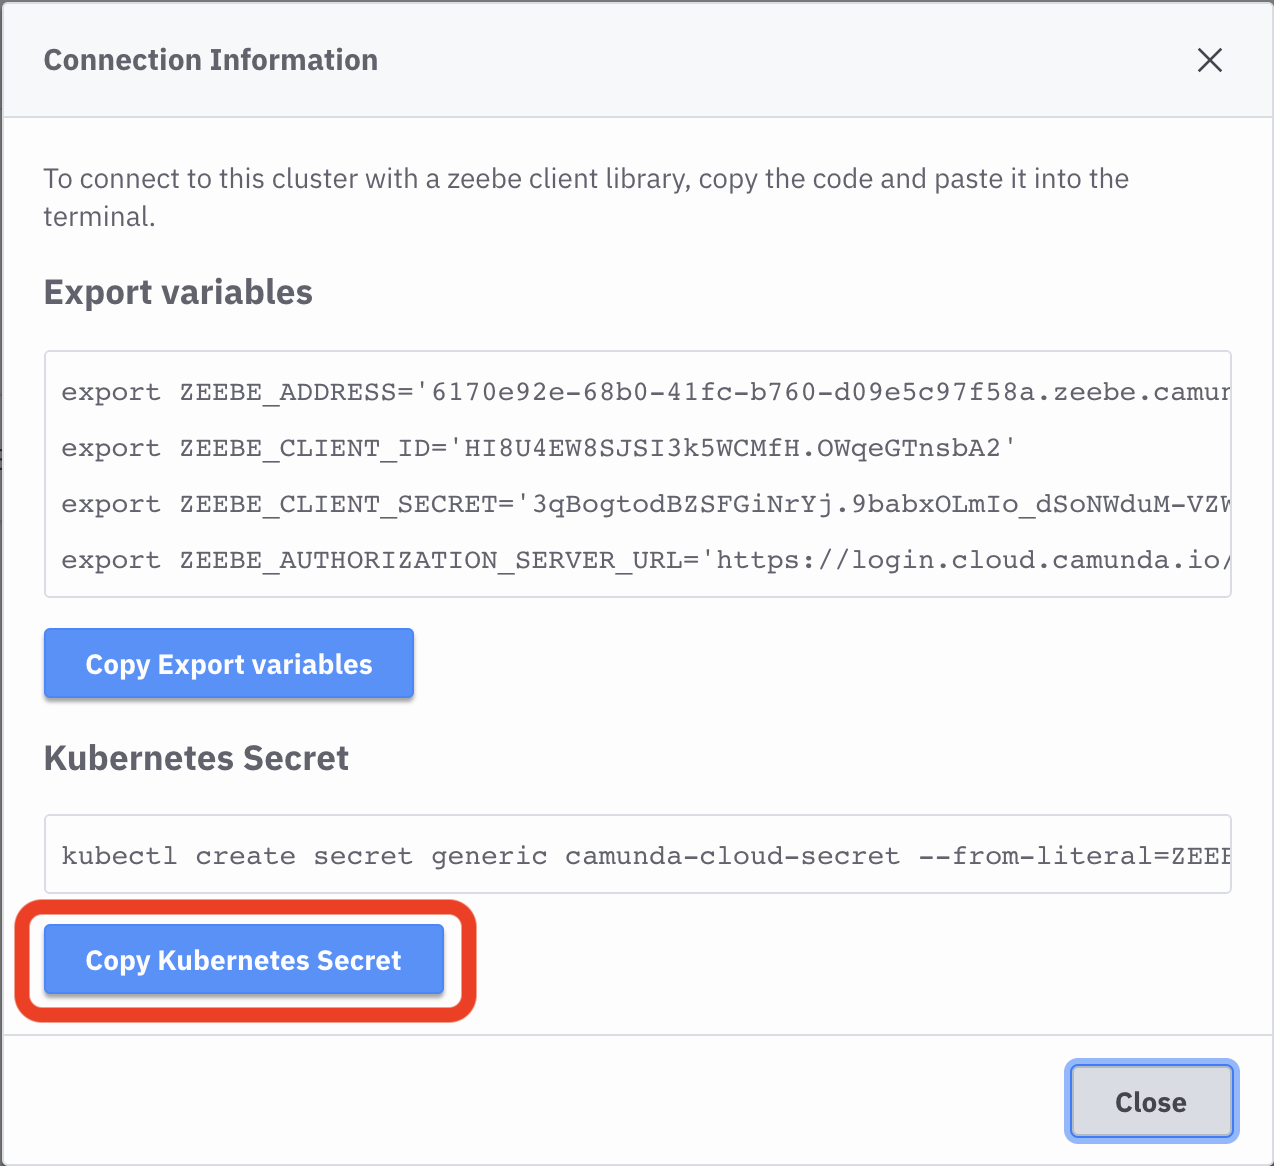
Now you can access the Connection Information:
By clicking the button Copy Kubernetes Secret the command will be copied into your clipboard and you can paste it inside Cloud Shell inside Google Cloud.
k create secret generic camunda-cloud-secret --from-literal=ZEEBE_ADDRESS=...By running the previous command, you have created a new Kubernetes Secret that host the credentials for our applications to talk to Camunda Cloud.
Now you are ready to install version 2 of the application by running (again ignore the warnings):
h install fmtok8s-v2 workshop/fmtok8s-app-v2You can check that all the services are up and running with the same two commands as before:
k get podsand
k get ksvcYou should see something like this:
Notice that now the Zeebe CloudEvents Router is running along side the application services, and it is configured to use the Kubernetes Secret that was previously created to connect to Camunda Cloud.
But here is still one missing piece to route the CloudEvents generated by your application services to the Zeebe CloudEvents Router and those are the Knative Triggers (Subscriptions to route the events from the broker to wherever you want).
These Knative Triggers are defined in YAML and can be packaged inside the Application V2 Helm Chart, which means that they are installed as part of the application. You can find the triggers definitions here.
You can list these Knative Triggers by running the following command:
k get triggersYou should see an output like this:
Finally, even when CloudEvents are being routed to Camunda Cloud, you need to create a model that will consume the events that are coming from the application, so they can be correlated and visualized.
You can download the models that you will be using in the next steps from here.
Once you downloaded the models, extract the ZIP file a place that you can quickly locate to upload these files in the next steps.
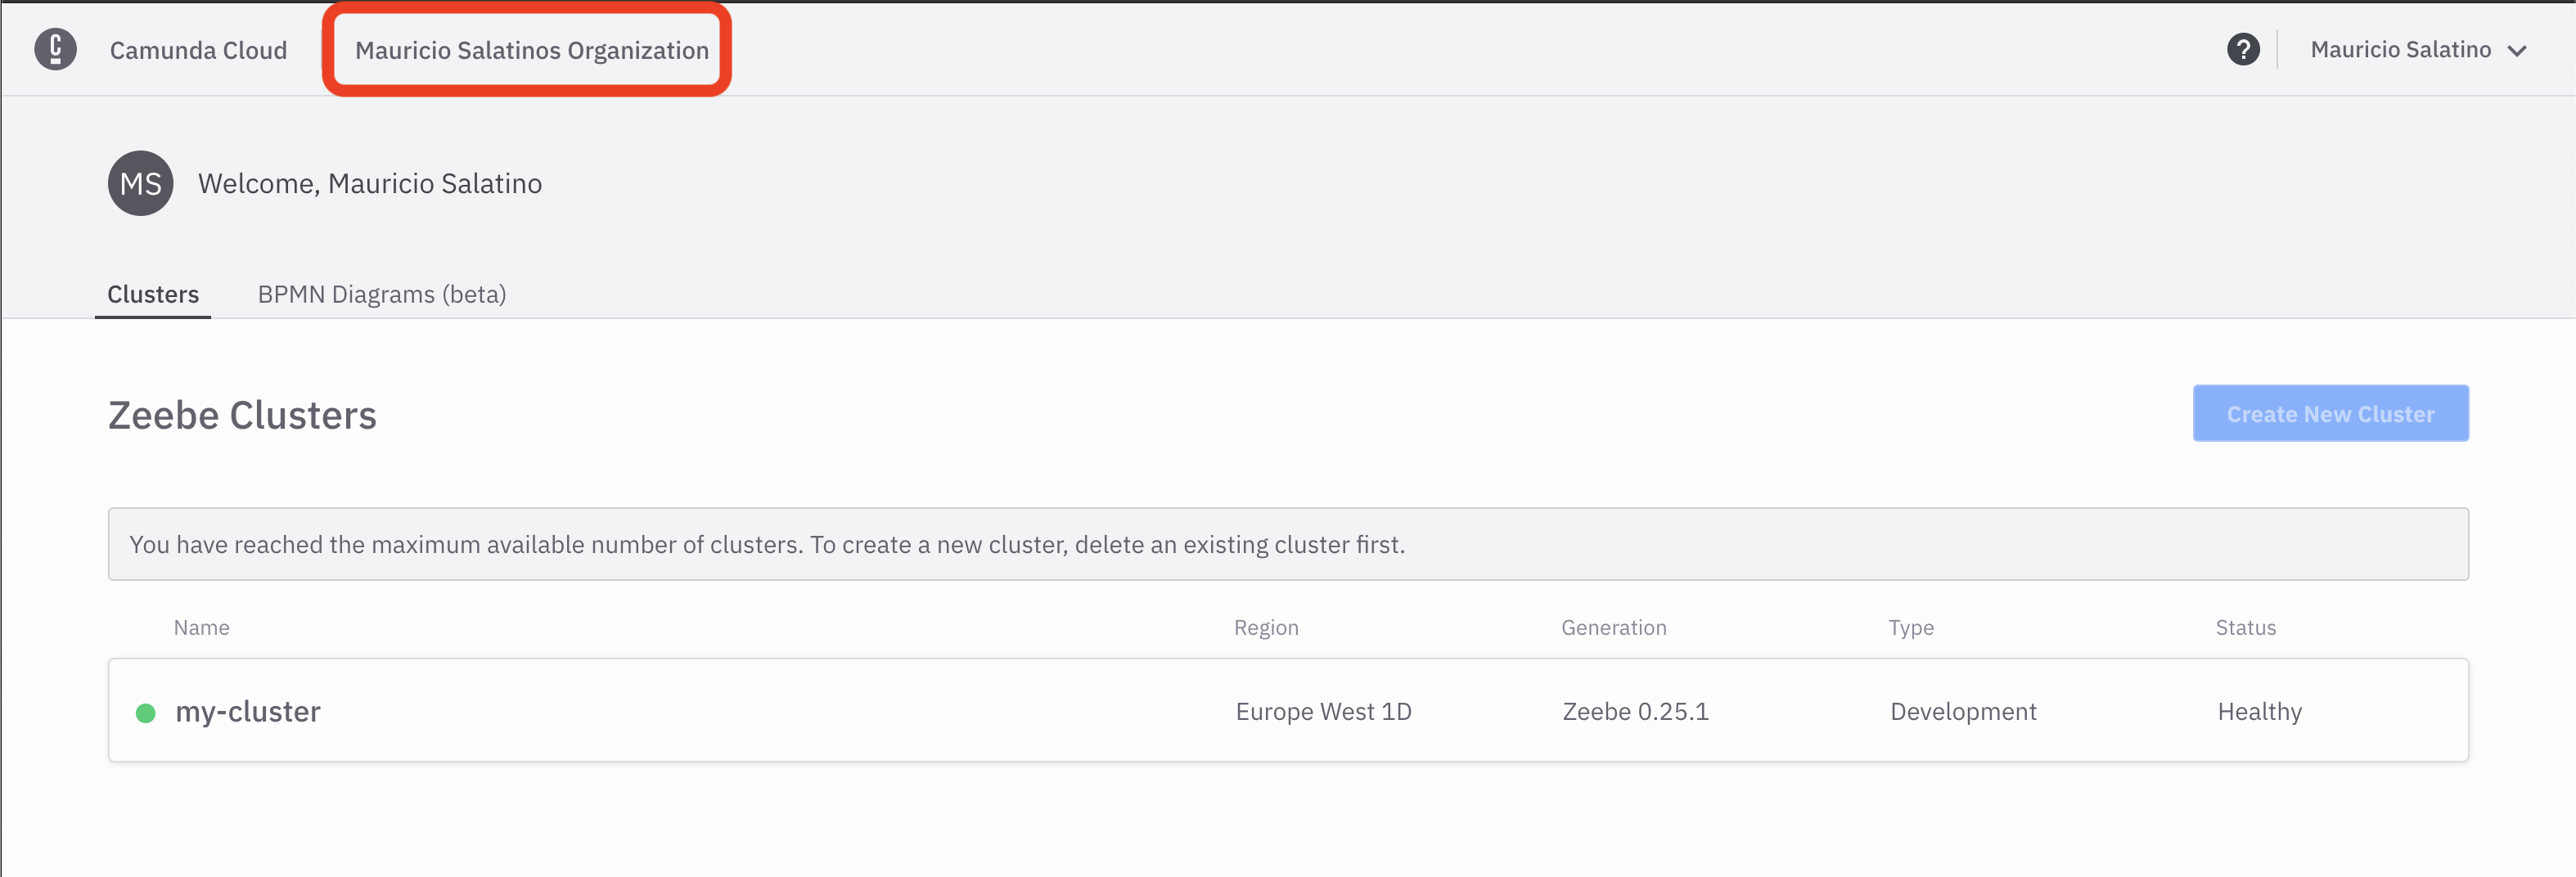
Now, go back to your Camunda Cloud Zeebe Cluster list (you can do this by clicking in the top breadcrum with the name of your Organization):
Next, click on the BPMN Diagrams(beta) Tab, then click Create New Diagram:
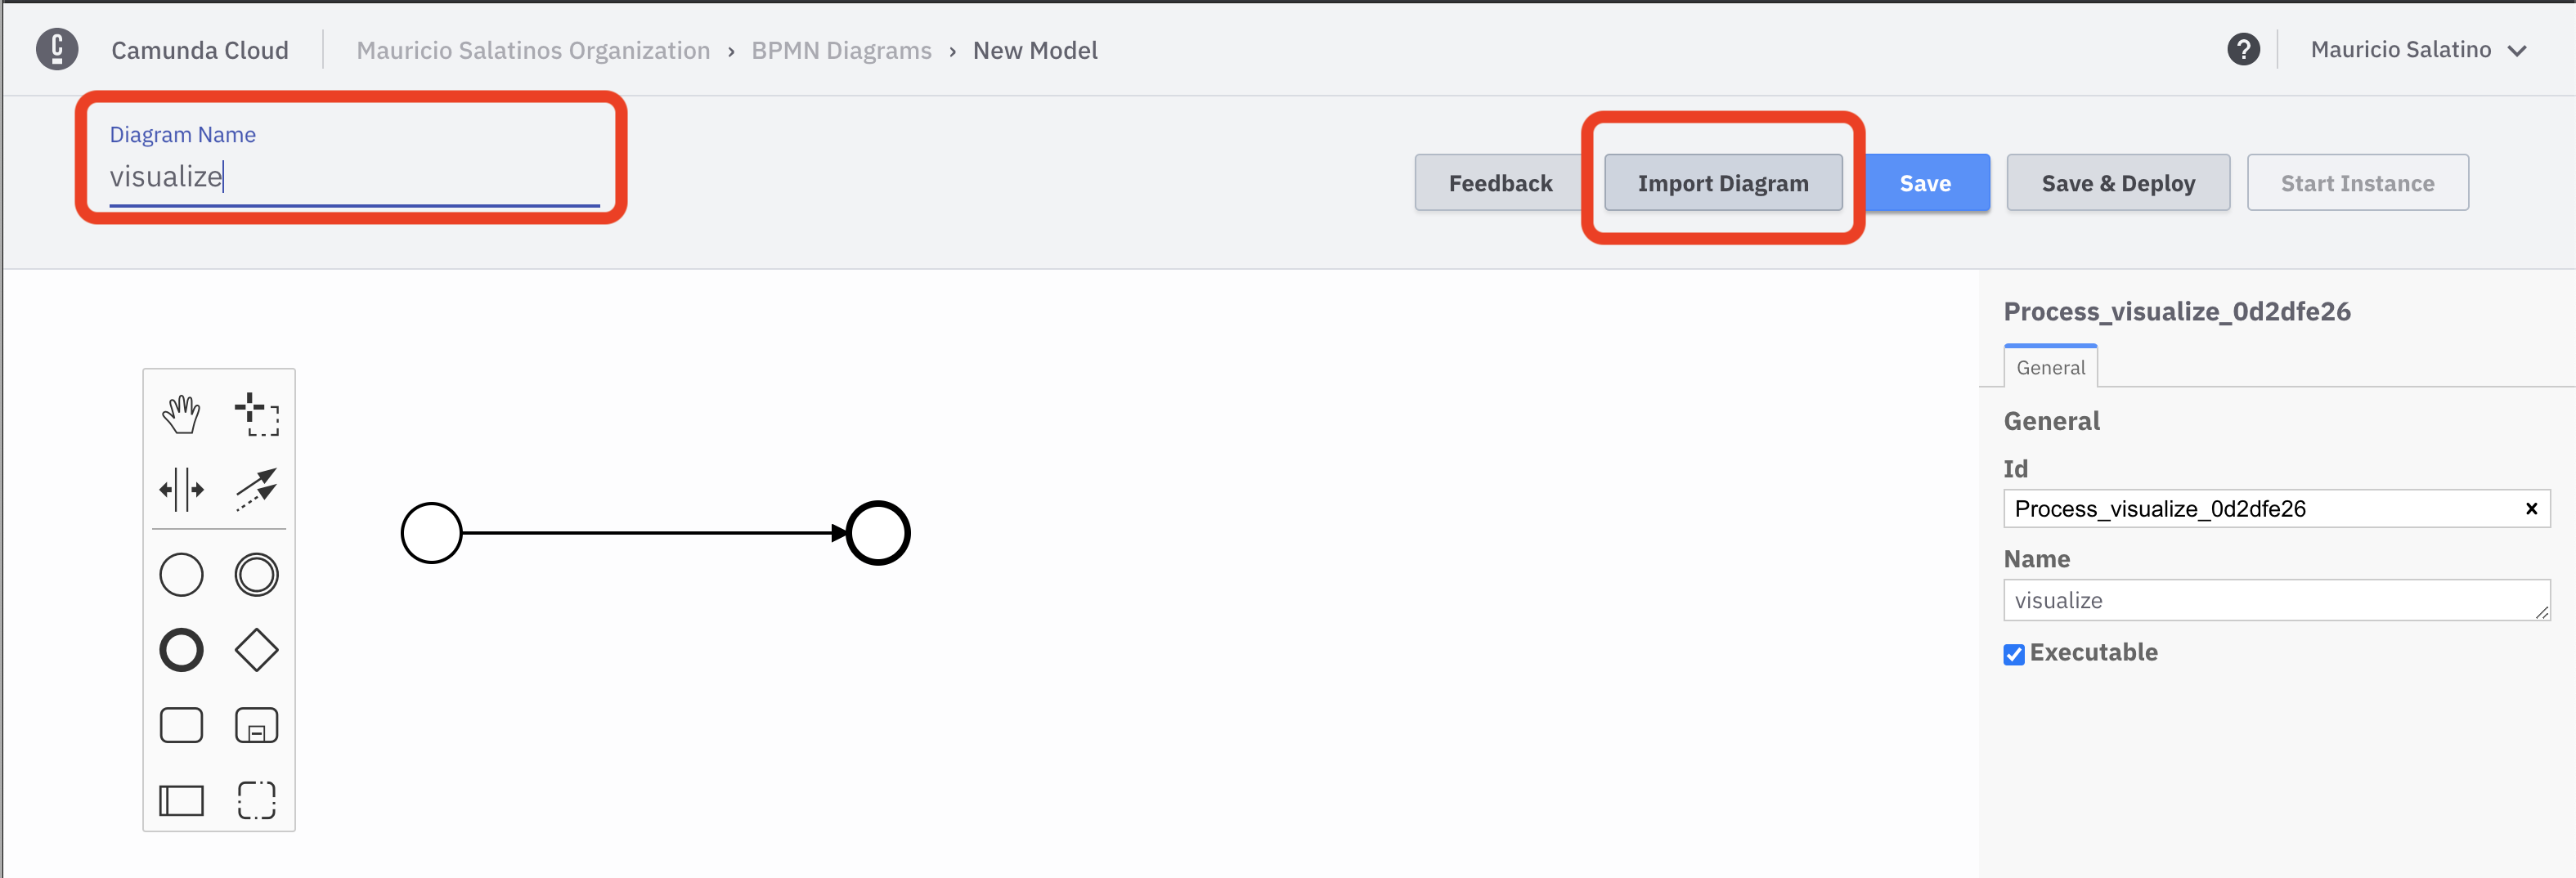
With the Diagram editor opened, first enter the name visualize into the diagram name box and then click the Import Diagram button:
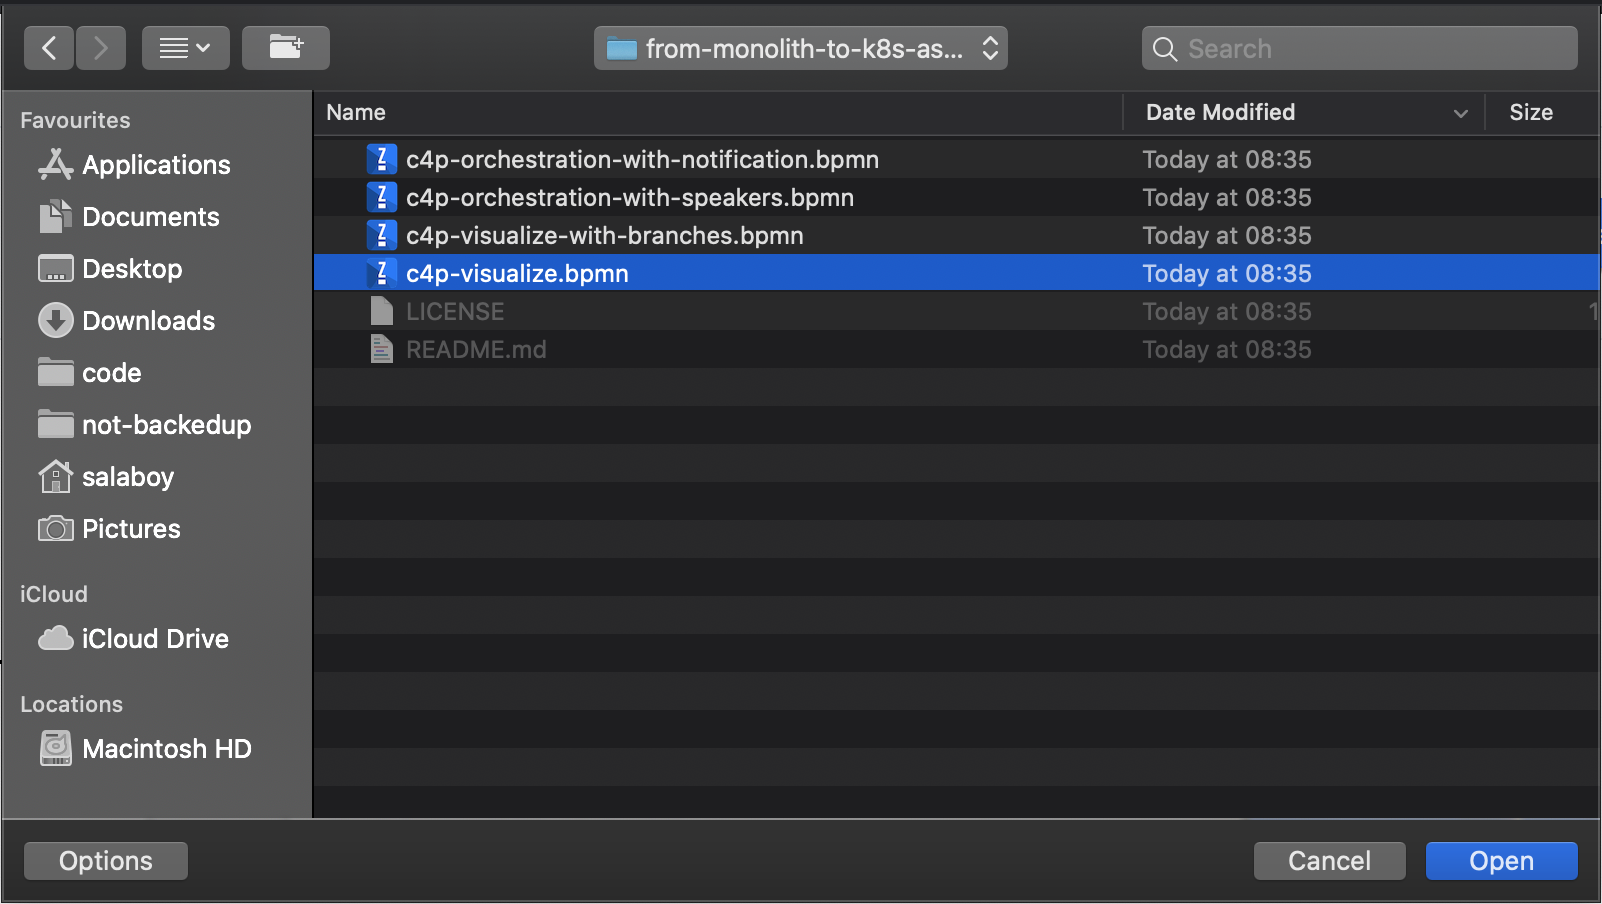
Now choose c4p-visualize.bpmn from your filesystem:
The diagram shoud look like:
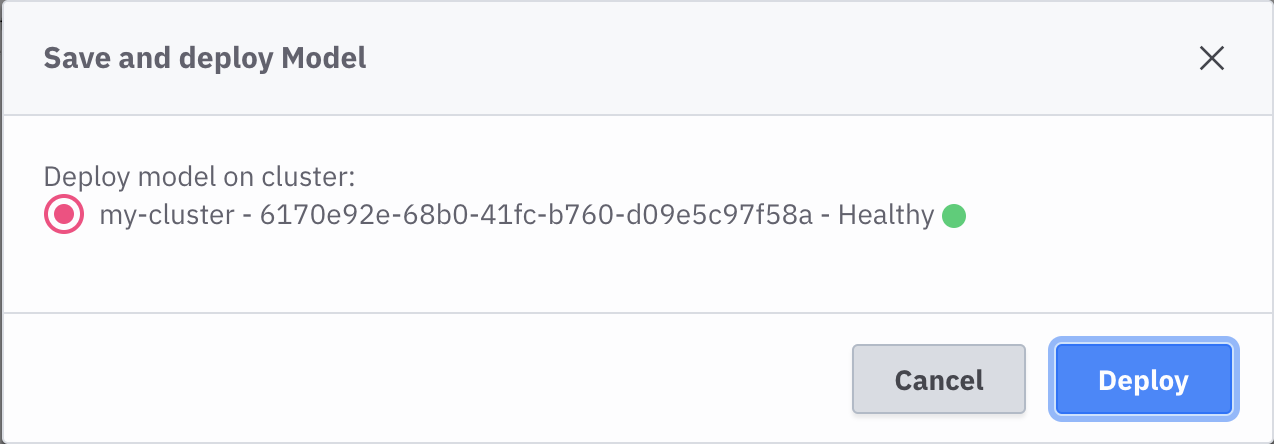
With the Diagram ready, you can now hit Save and Deploy:
Next, close/disregard the popup suggesting to start a new instance:
Well Done! you made it, now everything is setup for routing and fowarding events from our application, to Knative Eventing, to the Zeebe CloudEvents Router to Camunda Cloud.
In order to see how this is actually working you can use Camunda Operate, a dashboard included inside Camunda Cloud which allows you to understand how these models are being executed, where things are at a giving time and to troubleshoot errors that might arise from your applications daily operations.
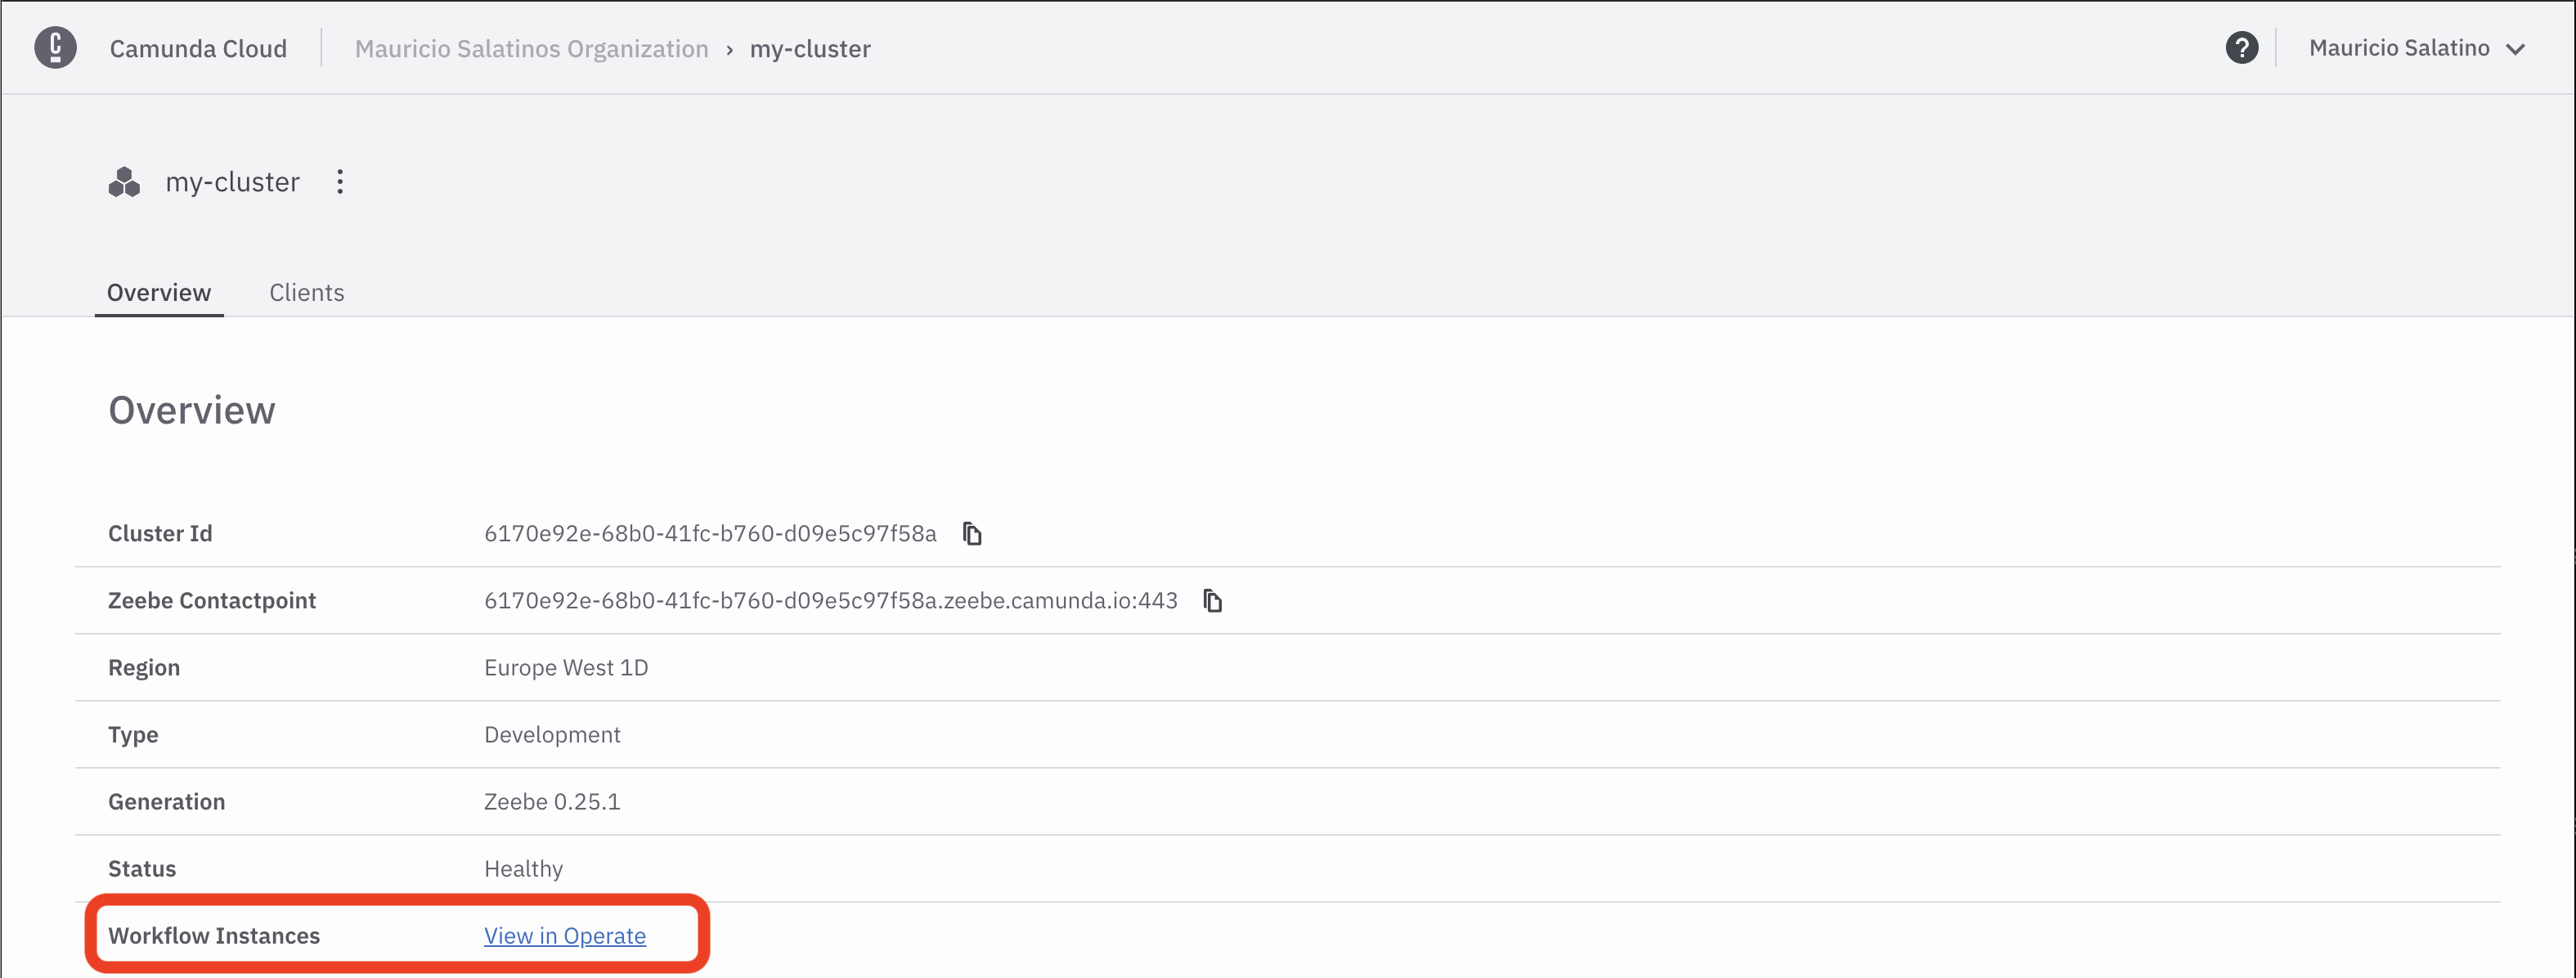
You can access Camunda Operate from your cluster details, inside the Overview Tab, at the bottom, clicking in the View in Operate link:
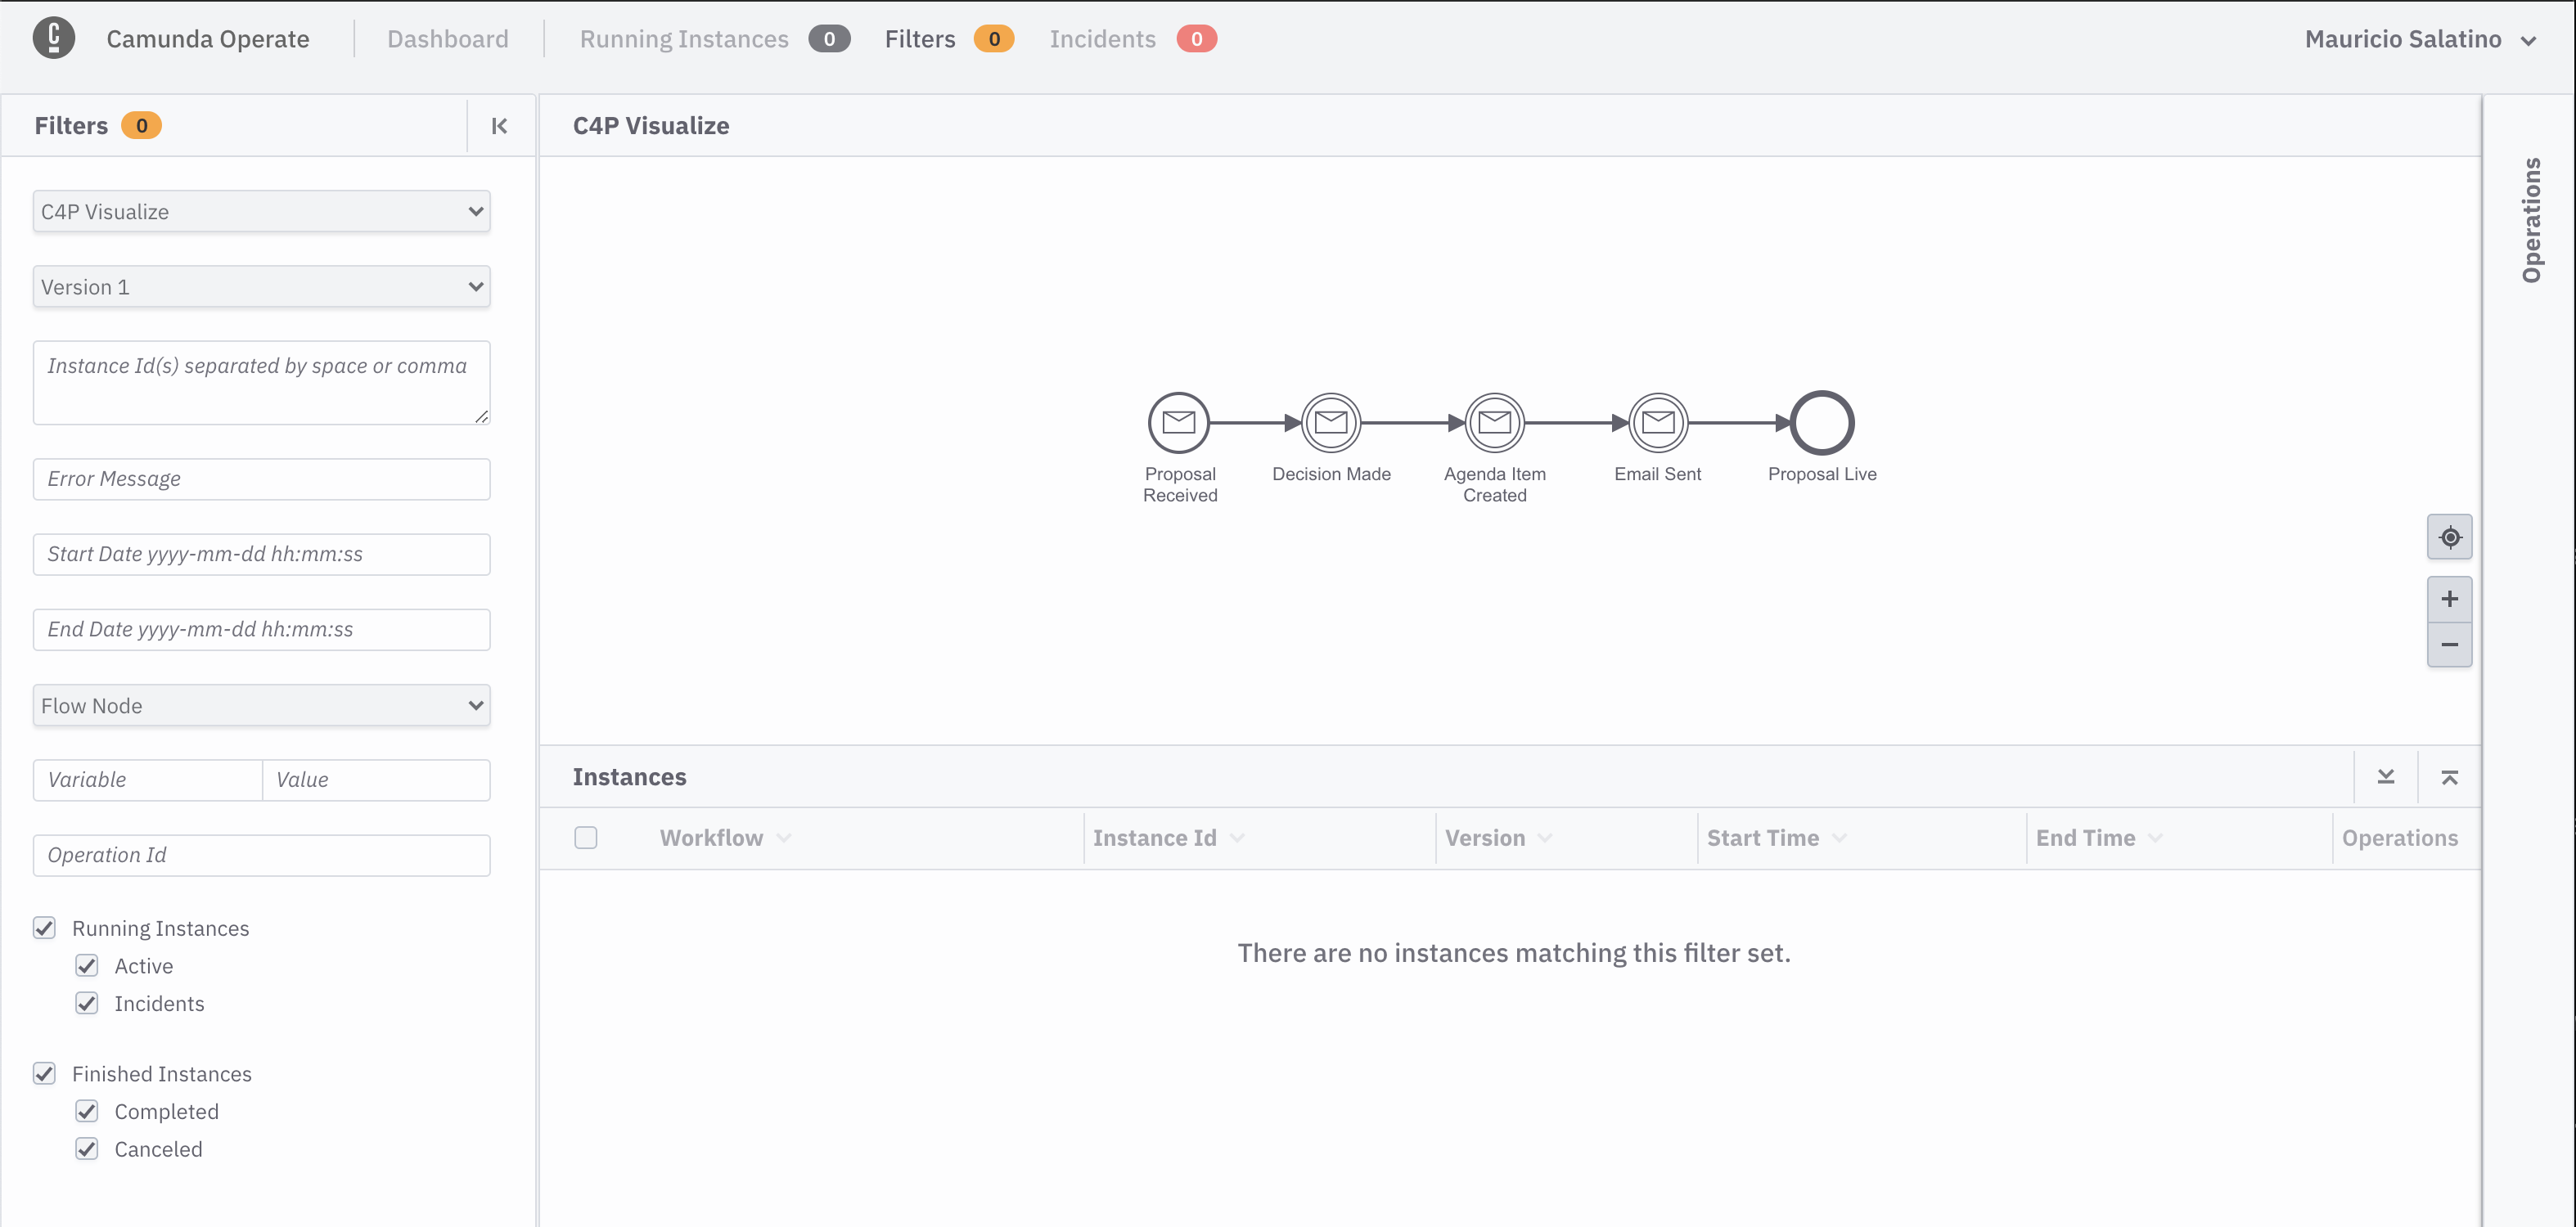
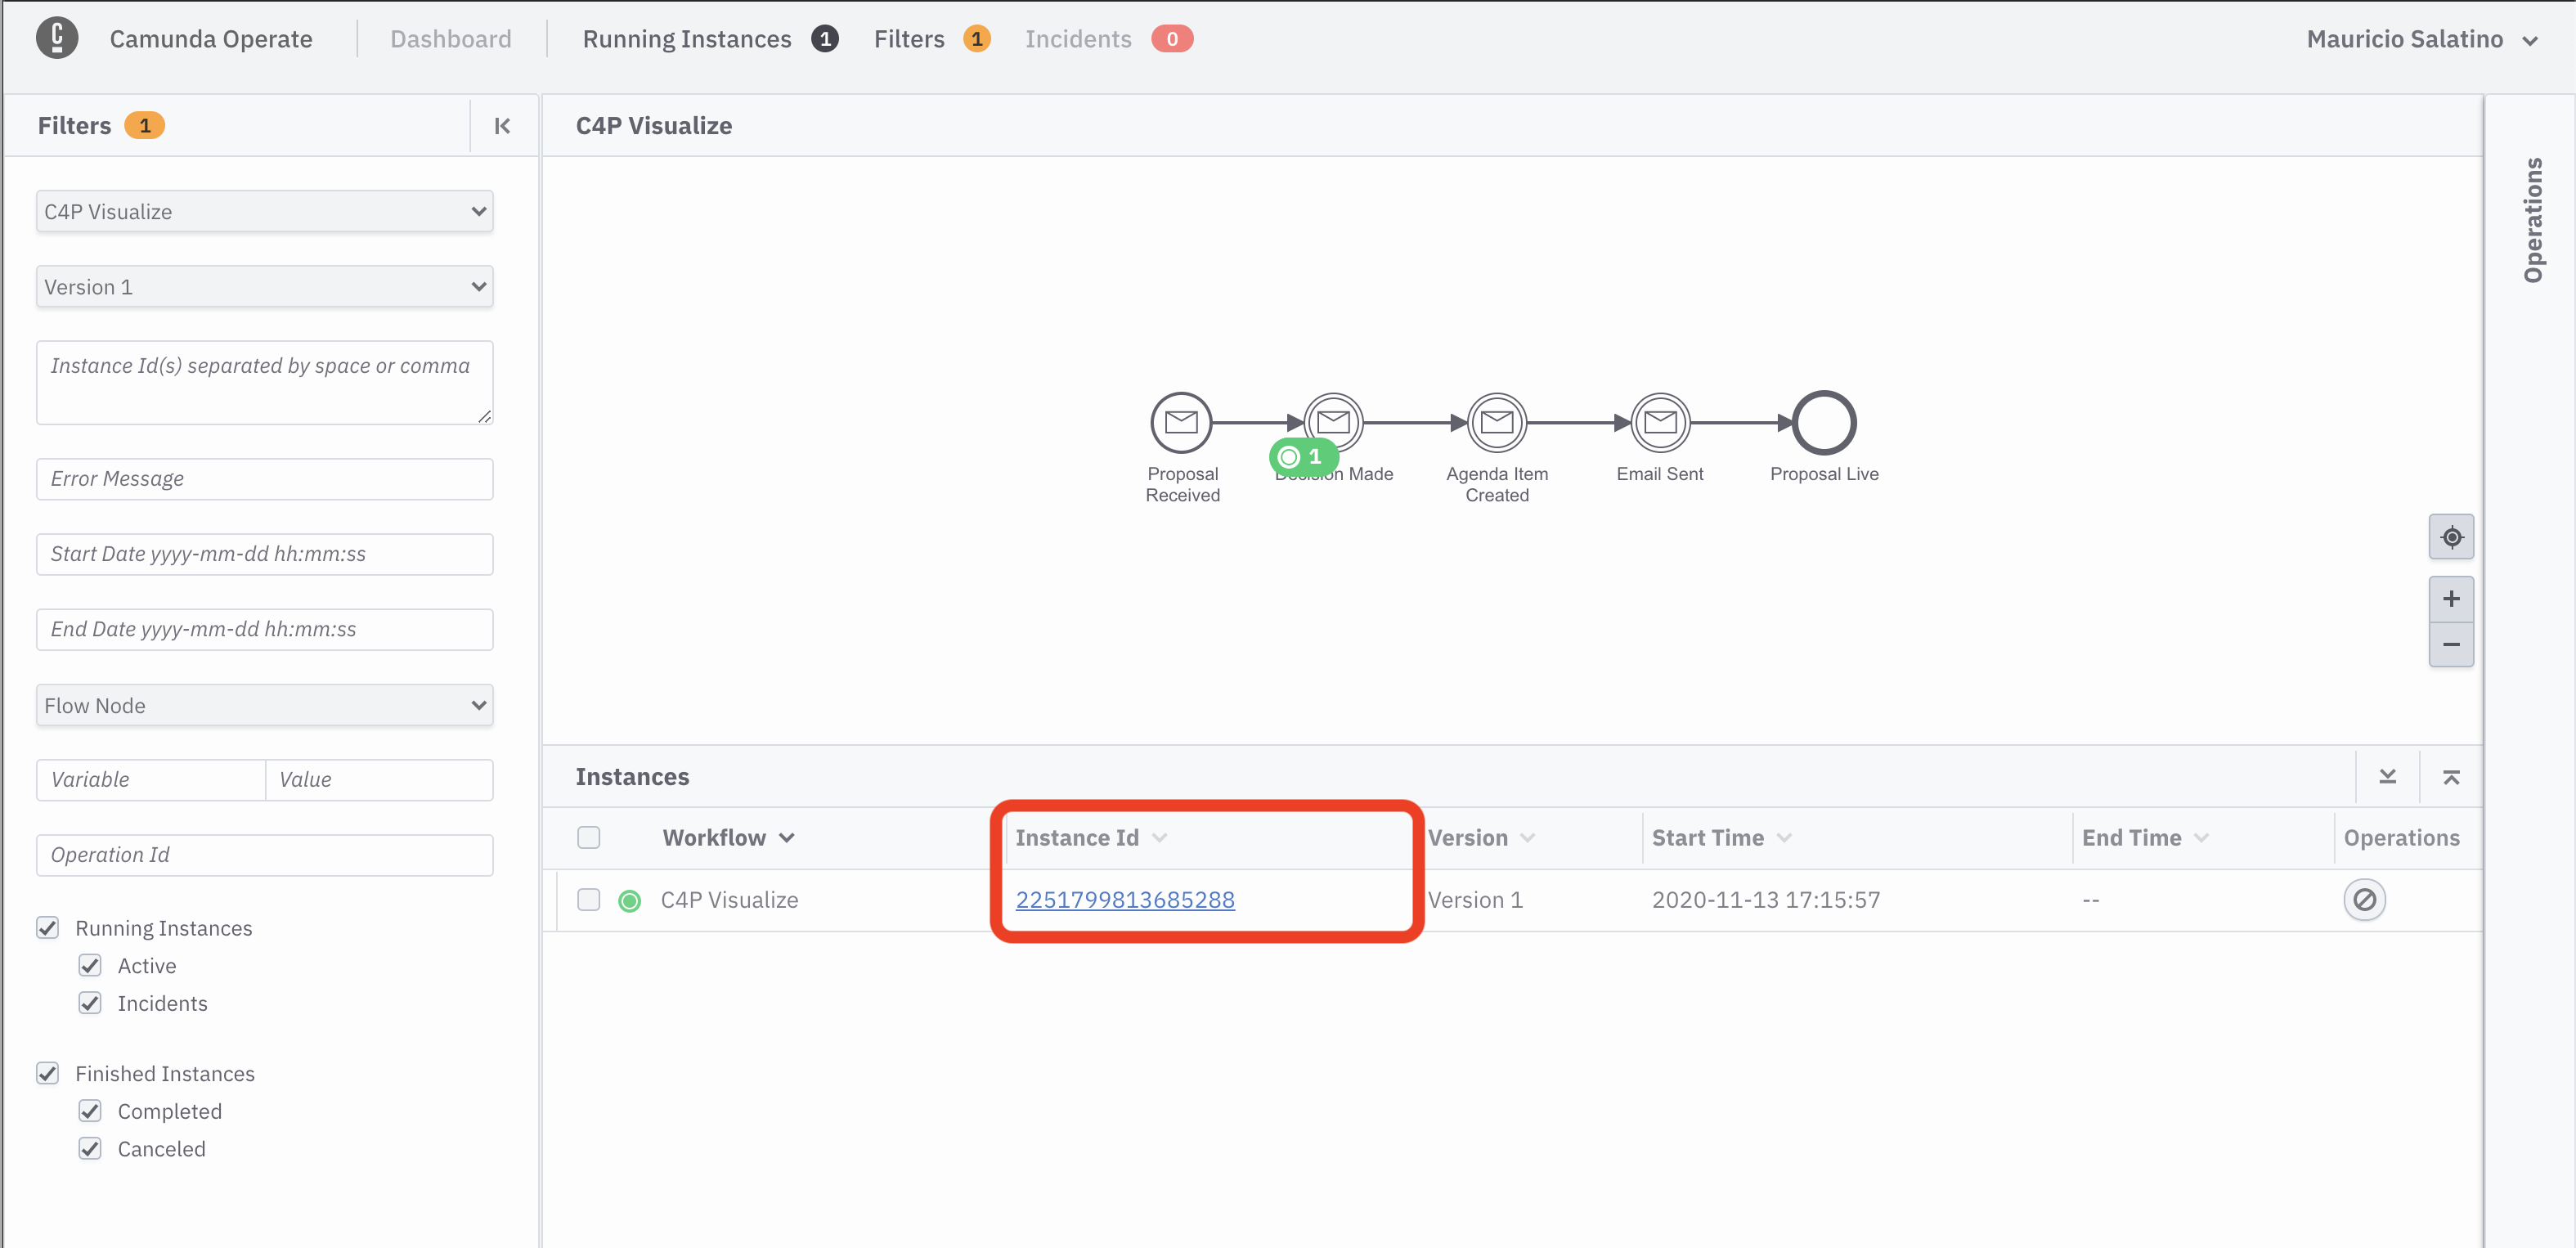
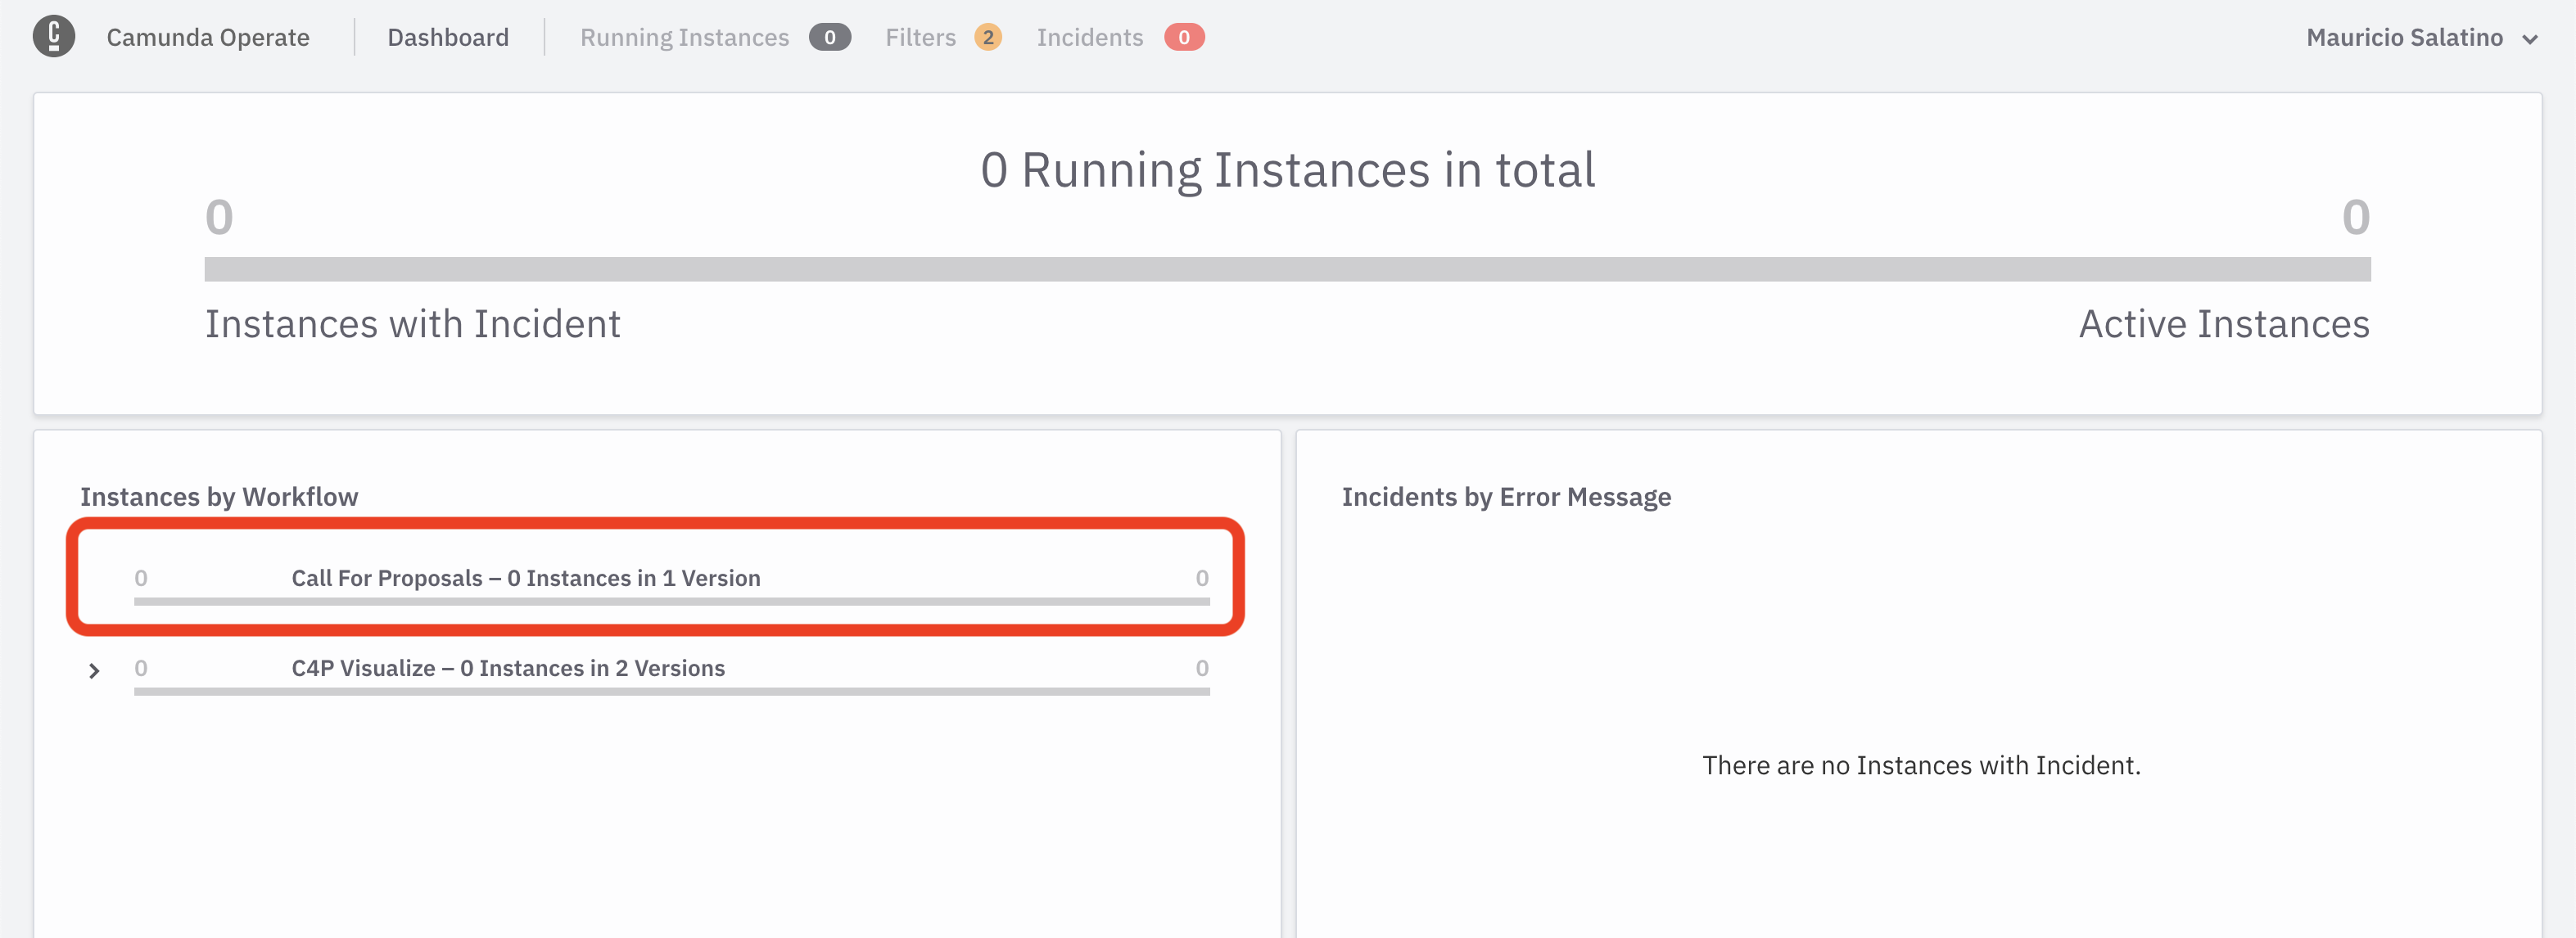
You should see the Camunda Operate main screen, where you can click in the C4P Visualize section highlighted in the screenshot below:
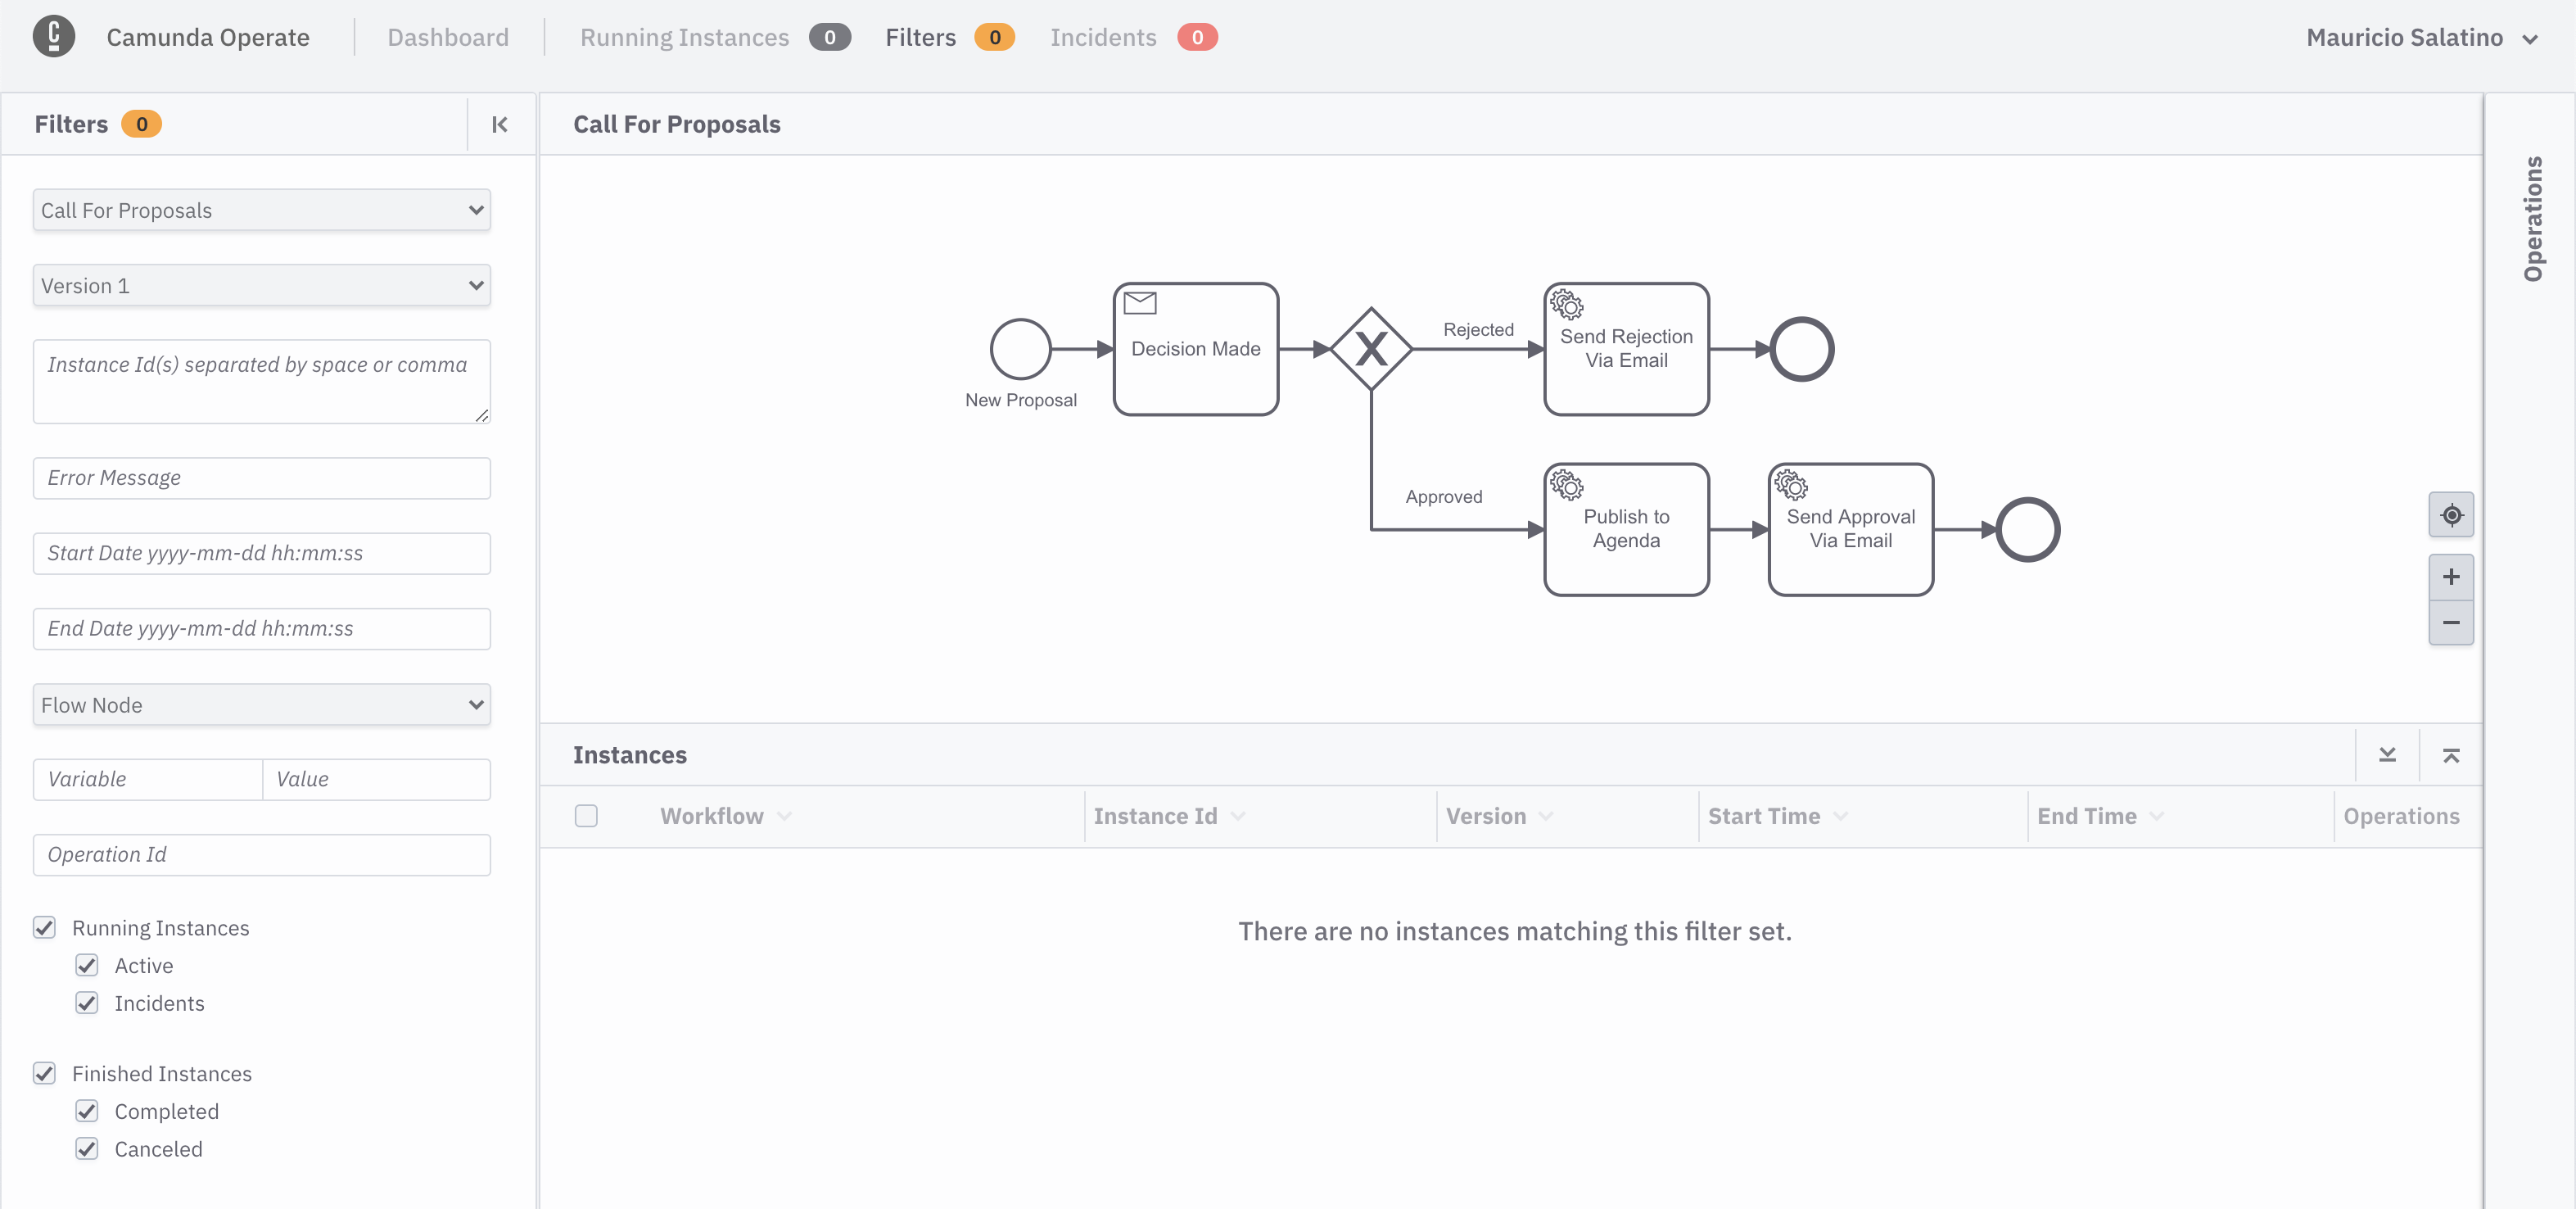
This opens the runtime data associated with our workflow models, now you should see this:
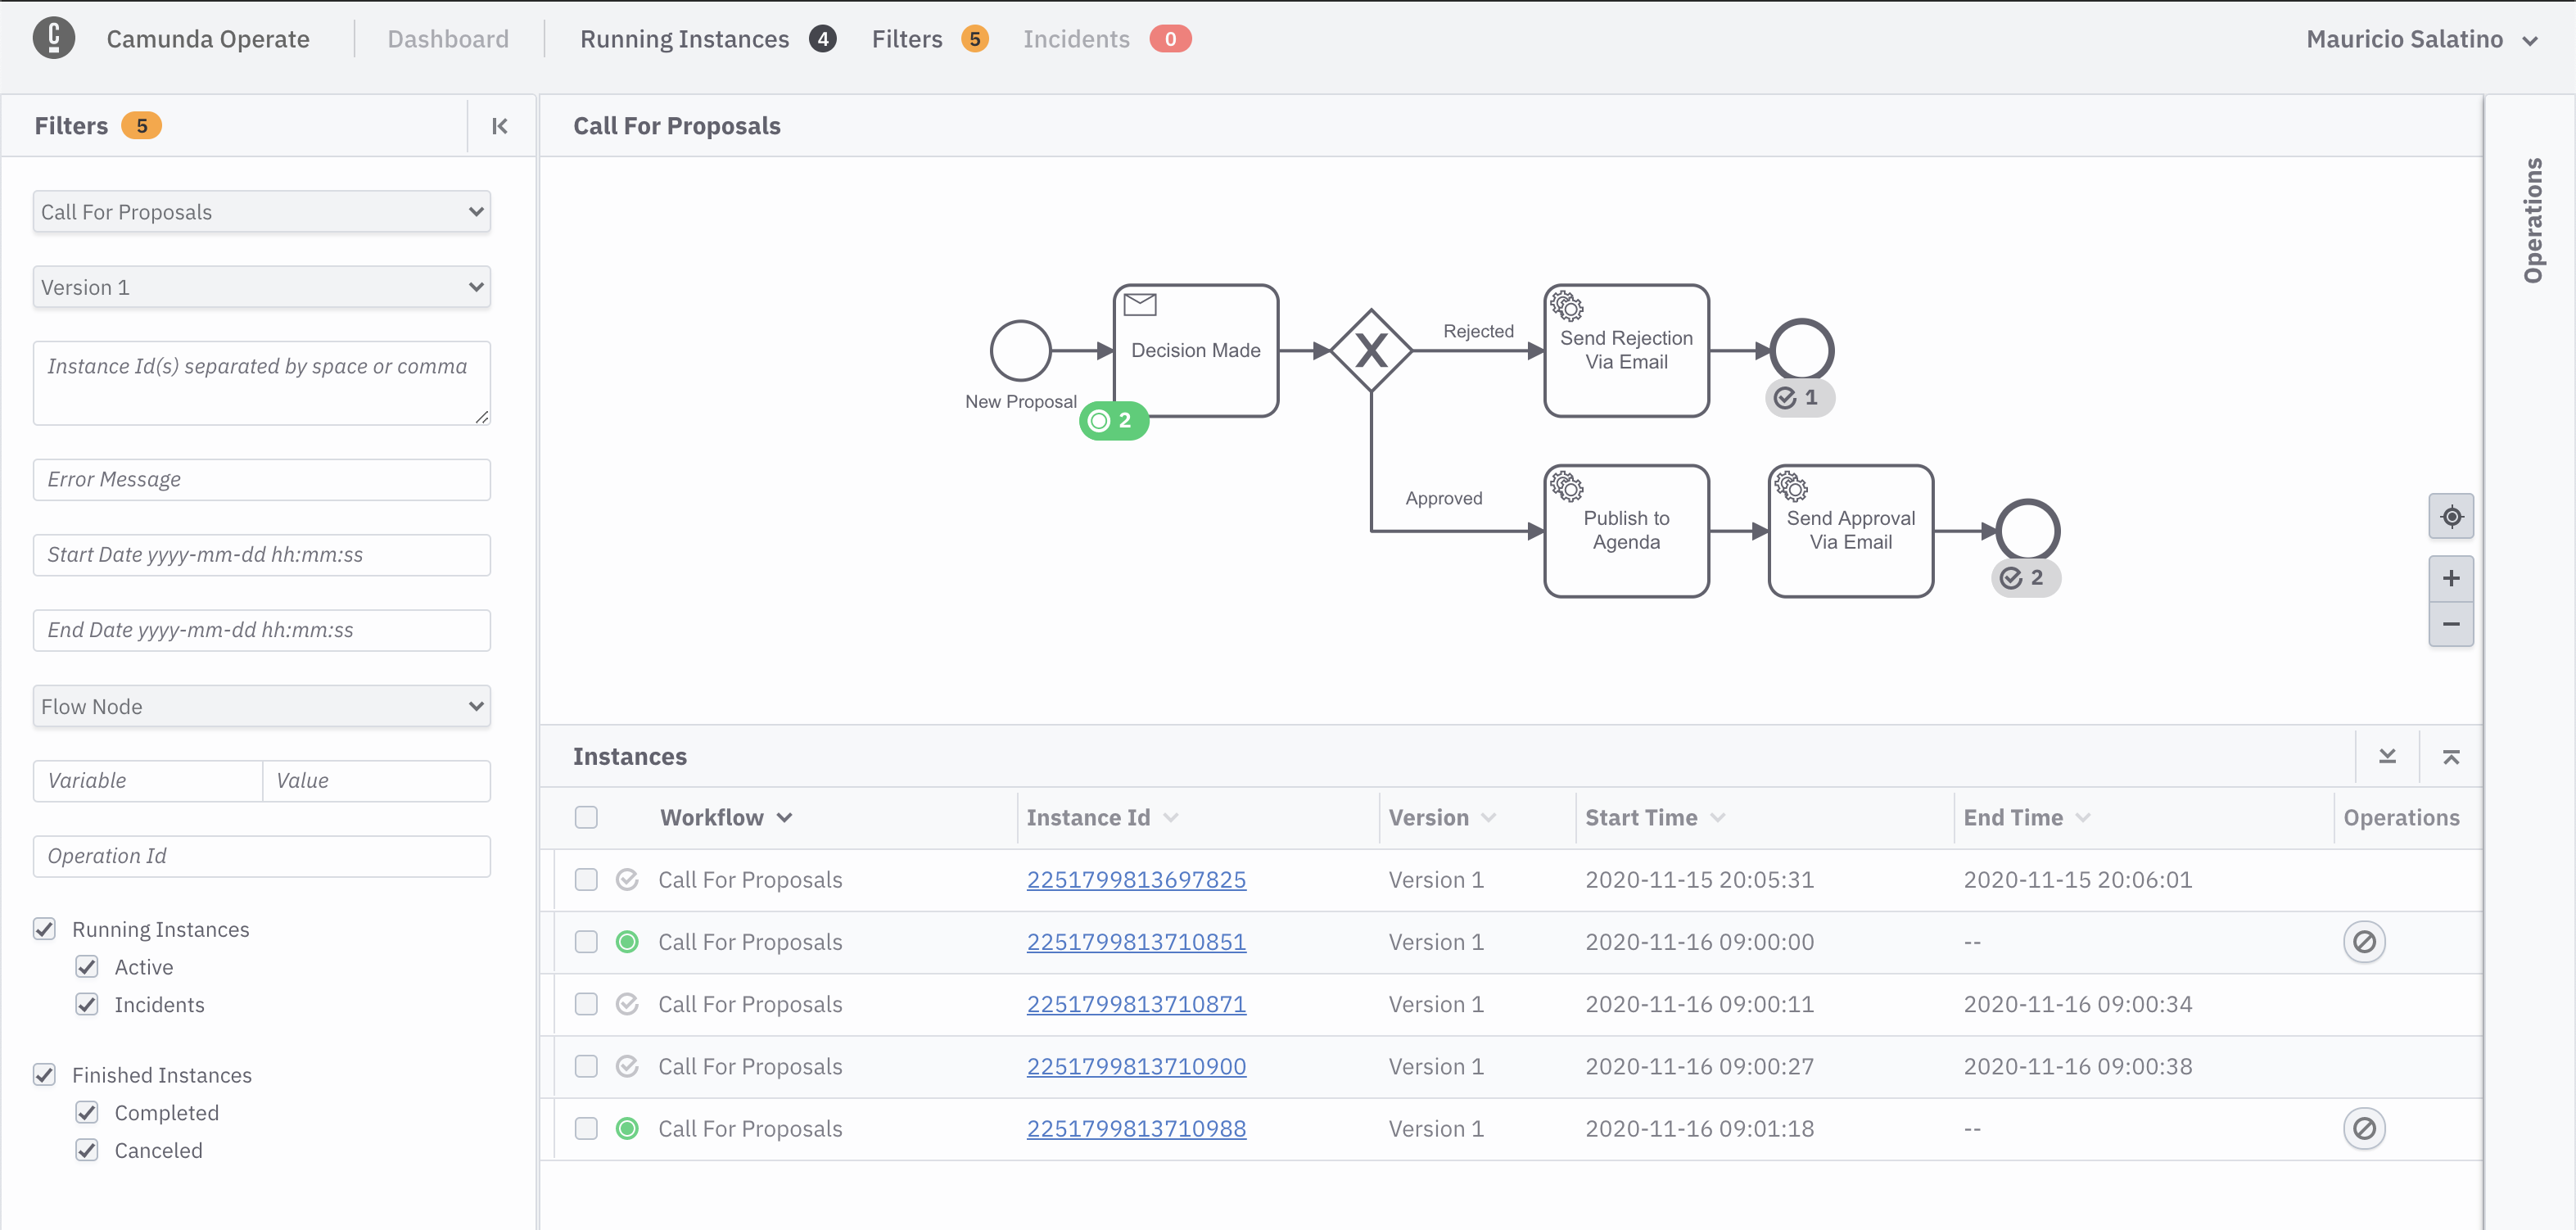
Now go back to the Conference Application, remember, listing all the Knative Services will show the URL for the API Gateway Service that is hosting the User Interface, when you are in the application, submit a new proposal and then refresh Camunda Operate:
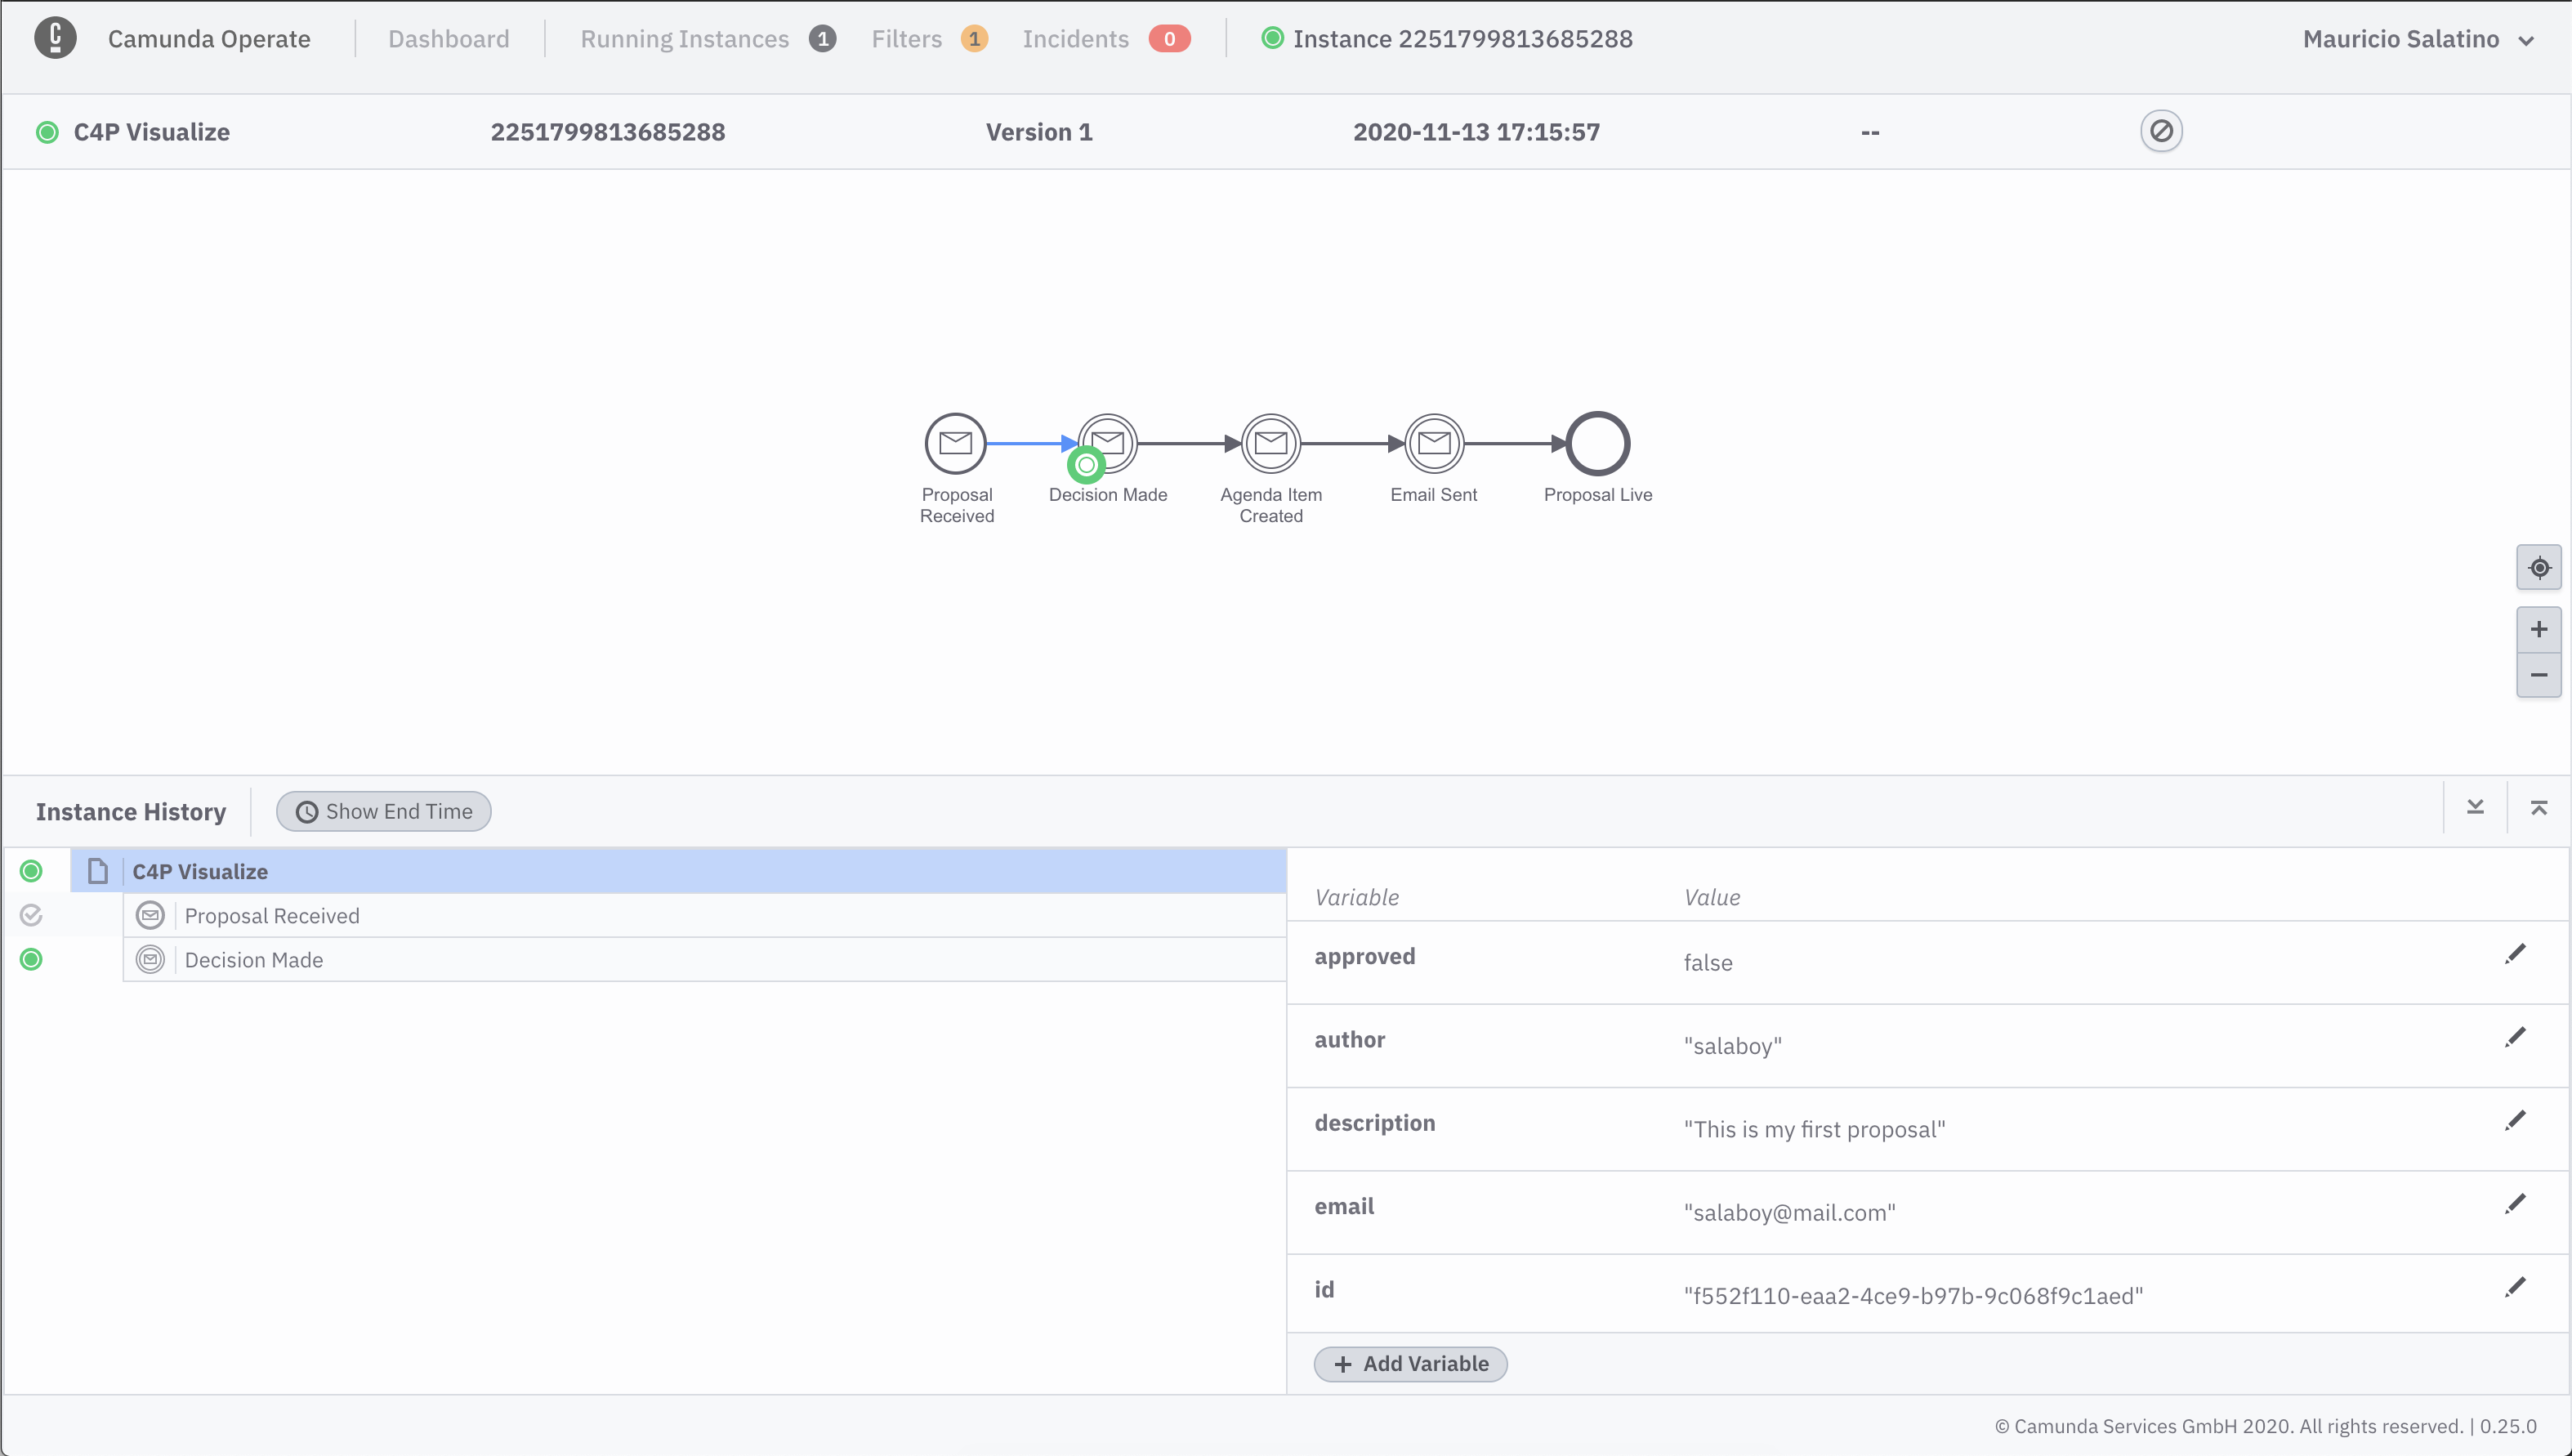
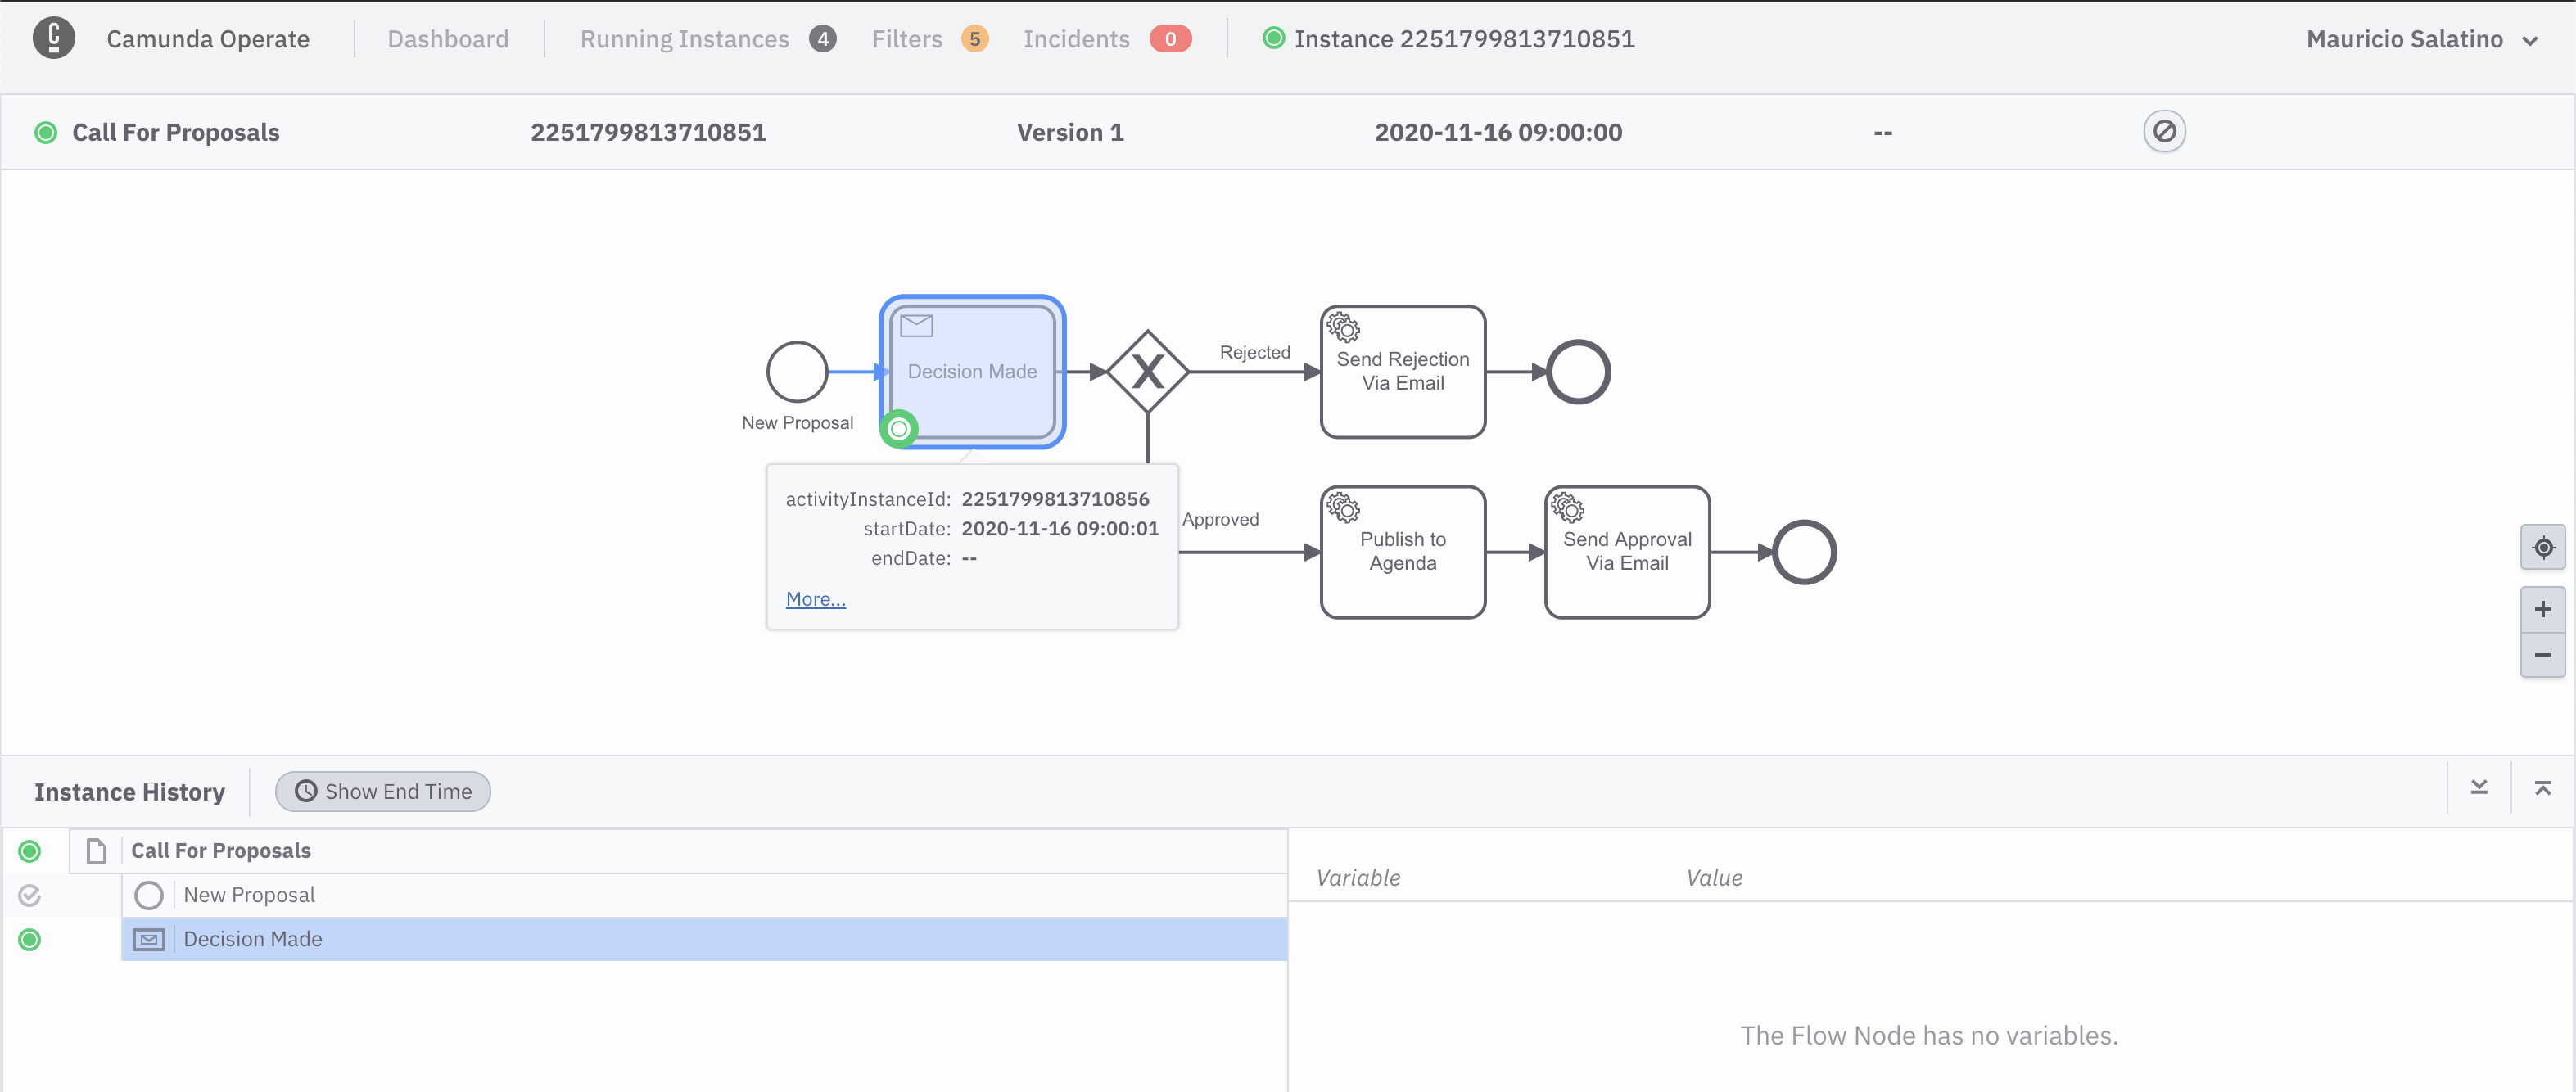
If you click into the Instance ID link, highligted above, you can see the details of that specific instance:
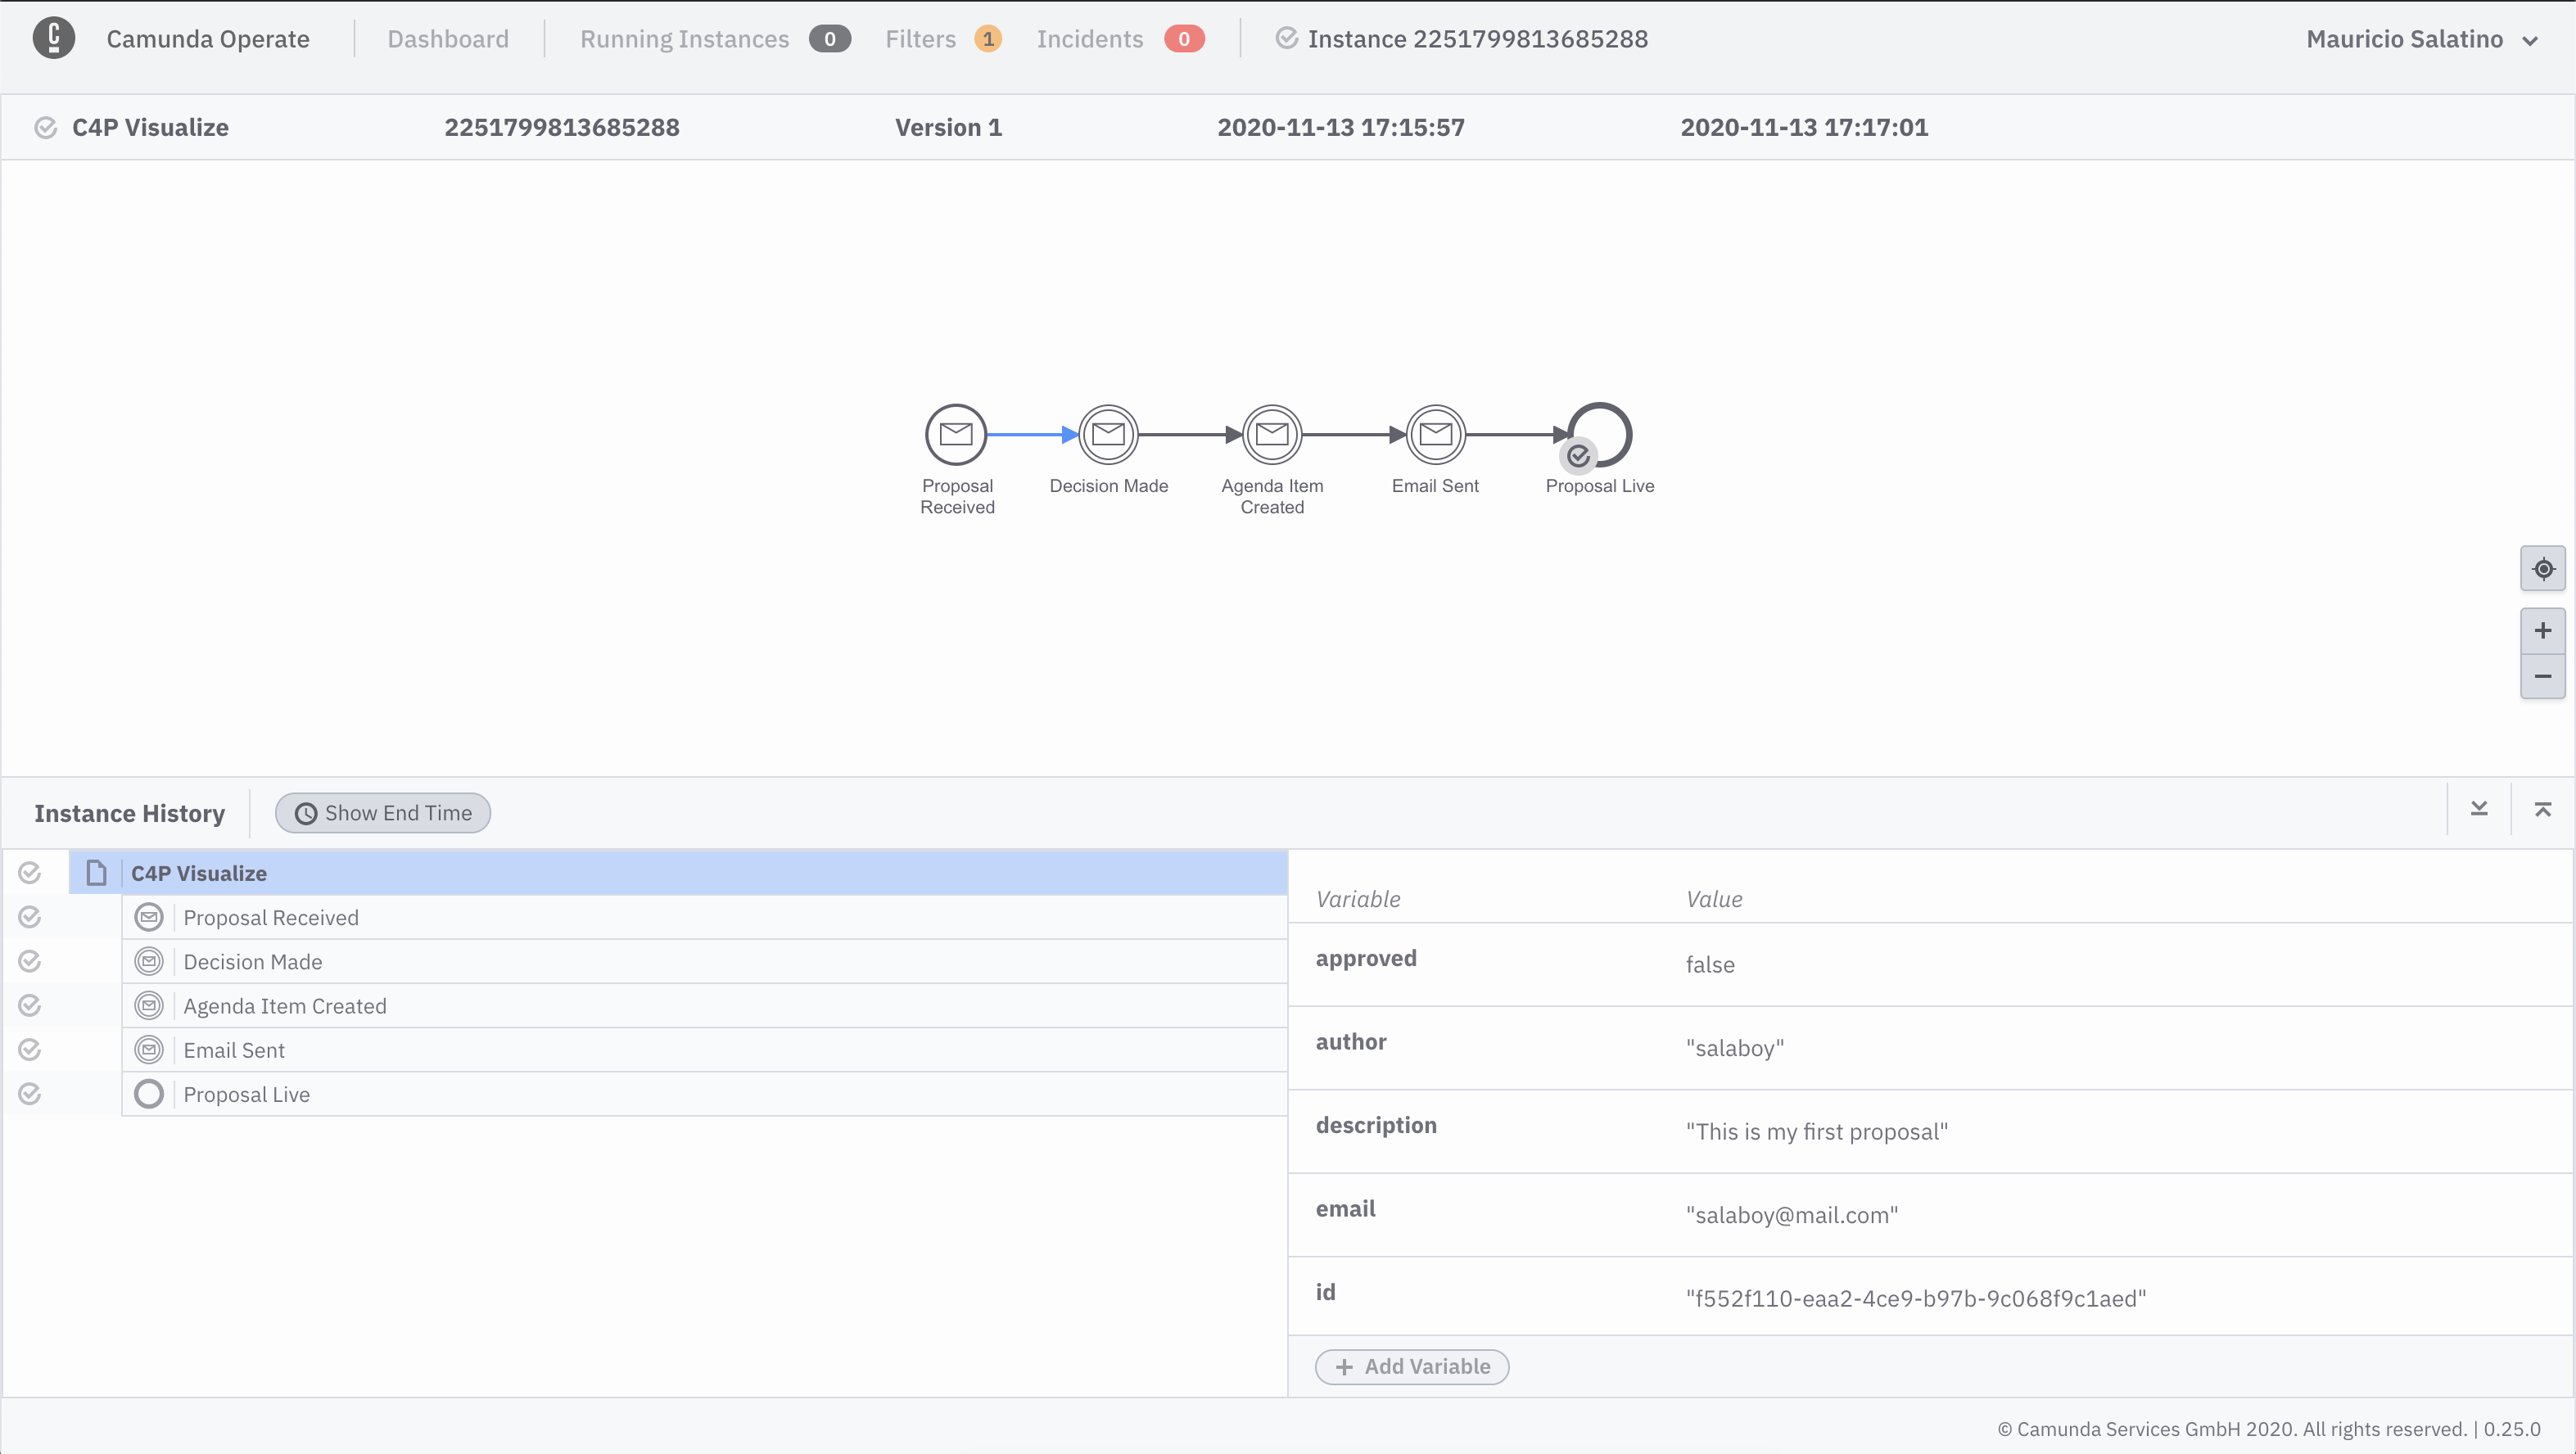
If you go ahead to the Back Office of the application and approve the proposal that you just submitted, you should see in Camunda Operate that the instance is completed:
**Extras**: Understanding different branches (Click to Expand)
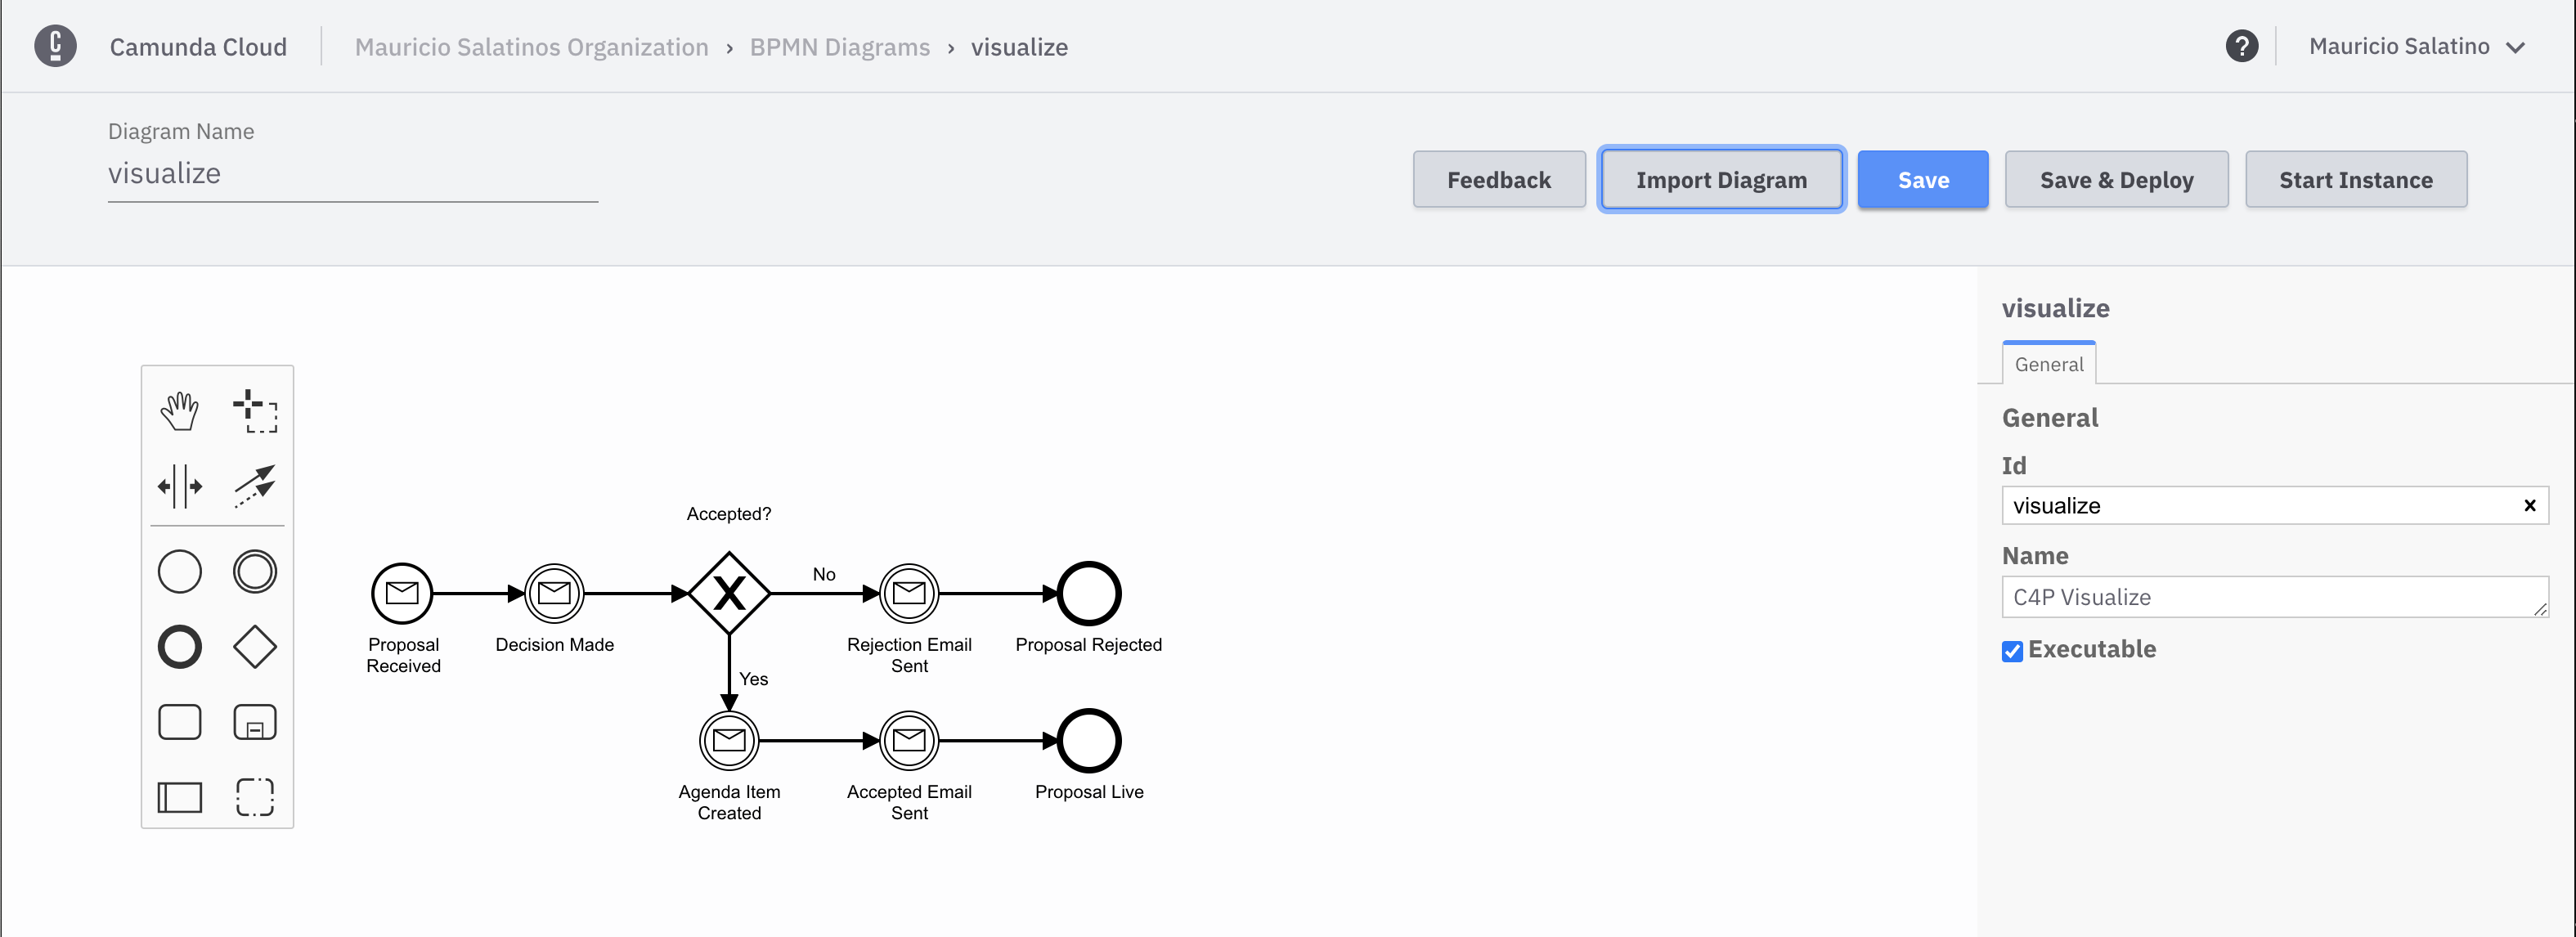
As you might notice, the previous workflow model will only work if you approve proposals, as the `Agenda Item Created` event is only emitted if the proposal is accepted. In order to cover also the case when you reject a proposal you can deploy version 2 of the workflow model, that describes these two branches for approving and rejecting proposals.In order to deploy the second version of the workflow model you follow the same steps as before, you

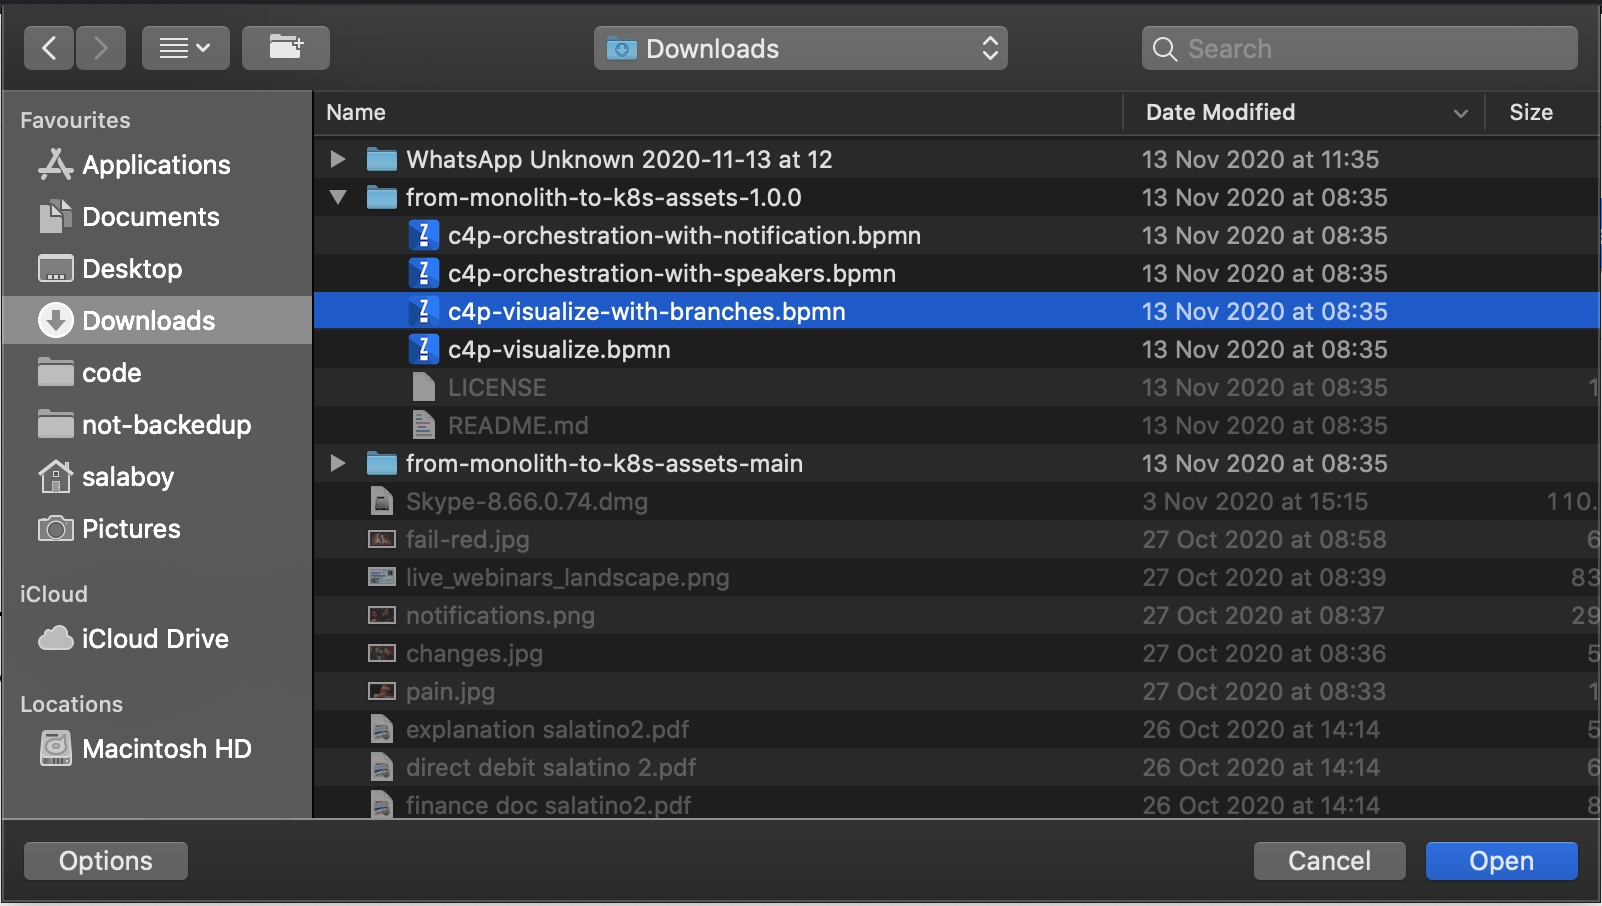
Click into your previously saved diagram called visualize and then Import Diagram and then select cp4-visualize-with-branches.bpmn:
The new diagram should like this:
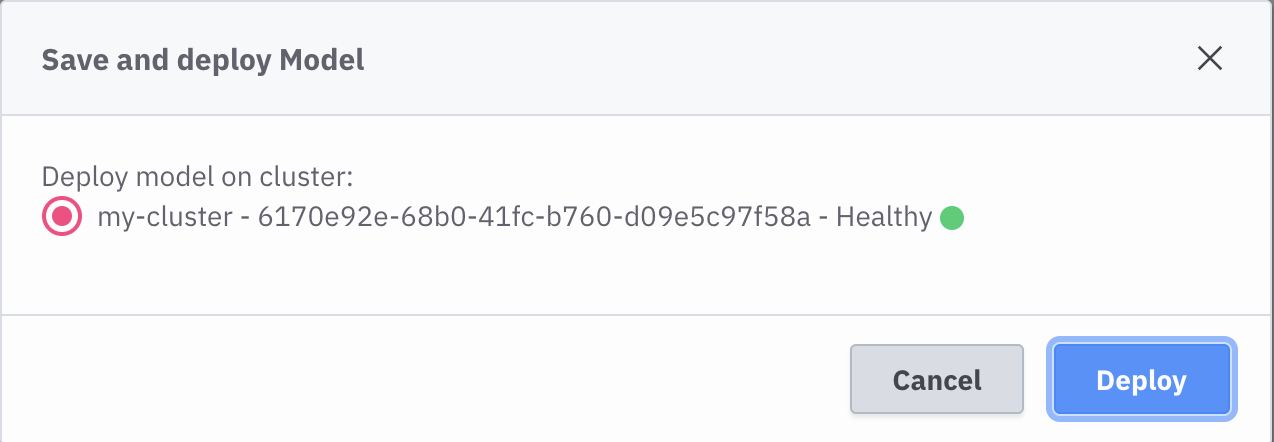
Now you are ready to Save and Deploy the new version:
If you switch back to Camunda Operate you will now see two versions of the C4P Visualize workflow:

Click to drill down into the runtime data for the new version of the workflow:

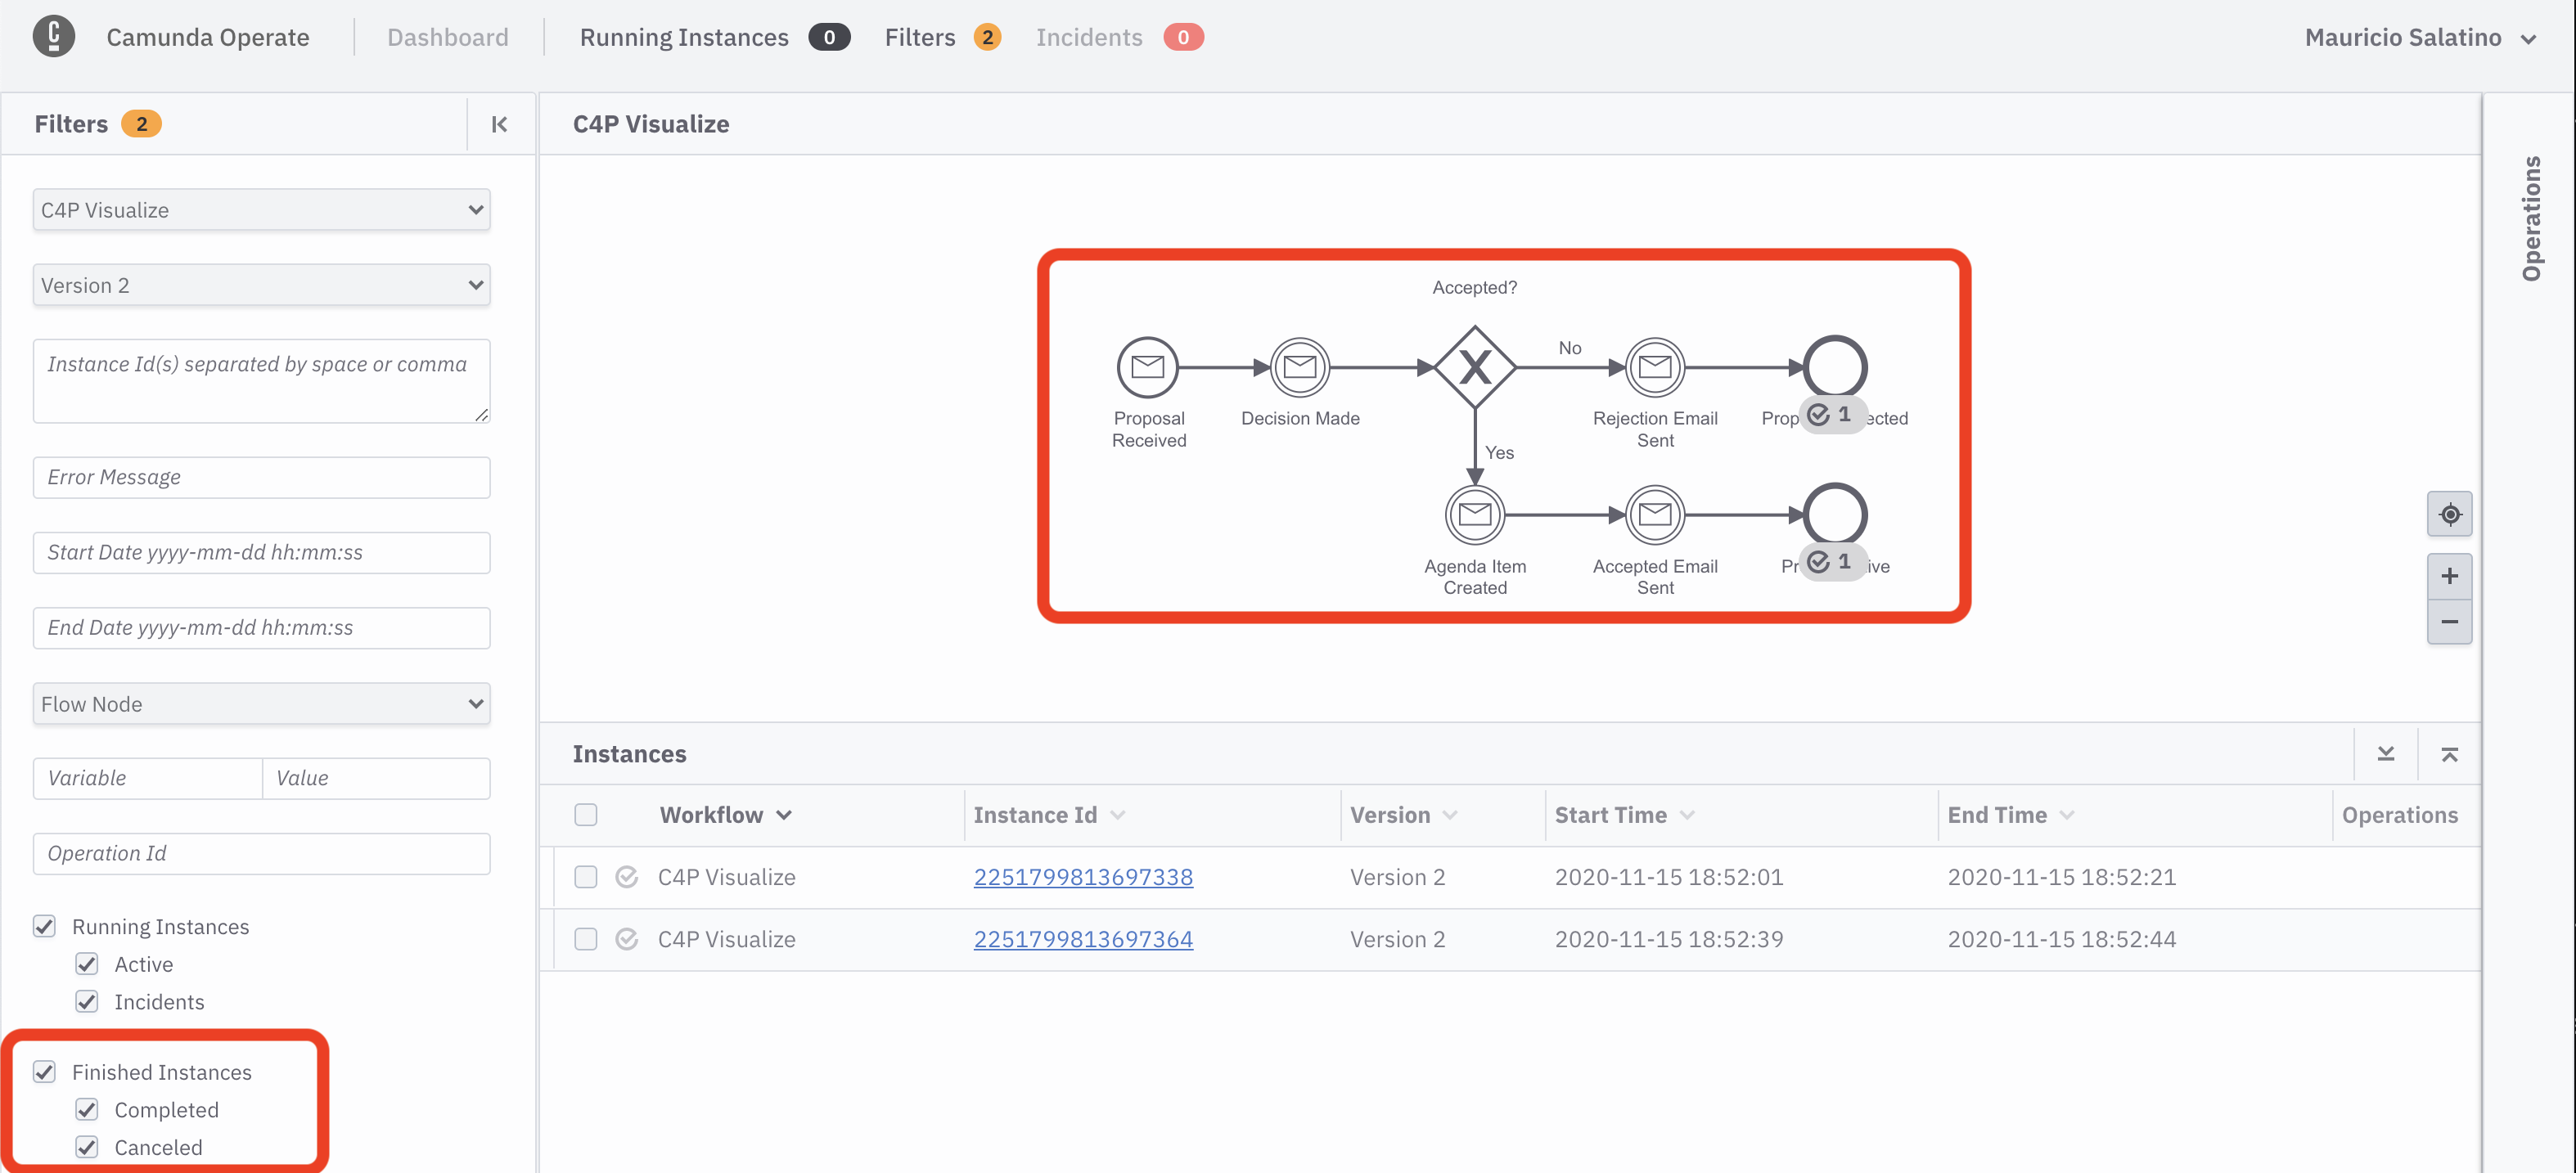
If you now go back to the application and submit two proposals you can reject one and approve one, you should now see both instances completed:
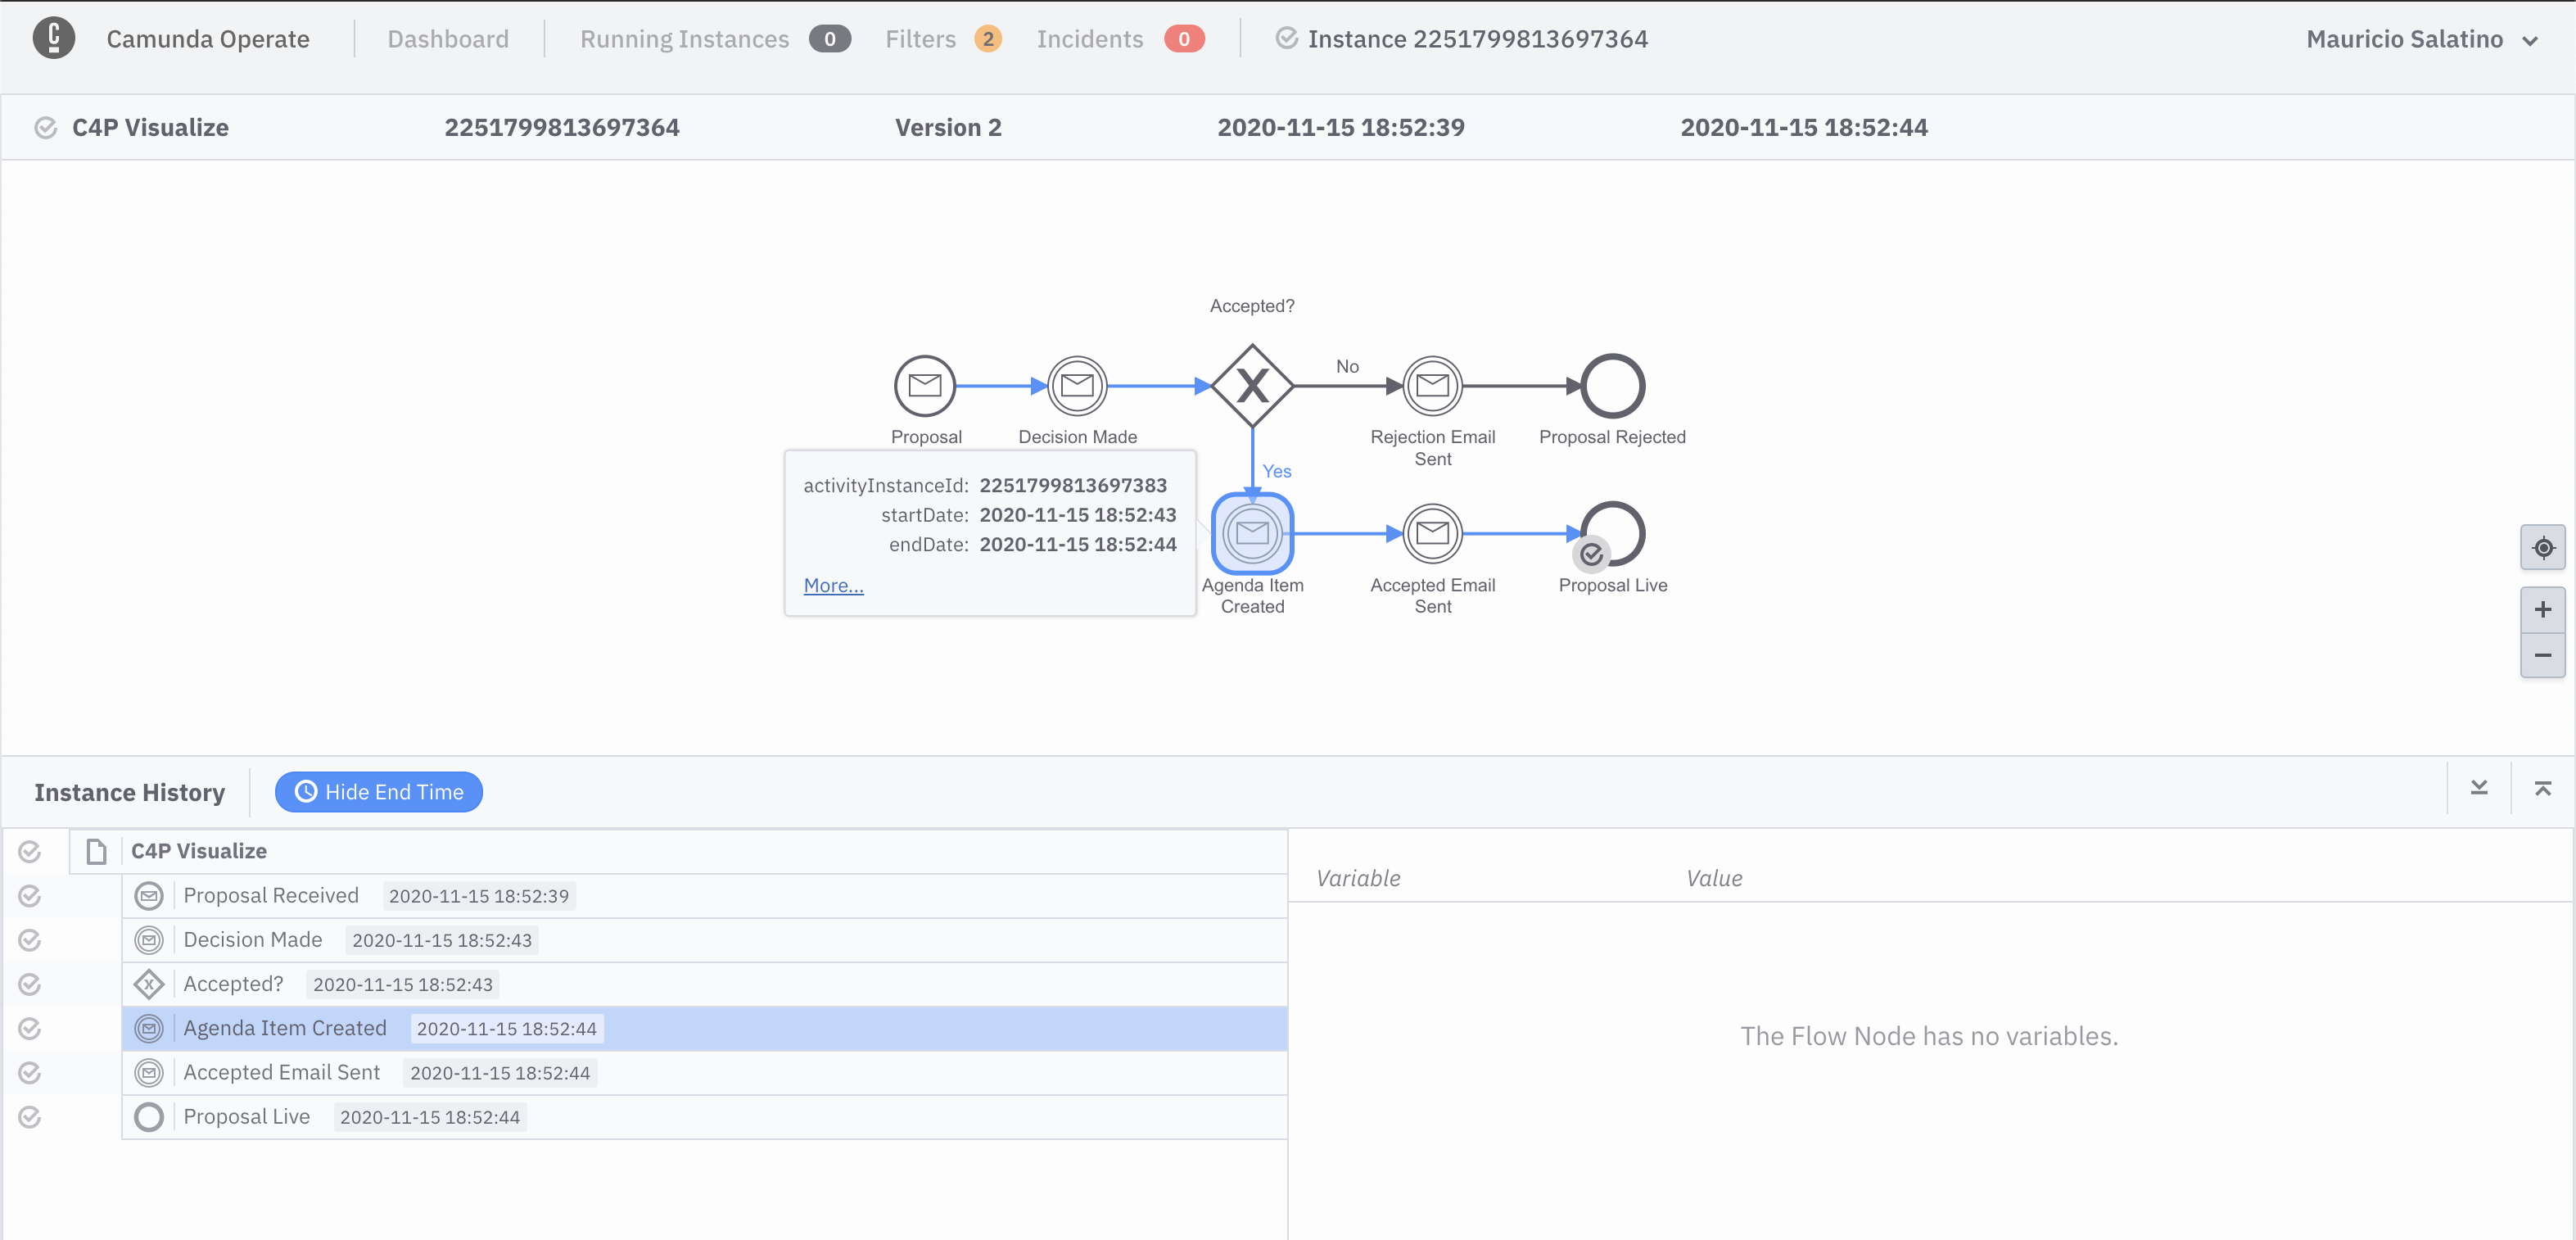
Remember that you can click in any instance to find more details about the execution, such as the audit logs to understand exactly when things happened:
If you made it this far, you can now observe your Cloud-Native applications by emitting CloudEvents from your services and consuming them from Camunda Cloud. 🎉 🎉
Let's undeploy version 2 to make some space for version 3.
h delete fmtok8s-v2 --no-hooks
In Version 3, you will orchestrate the services interactions using the workflow engine.
You can now install version 3 running:
h install fmtok8s-v3 workshop/fmtok8s-app-v3The ouput for this command should look familiar at this stage:
Check that the Kubernetes Pods and the Knative Services are ready:
When all the pods are ready (2/2) you can now access to the application.
As you might have noticed, there is a new Knative Service and pod called fmtok8s-speakers, you will use that service later on.
An important change in version 3 is that it doesn't use a REST based communication between services, this version let Zeebe, the workflow engine inside Camunda Cloud, to define the sequence and orchestrate the services interactions. Zeebe uses a Pub/Sub mechanism to communicate with each service, which introduces automatic retries in case of failure and reporting incidents when there are service failures.
**Extras**: Changes required to let Zeebe communicate with our existing services (Click to Expand)
Links to Workers, and dependencies in projects, plus explain how the workers code is reusing the same code as rest endpoints internally.Another important change, is that the C4P Service now deploys automatically the workflow model used for the orchestration to happen. This means that when the fmtok8s-c4p Knative Service is up and ready, you should have a new workflow model already deployed in Camunda Cloud:
If you now click into the new workflow model you can see how the new model looks like:
If you submit a new proposal from the application user interface, this new workflow model is in charge of defining the order in which services are invoked. From the end user point of view, nothing has changed, besides the fact that they can now use Camunda Operate to understand in which step each proposal is at a given time. From the code perspective, the business logic required to define the steps is now delegated to the workflow engine, which enables non-technical people to gather valuable data about how the organization is working, where the bottlenecks are and how are your Cloud-Native applications working.
Having in a single place the state of all proposals can help organizers to prioritize other work or just make decisions to move things forward:
In the screenshot above, it is clear that 2 proposals are still waiting for a decision, 2 proposals were approved and 1 rejected. Remember that you can drill down to each individual workflow instance for more details, for example, how much time a proposal has been waiting for a decision:
Based on the data that the workflow engine is collecting from the workflow's executions, you can understand better where the bottlenecks are or if there are simple things that can be done to improve how the organization is dealing with proposals. For this example, you can say that this workflow model represent 100% the steps required to accept or reject a proposal, in some way this explains to non-technical people the steps that the application is executing under the covers.
Becuase the workflow model is now in charge of the sequence of interactions, you are free to change and adapt the workflow model to better suit your organization needs.
If you made it this far, Well Done!!! you have now orchestrated your microservices interactions using a workflow engine! 🎉 🎉
Here are some extras that you might be interested in, to expand what you have learnt so far:
- Update the workflow model to use the newly introduced Speakers Service
- Update the workflow model to send notifications if a proposal is waiting for a decision for too long
- Make the application fail to see how incidents are reported into Camunda Operate
(TBD)

