The Asterisk Mixin is a set of configurable, reusable, and extensible alerts and dashboards based on the metrics exported by the prometheus exporter in Asterisk. The mixin also creates a dashboard that uses Loki to monitor Asterisk logs.
The mixin contains 2 dashboards:
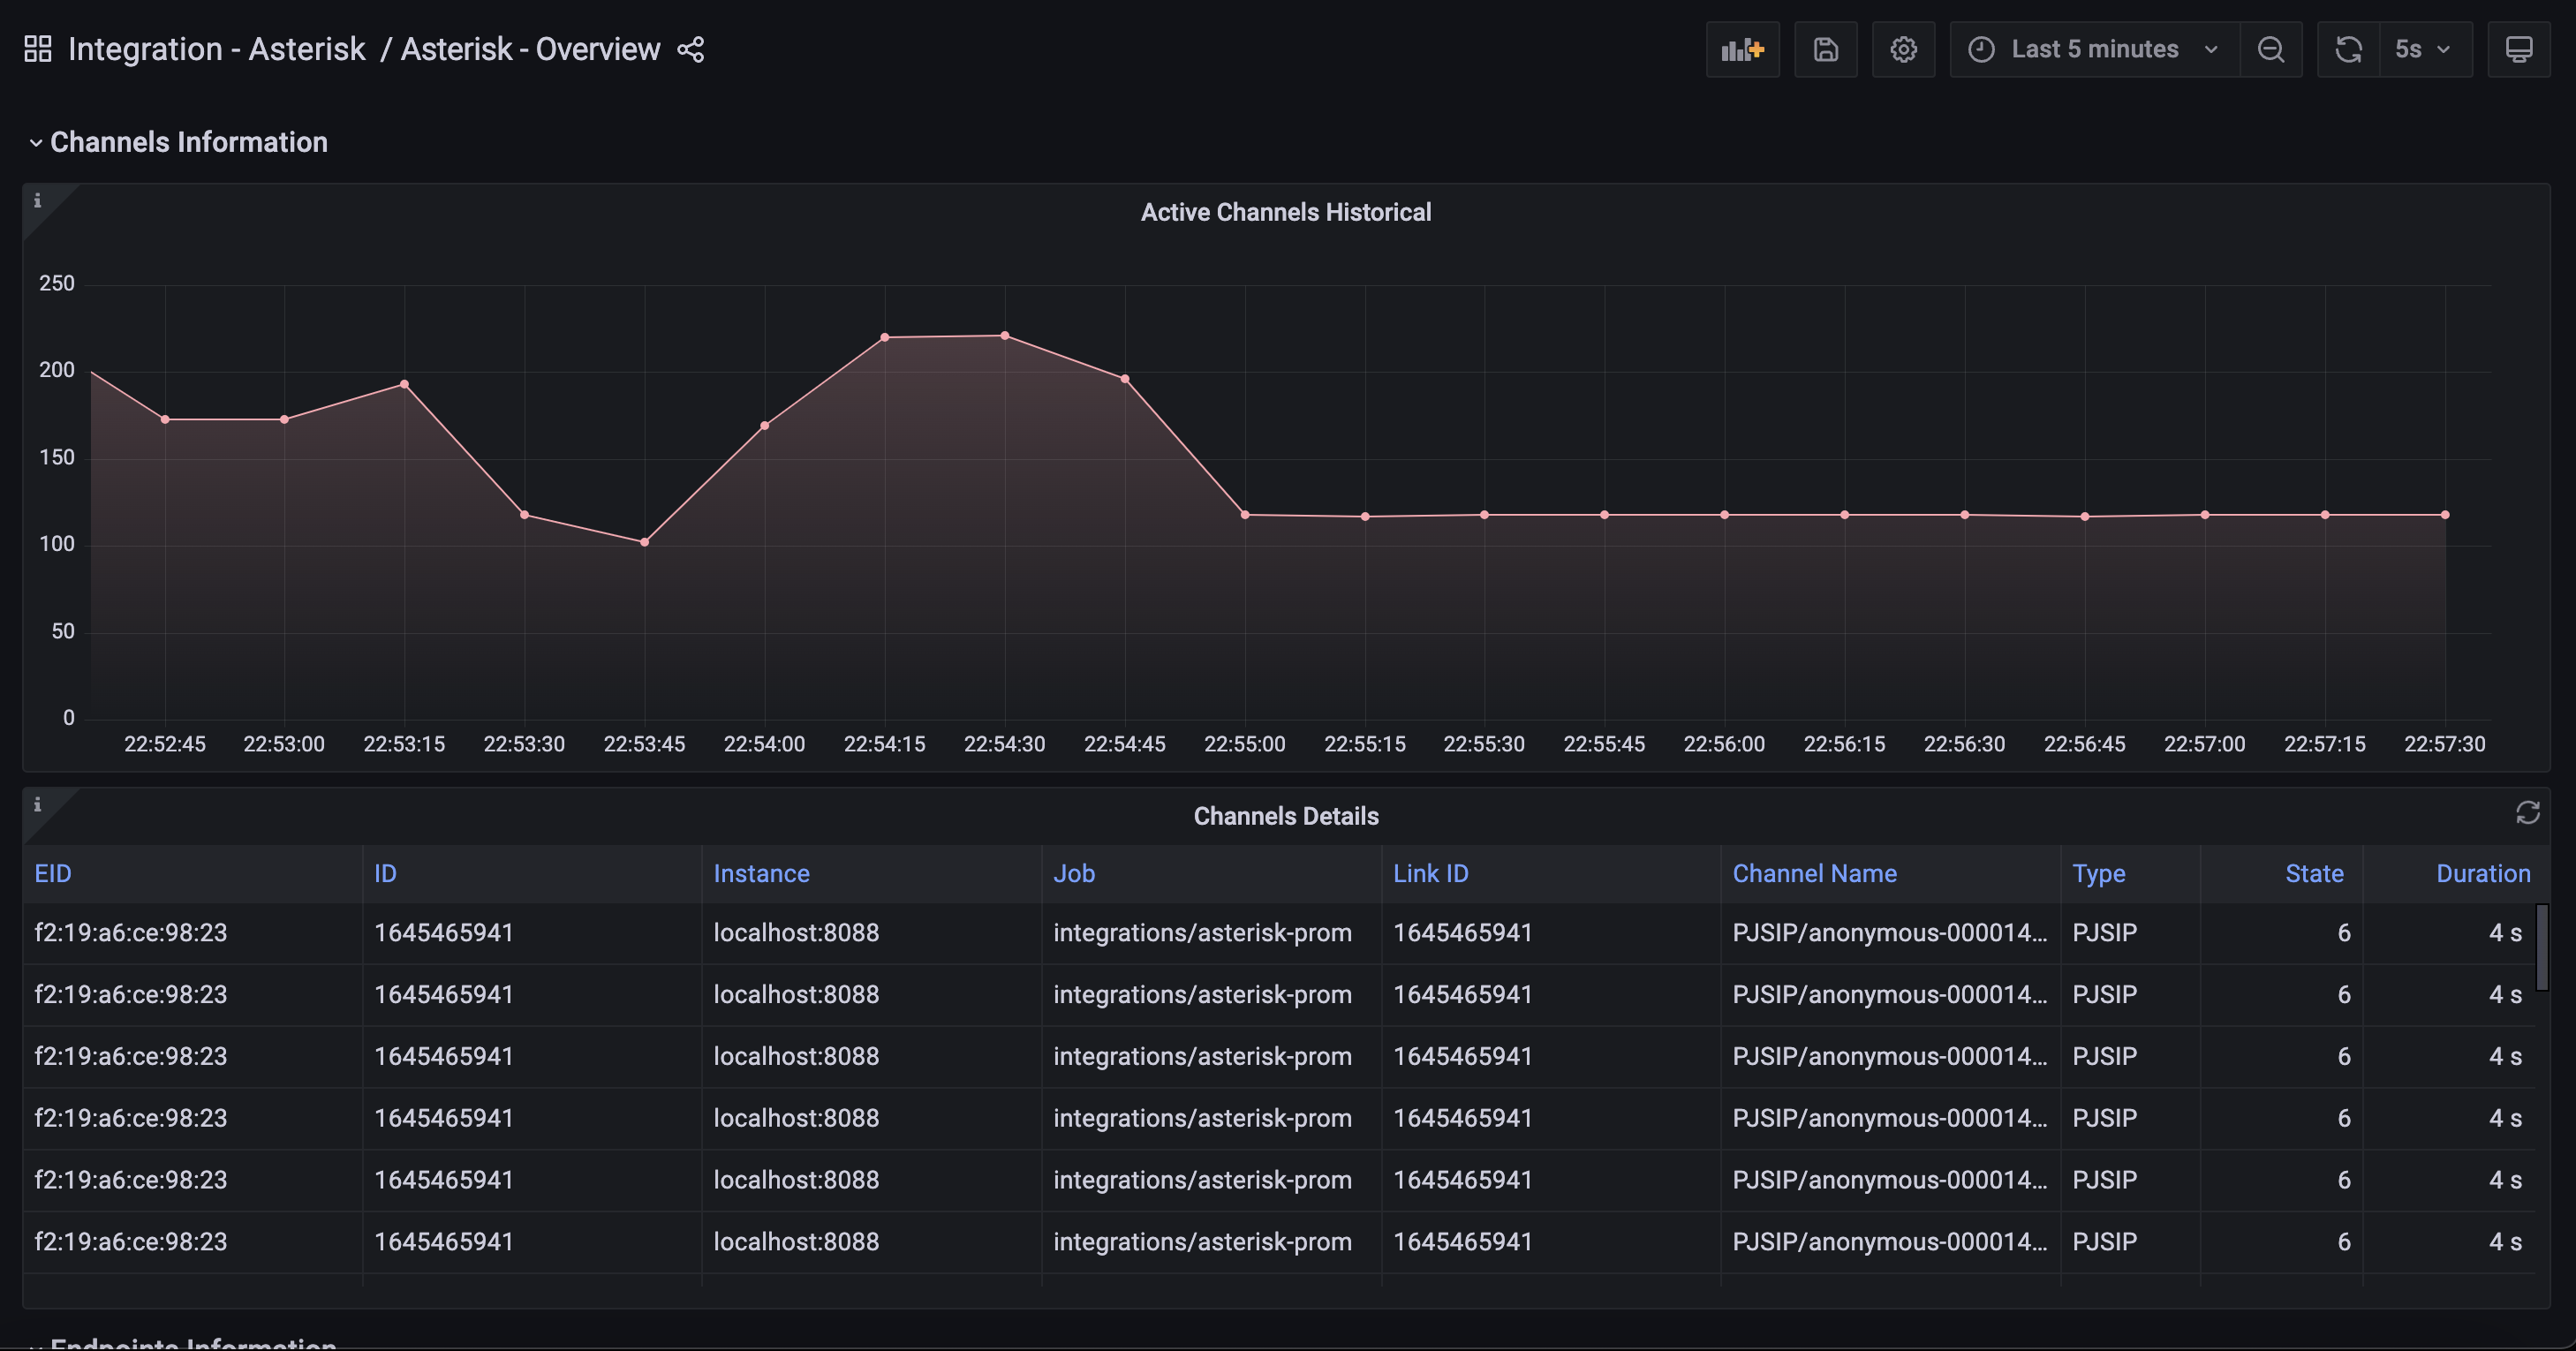
This dashboard gives a general overview of the Asterisk instance based on all the metrics exposed by the embedded prometheus exporter in Asterisk. This file shows sample metrics exposed by the exporter of an Asterisk instance.
In order for this dashboard to work, you must enable the embedded prometheus exporter in Asterisk to collect and expose Asterisk metrics.
The embedded prometheus exporter also requires the embedded asterisk http server to be enabled.
Sample res_prometheus configration /etc/asterisk/prometheus.
Sample http_server configration /etc/asterisk/http_additional.conf.
The dashboard contains multiple sections as shown below:
Asterisk Overview
Channels Information
Endpoints Information
Bridges Information
Asterisk System Information
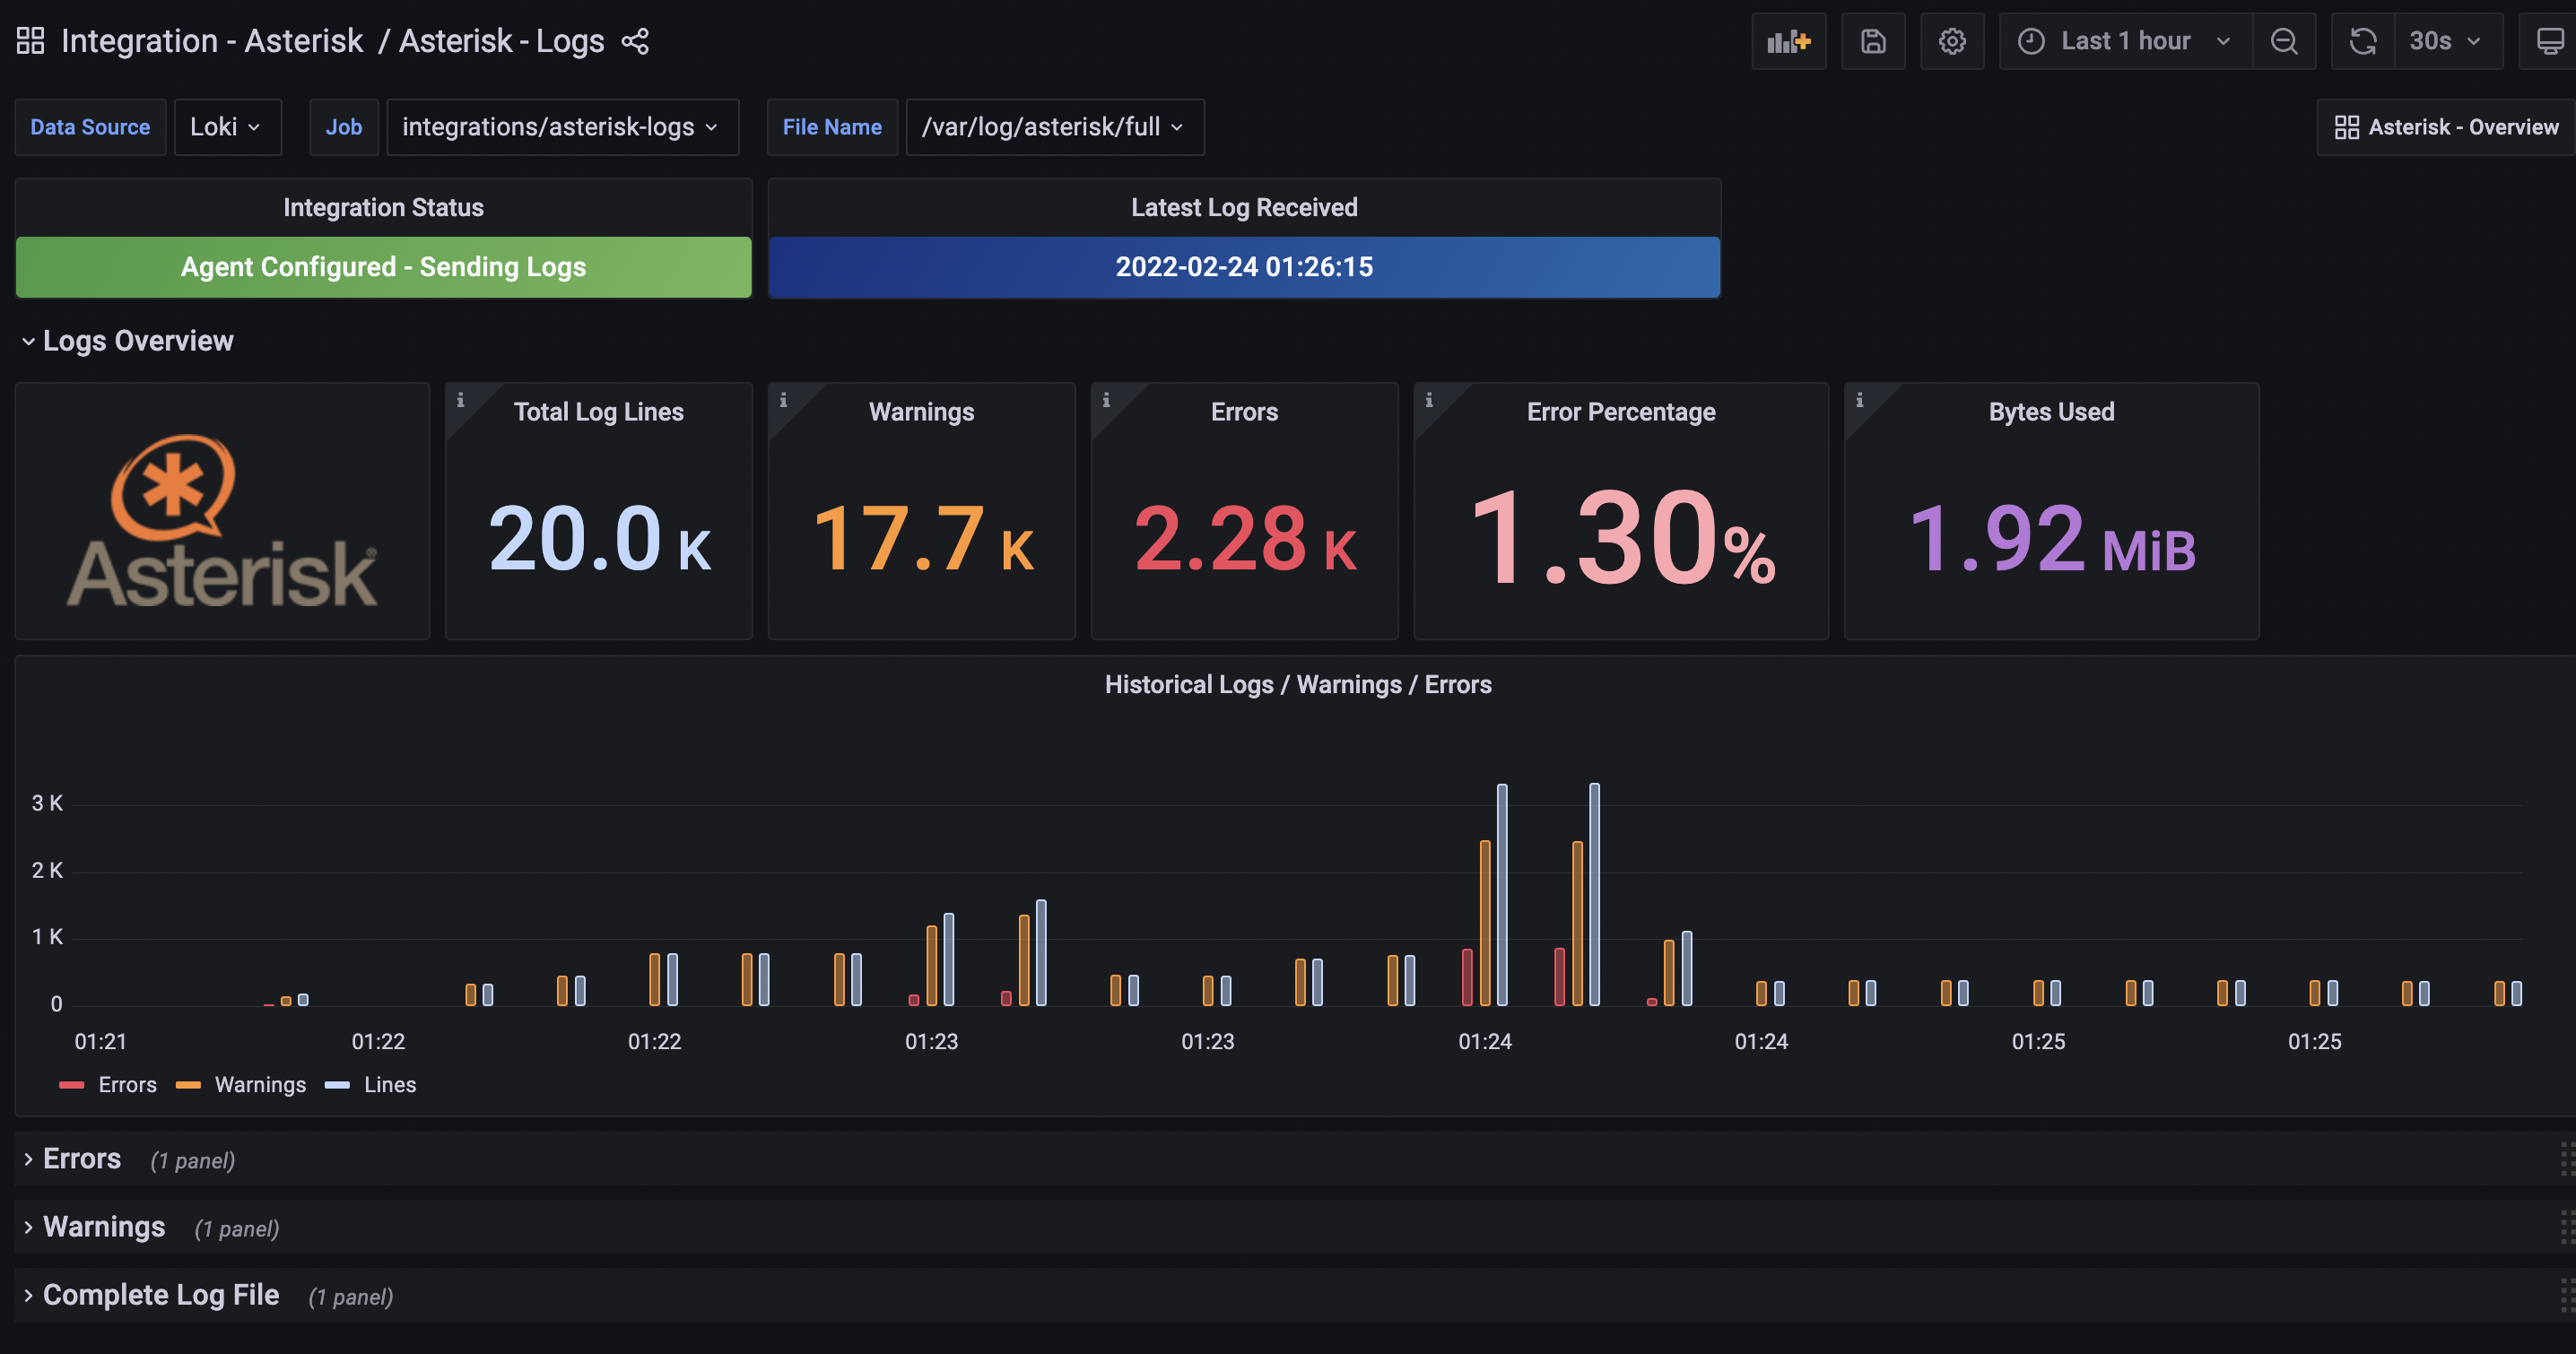
This dashboard provides metrics and details on Asterisk log files. Currently only the main Asterisk log file /var/log/asterisk/full is tracked in this dashboard.
This dashboard requires Promtail and Loki to be installed and provisioned for logs with your Grafana instance.
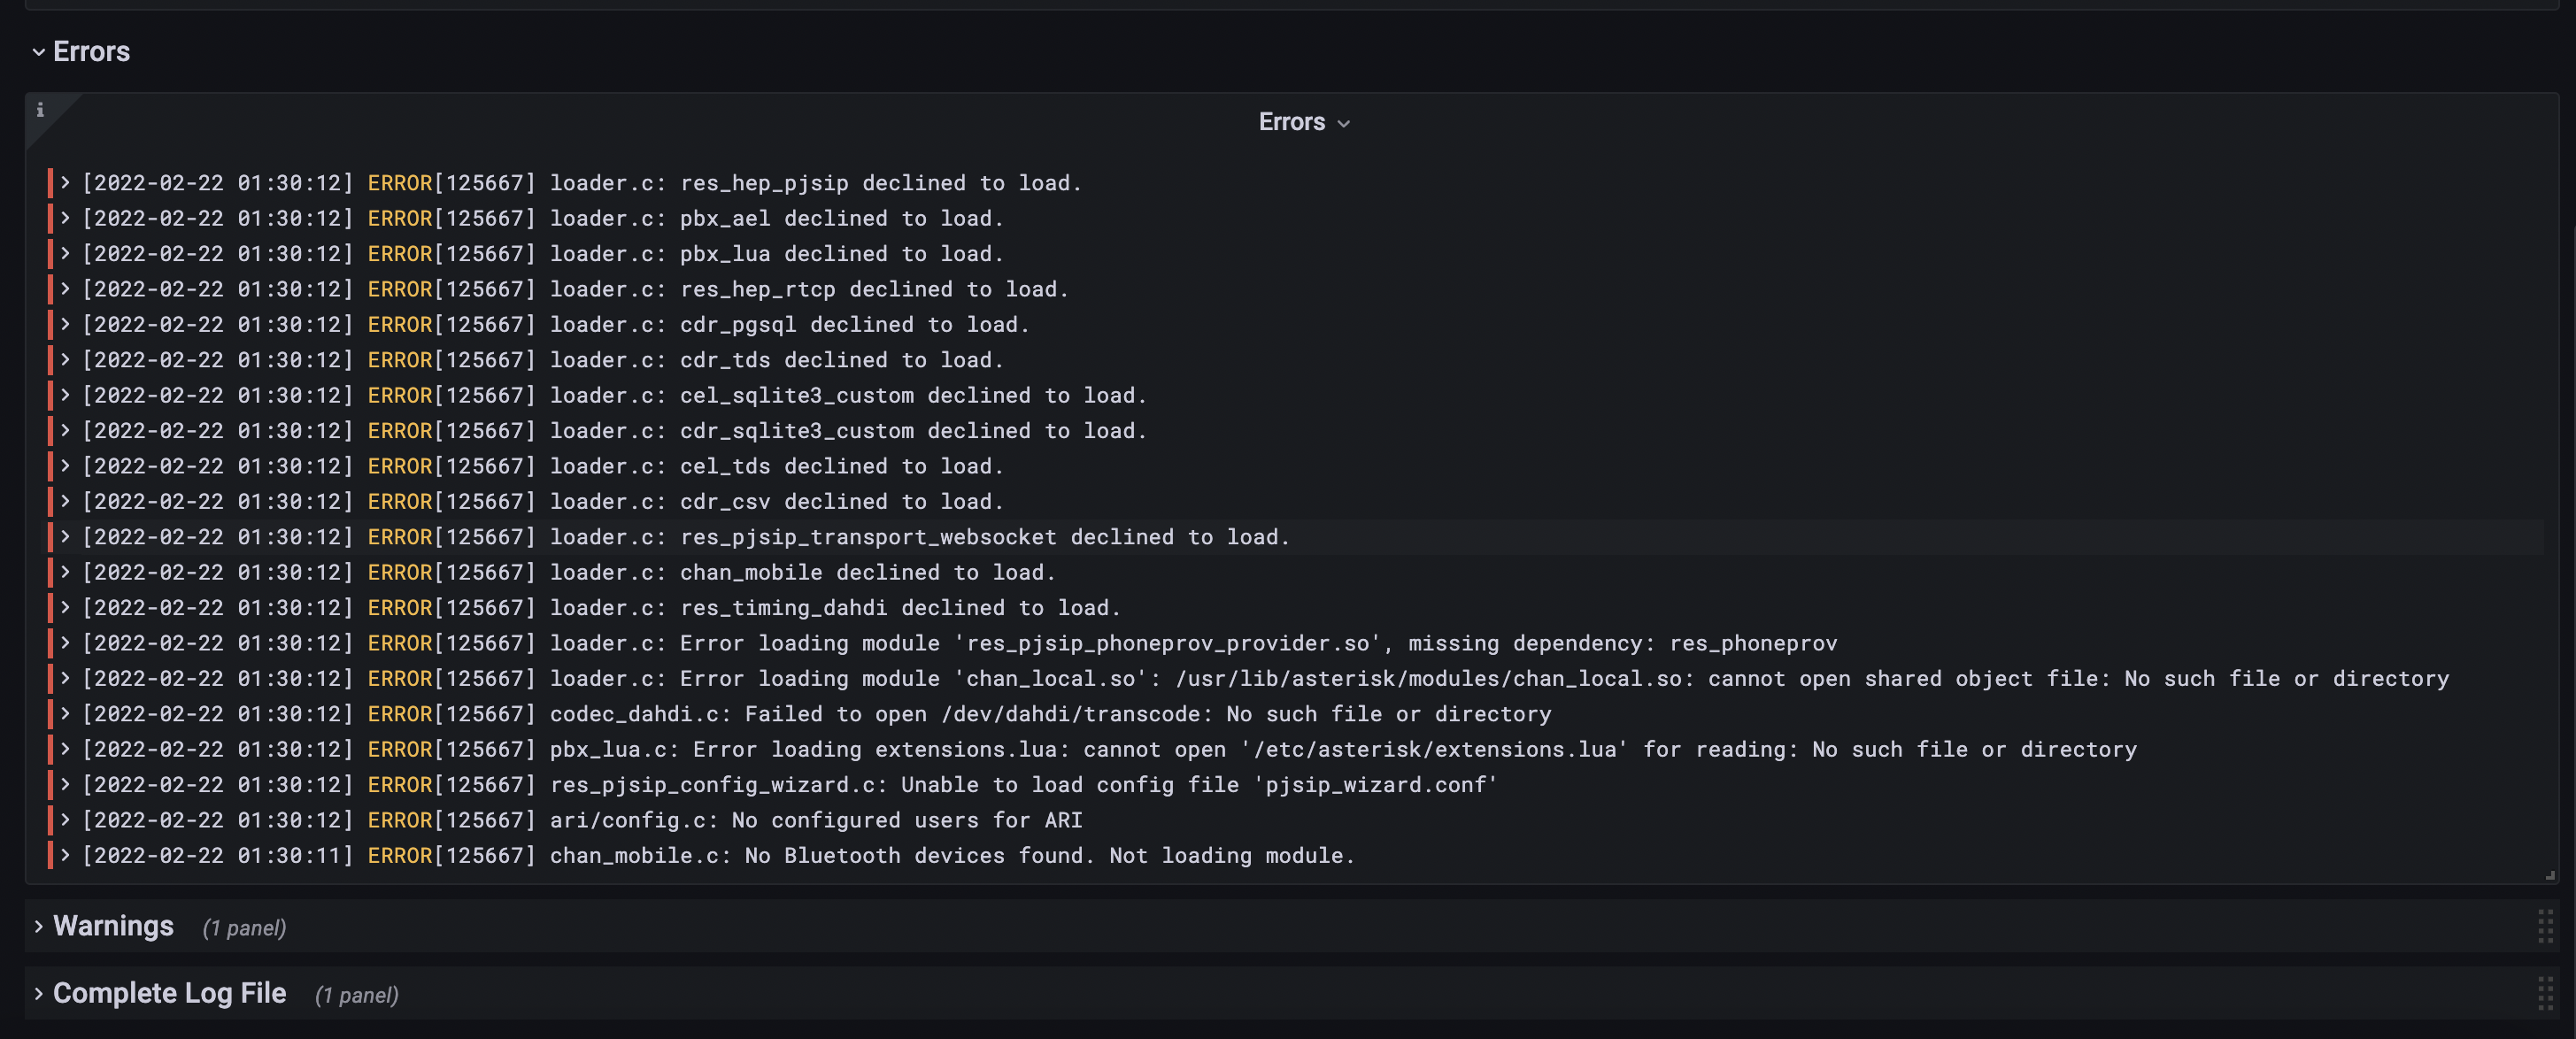
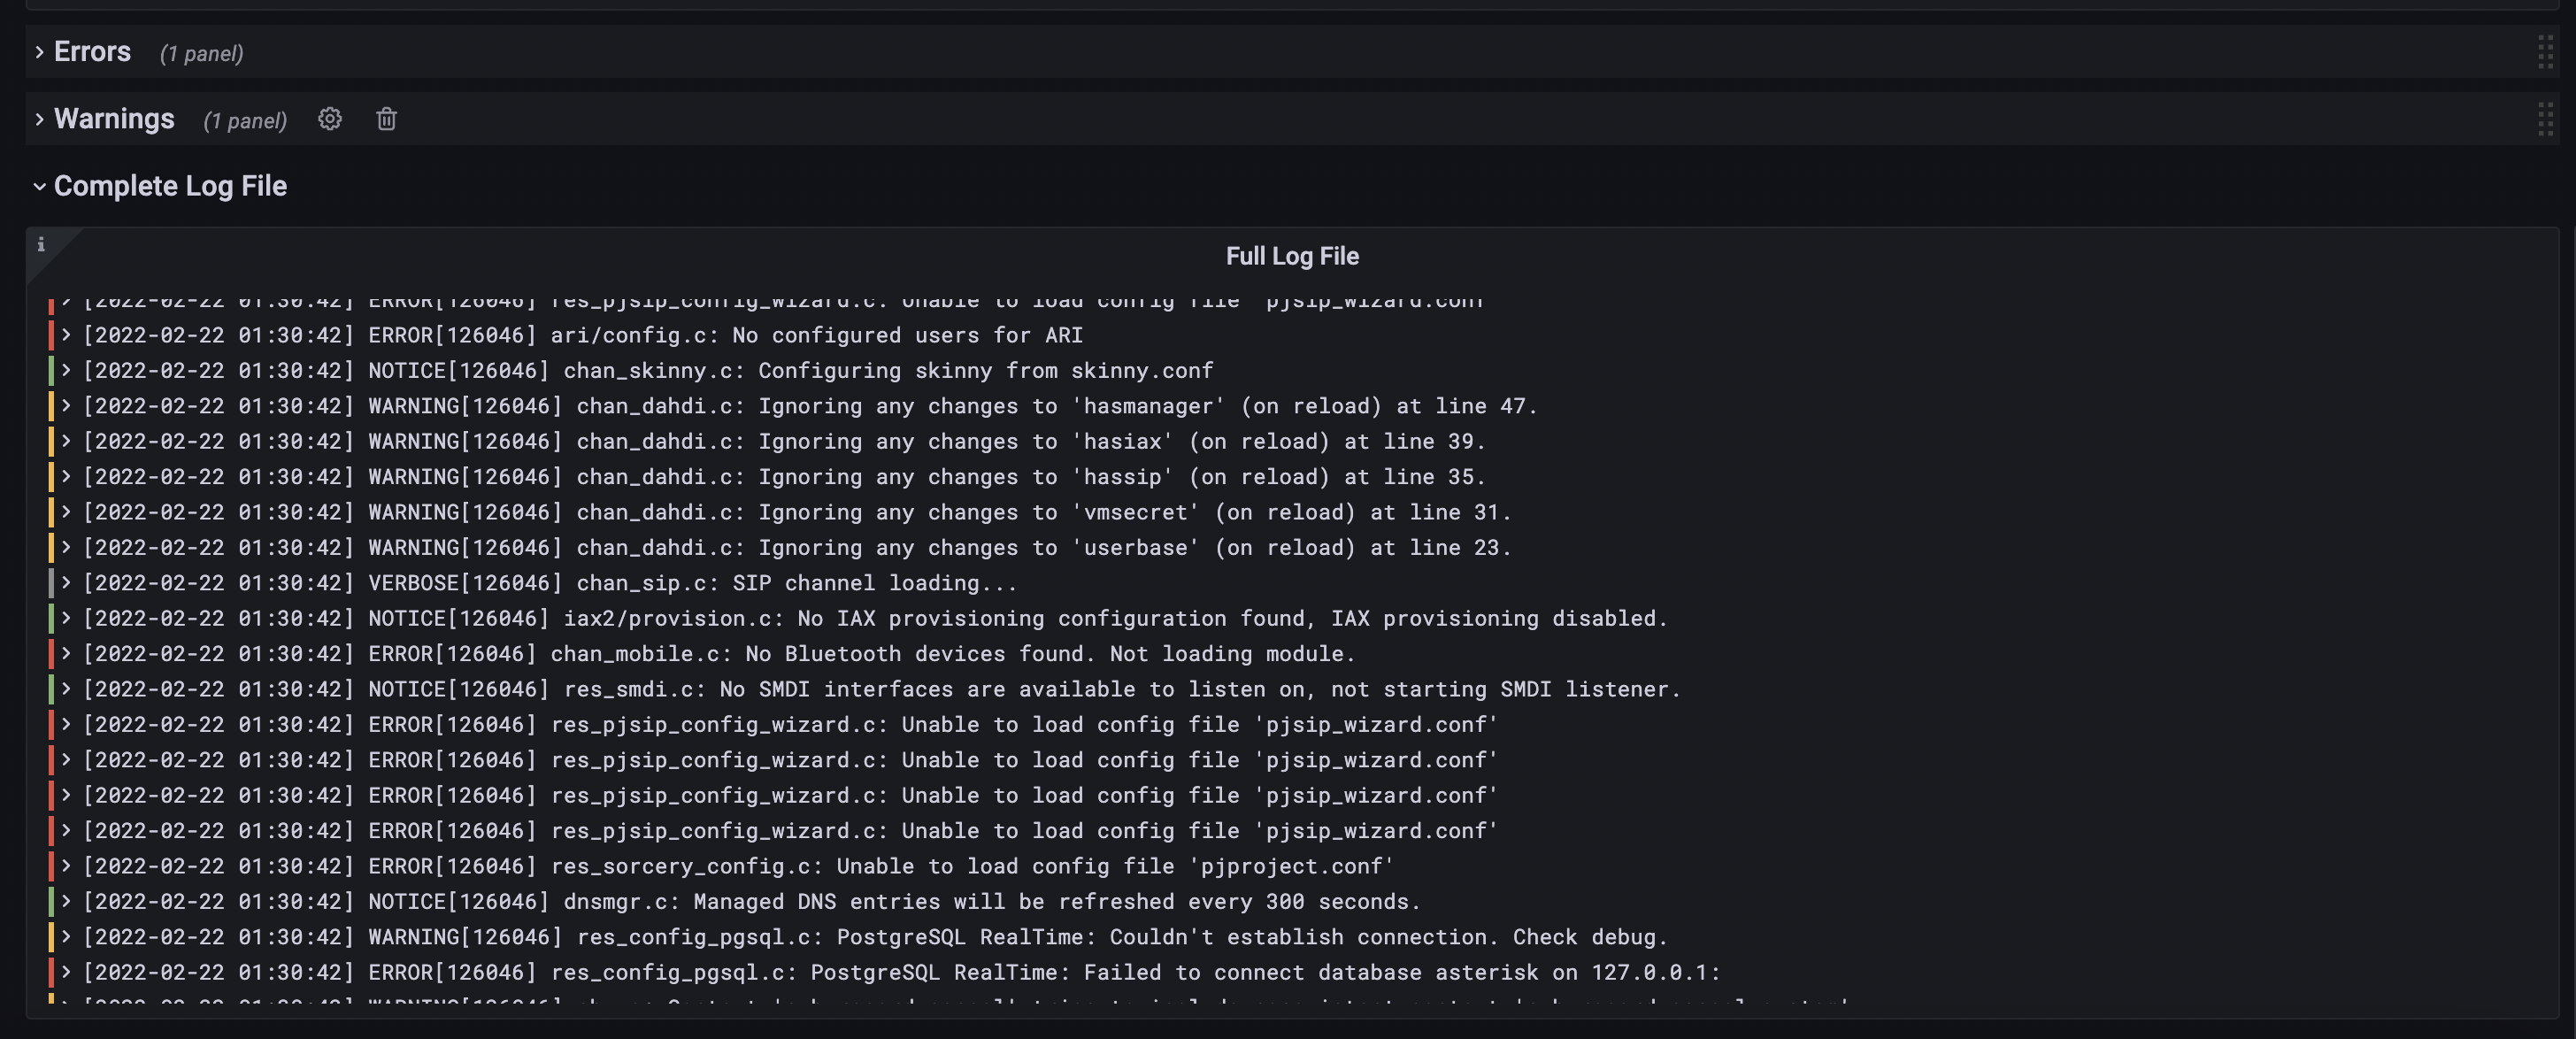
The dashboard contains multiple sections as shown below:
Logs Overview
Errors
Warnings
Complete Log File
On the top right of dashboards, you will find a link to quickly switch between the two dashboards while keeping the time range selection the same
The mixin creates recording and alerting rules for Prometheus and suitable dashboards for Grafana.
To use them, you need to have mixtool and jsonnetfmt installed. If you
have a working Go development environment, it's easiest to run the following:
$ go get github.com/monitoring-mixins/mixtool/cmd/mixtool
$ go get github.com/google/go-jsonnet/cmd/jsonnetfmt
You can then build the Prometheus rules files alerts.yaml and
rules.yaml and a directory dashboard_out with the JSON dashboard files
for Grafana:
$ make buildFor more advanced uses of mixins, see https://github.com/monitoring-mixins/docs.


