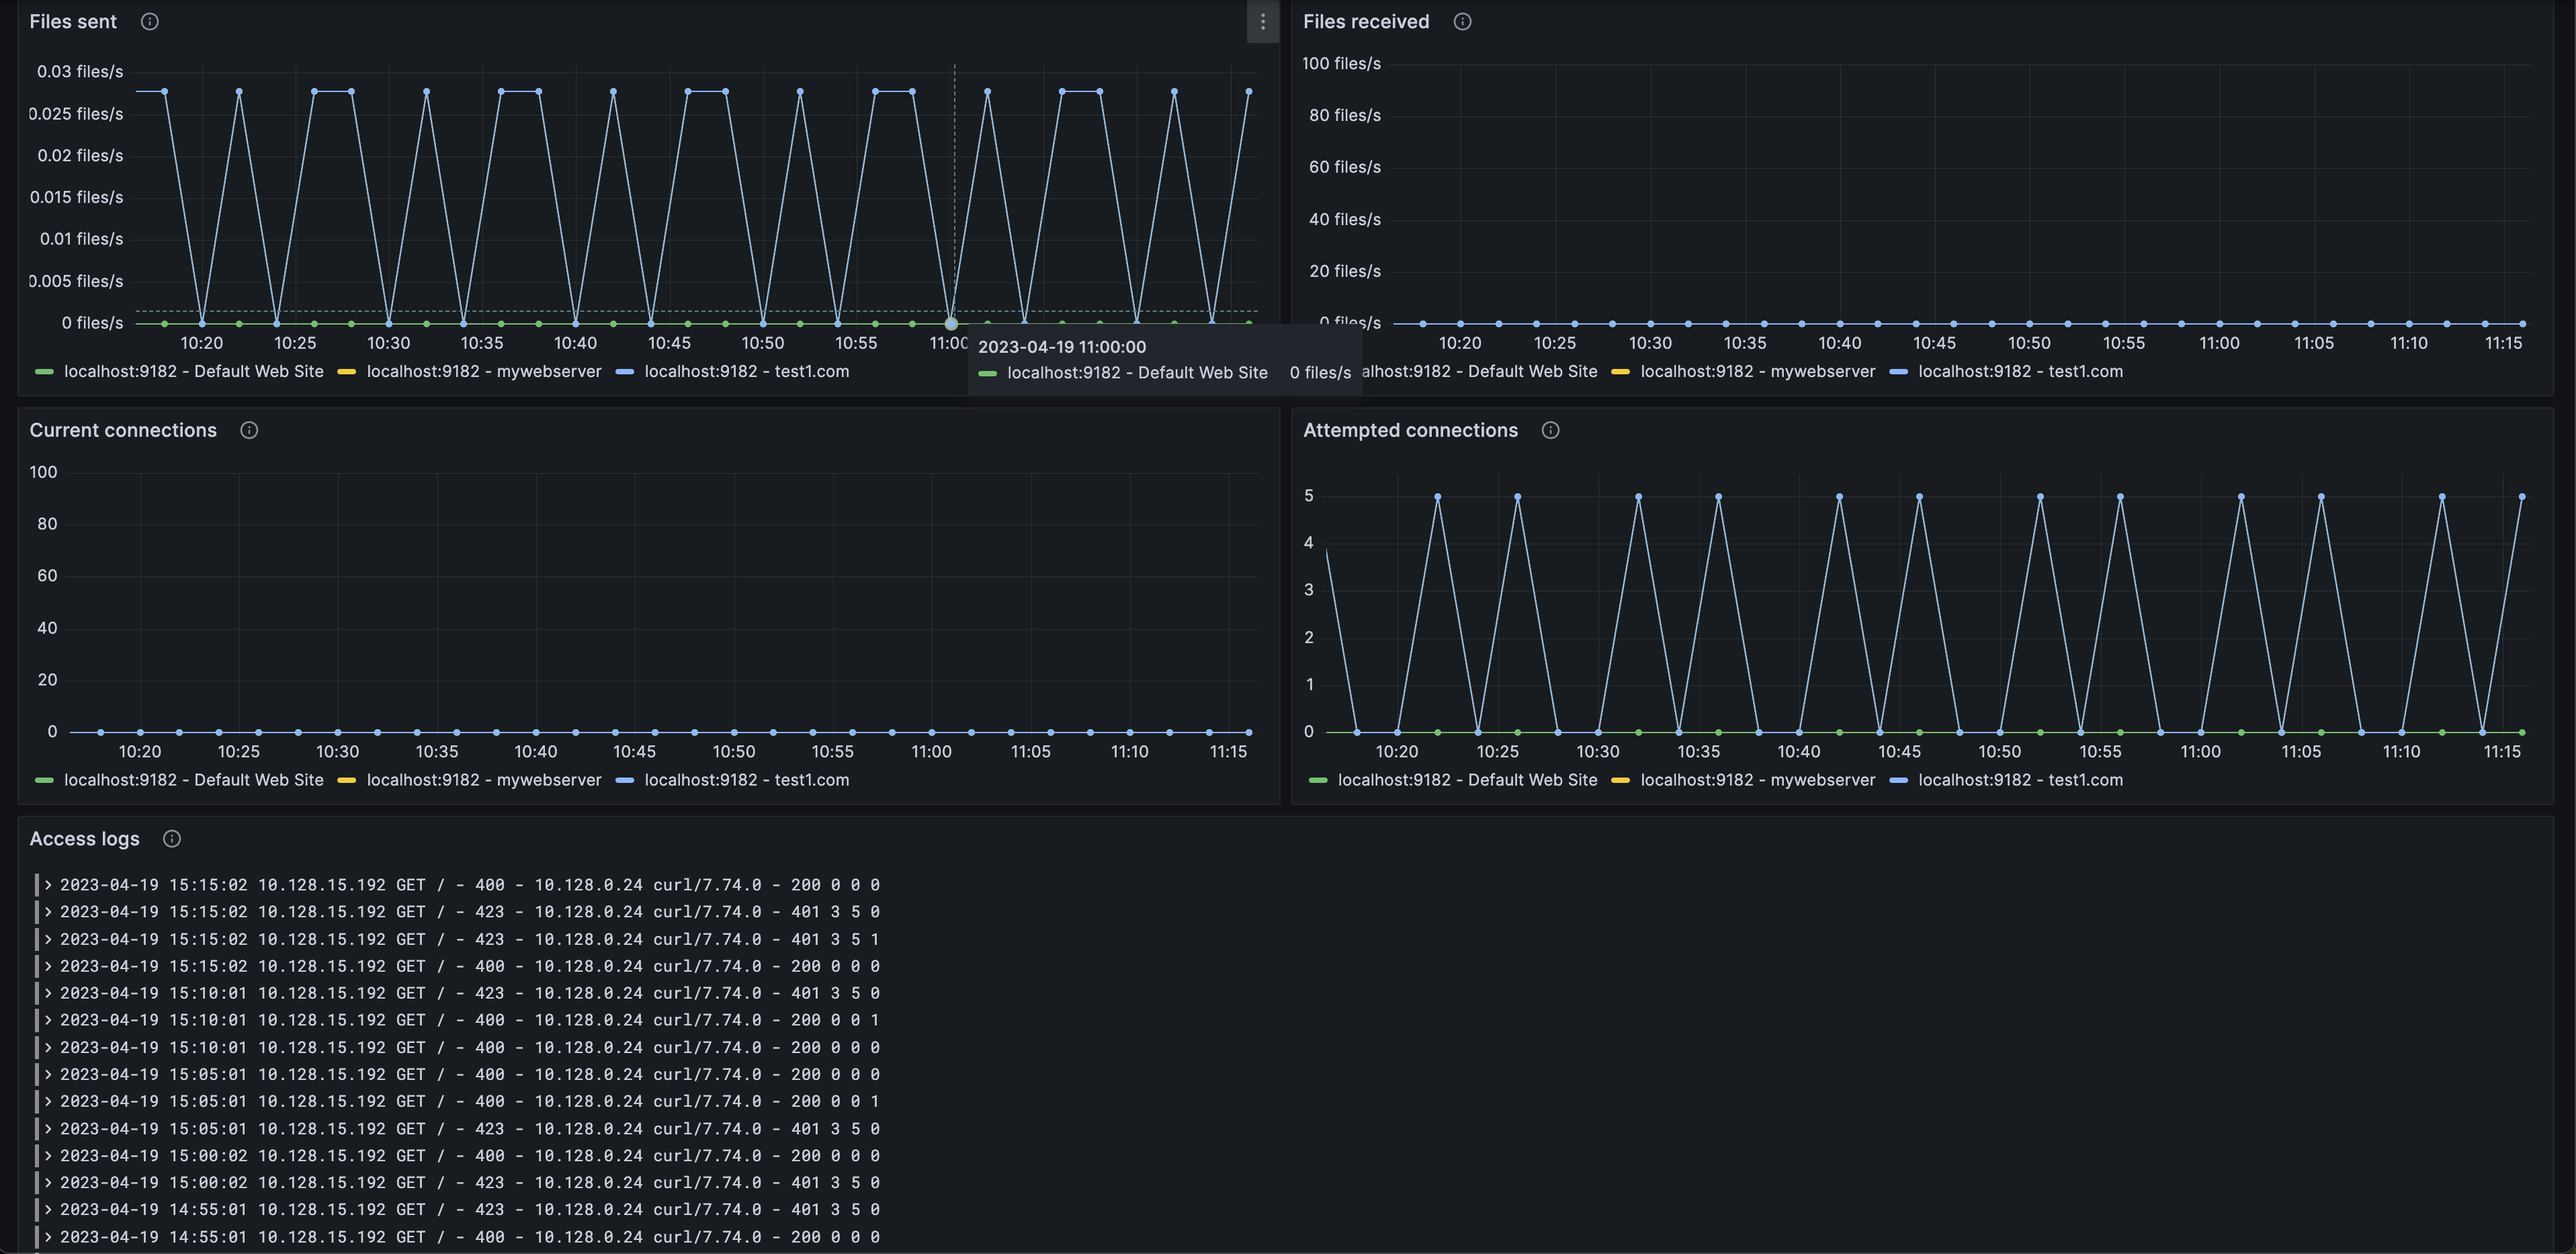
Microsoft IIS mixin is a set of configurable Grafana dashboards and alerts.
The Microsoft IIS mixin contains the following dashboards:
- Microsoft IIS overview
- Microsoft IIS applications
and the following alerts:
- MicrosoftIISHighNumberOfRejectedAsyncIORequests
- MicrosoftIISHighNumberOf5xxRequestErrors
- MicrosoftIISLowSuccessRateForWebsocketConnections
- MicrosoftIISThreadpoolUtilizationNearingMax
- MicrosoftIISHighNumberOfWorkerProcessFailures
Default thresholds can be configured in config,libsonnet
{
  _config+:: {
    alertsWarningHighRejectedAsyncIORequests: 20        // requests
    alertsCriticalHigh5xxRequests: 5,                   // # of 500 level requests
    alertsCriticalLowWebsocketConnectionSuccessRate: 80,// %
    alertsCriticalHighThreadPoolUtilization: 90,        // %
    alertsWarningHighWorkerProcessFailures: 10,         // failures
  },
}The Microsoft IIS overview dashboard provides details on traffic, connections, files sent/received, and access logs. Promtail and Loki needs to be installed and provisioned for logs with your Grafana instance. Microsoft IIS access logs can be found via this glob C:\inetpub\logs\LogFiles\W3SVC*\u_ex*.txt. There will typically be a folder W3SVC[siteID] for each site. Under that folder there will be a number of log files corresponding to each date (Example: u_ex230313.txt).
Microsoft IIS logs are enabled by default in the config.libsonnet and can be removed by setting enableLokiLogs to false. Then run make again to regenerate the dashboard:
{
  _config+:: {
    enableLokiLogs: false,
  },
}
The Microsoft IIS applications dashboard provides details on worker requests, websocket connections, thread utilization, and worker process failures.
MicrosoftIISHighNumberOfRejectedAsyncIORequests: There are a high number of rejected async I/O requests for a site. MicrosoftIISHighNumberOf5xxRequestErrors: There are a high number of 5xx request errors for an application. MicrosoftIISLowSuccessRateForWebsocketConnections: There is a low success rate for websocket connections for an application. MicrosoftIISThreadpoolUtilizationNearingMax: The thread pool utilization is nearing max capacity. MicrosoftIISHighNumberOfWorkerProcessFailures: There are a high number of worker process failures for an application.
go install github.com/jsonnet-bundler/jsonnet-bundler/cmd/jb@latest
go install github.com/monitoring-mixins/mixtool/cmd/mixtool@latest
# or in brew: brew install go-jsonnet
For linting and formatting, you would also need mixtool and jsonnetfmt installed. If you
have a working Go development environment, it's easiest to run the following:
go install github.com/google/go-jsonnet/cmd/jsonnetfmt@latestThe files in dashboards_out need to be imported
into your Grafana server. The exact details will be depending on your environment.
prometheus_alerts.yaml needs to be imported into Prometheus.
Edit config.libsonnet if required and then build JSON dashboard files for Grafana:
makeFor more advanced uses of mixins, see https://github.com/monitoring-mixins/docs.


