More info about Telegraf
The goal for this tutorial is to collect device uptime metric using Telegraf and SNMP.
Configure snmp community on R1 and R2
snmp-server community arista ro
Install snmp cli tool on the localhost:
$ sudo apt install snmp
And execute following command from localhost:
$ snmpwalk -v2c -c arista 192.168.10.1
and
$ snmpwalk -v2c -c arista 192.168.10.2
In the output you should see device support for multiple SNMP MIB-s.
Telegraf collects devices uptime using SNMP protocol and then exposes the metrics through the metrics endpoint. Prometheus scraps these metrics, and they can be visible on the graphs.
Run following command to start Telegraf and Prometheus containers:
$ docker-compose up
Once containers are started you can check if Telegraf is getting metrics by inspecting logs:
$ docker logs telegraf
2023-07-10T22:09:00Z I! Loading config: /etc/telegraf/telegraf.conf
2023-07-10T22:09:00Z I! Starting Telegraf 1.27.1
2023-07-10T22:09:00Z I! Available plugins: 237 inputs, 9 aggregators, 28 processors, 23 parsers, 59 outputs, 4 secret-stores
2023-07-10T22:09:00Z I! Loaded inputs: snmp (2x)
2023-07-10T22:09:00Z I! Loaded aggregators:
2023-07-10T22:09:00Z I! Loaded processors:
2023-07-10T22:09:00Z I! Loaded secretstores:
2023-07-10T22:09:00Z I! Loaded outputs: file prometheus_client
2023-07-10T22:09:00Z I! Tags enabled: host=telegraf
2023-07-10T22:09:00Z I! [agent] Config: Interval:30s, Quiet:false, Hostname:"telegraf", Flush Interval:10s
2023-07-10T22:09:00Z I! [outputs.prometheus_client] Listening on http://[::]:9126/metrics
snmp,agent_host=192.168.10.1,host=telegraf uptime=5372i 1689026970000000000
snmp,agent_host=192.168.10.2,host=telegraf uptime=255i 1689026970000000000

<...>
Note: It can take few mins before metrics are collected
Navigate to Prometheus and meke sure you see Telgraf target in UP state.
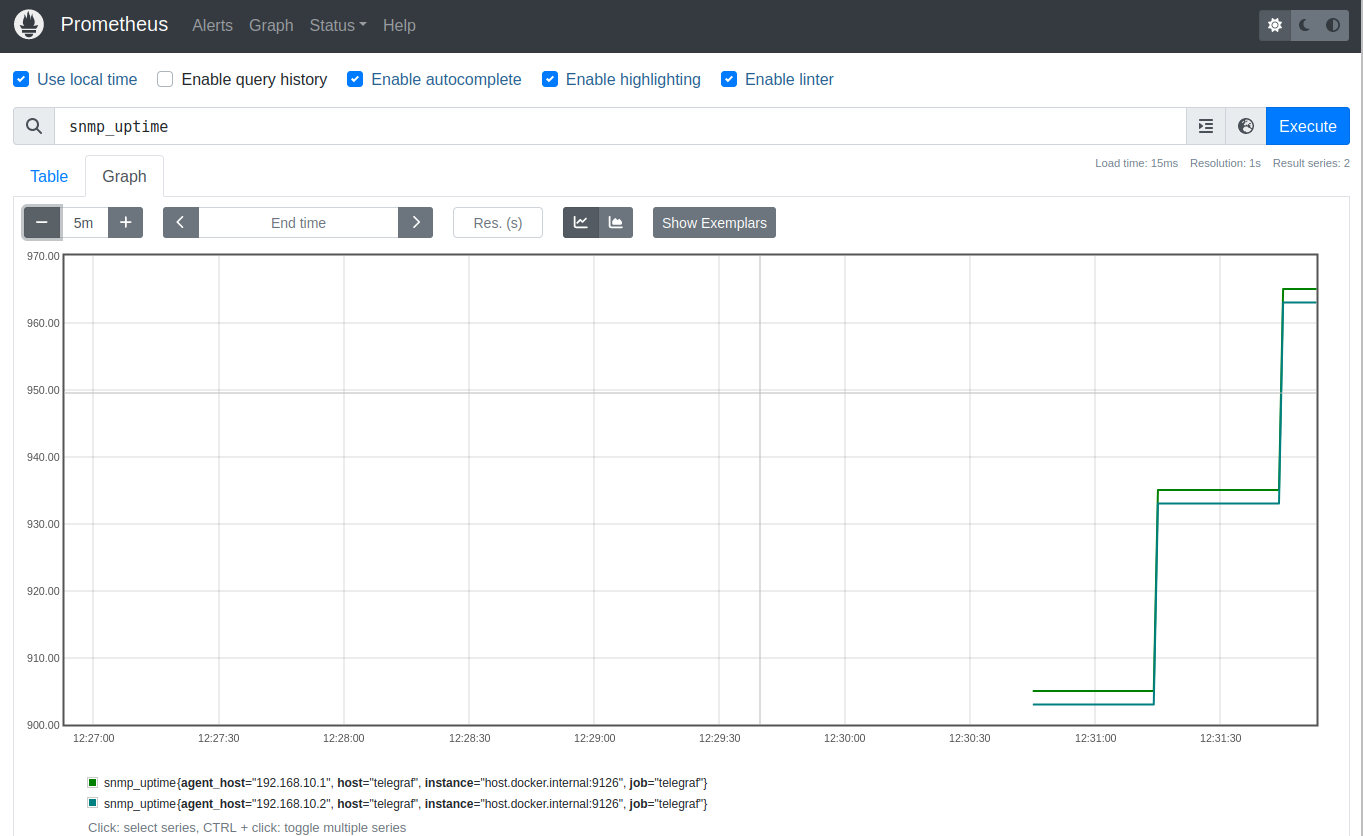
Next navigate to Prometheus and search for snmp_uptime metric like this:
Note: You can narrow down the time frame to 5-10 mins to get better visibility on the graph
This was the most basic example using Telegraf, but it is a very sophisticated tool that allows collecting metrics not only from network devices but many other systems.
