Collecting metrics using Telegraf and Prometheus is great, but without proper visualization it is not that useful. Obviously using prometheus query language(promQL) could be used directly form Prometheus instance, but still it is much more intuitive to look at Grafana UI.
In this tutorial, metrics around uptime, CPU, memory, interfaces are being collected from R1 and R2, passed to Prometheus and finally presented in Grafana UI. There no much more work to be done then just run following command:
$ docker-compose up
After few minutes, collected metrics should be nicely presented in the Grafana UI.
Note: Provide
admin/adminlogin and password and skip the step asking for changing the password.
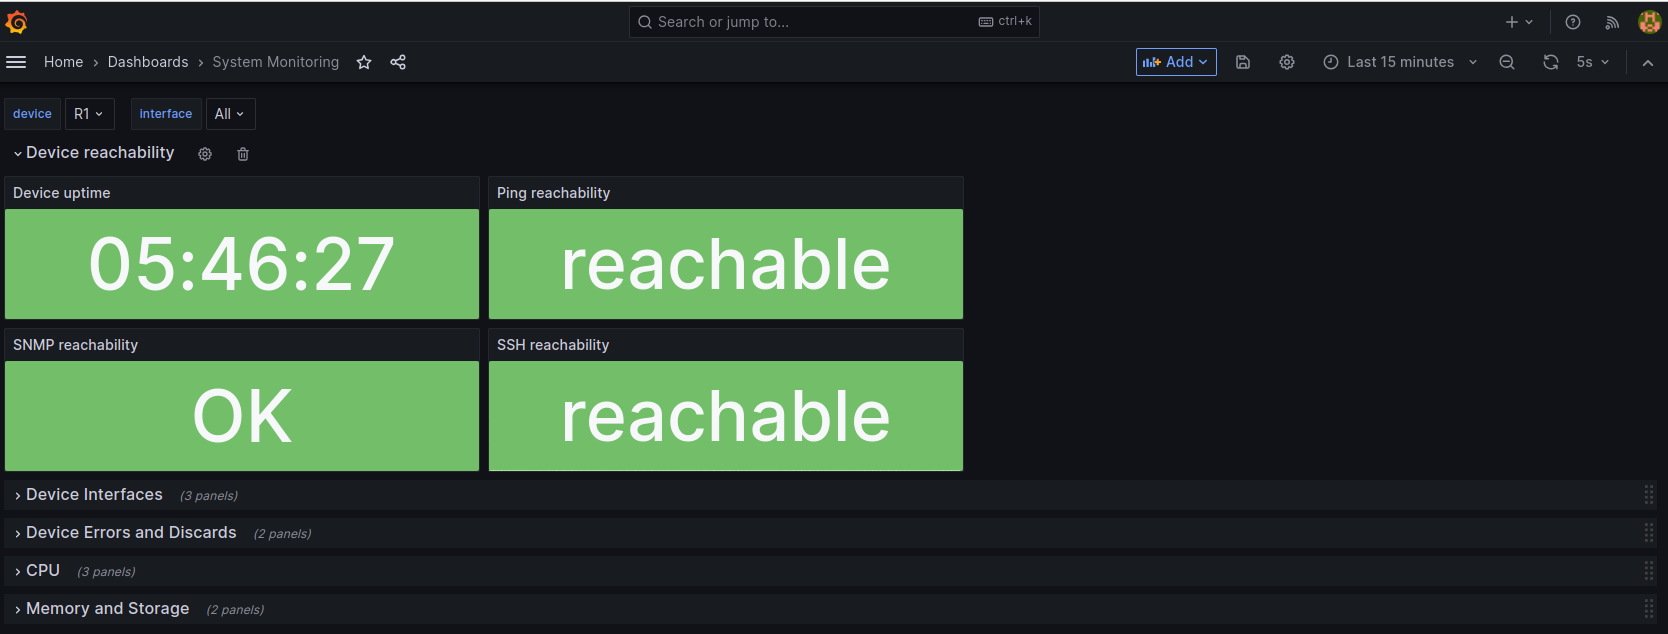
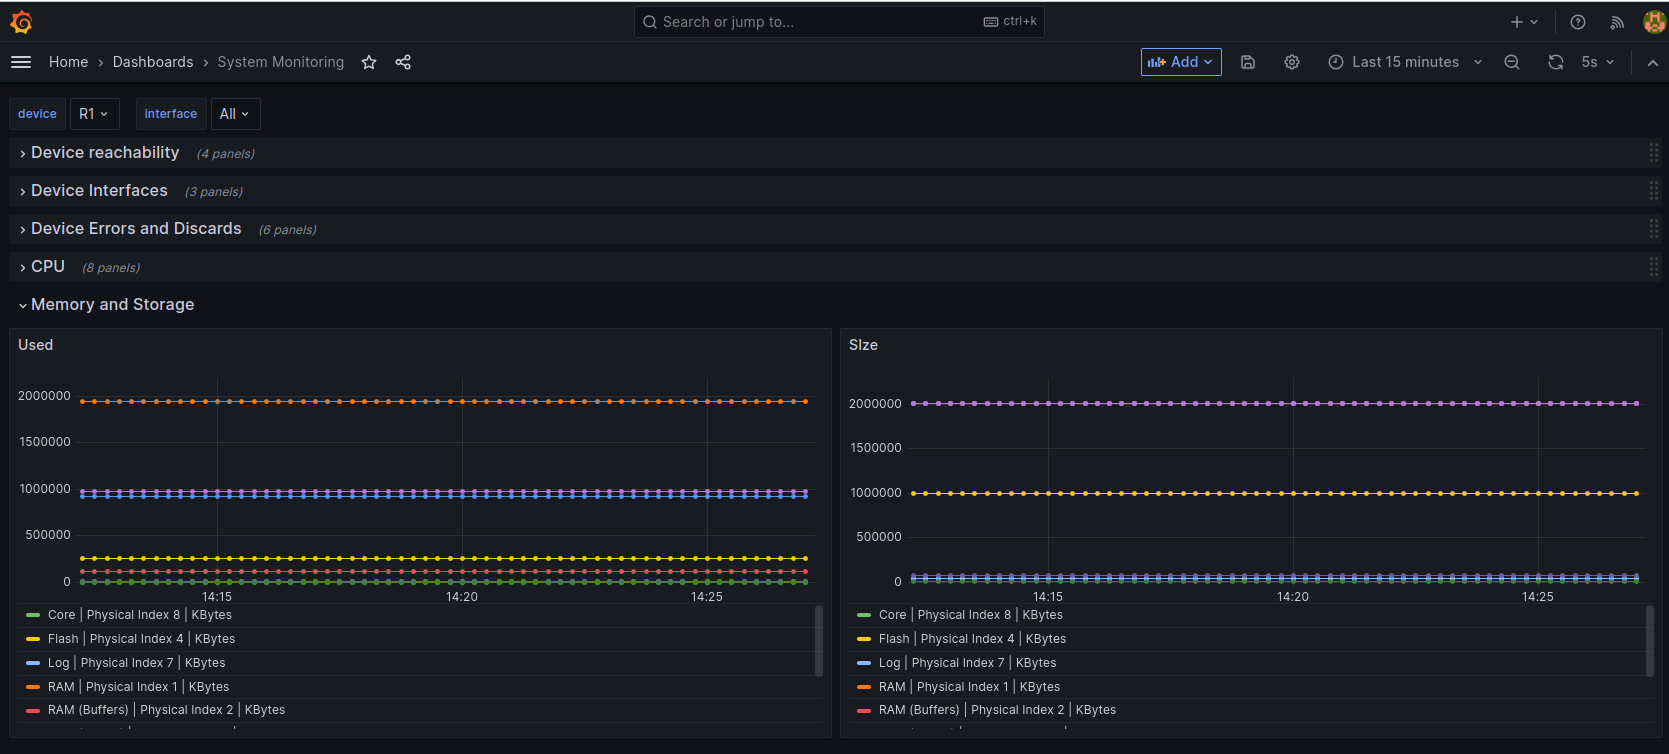
From Grafana home page navigate to Home > Dashboards > System Monitoring and you should see similar view as this one:
Try expanding the panels by clicking on each description:
Device reachability
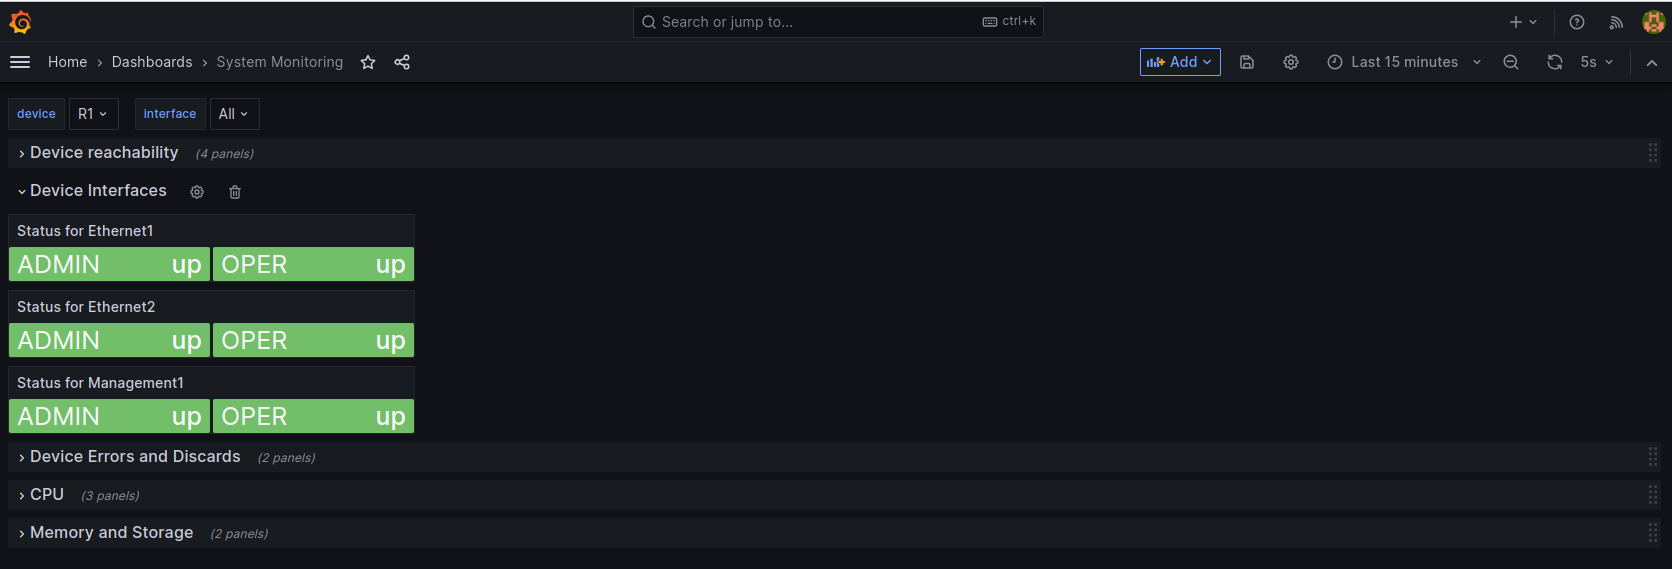
Device interfaces
Note: You can filter list of interfaces by picking adequate interface at the top of the dashboard.
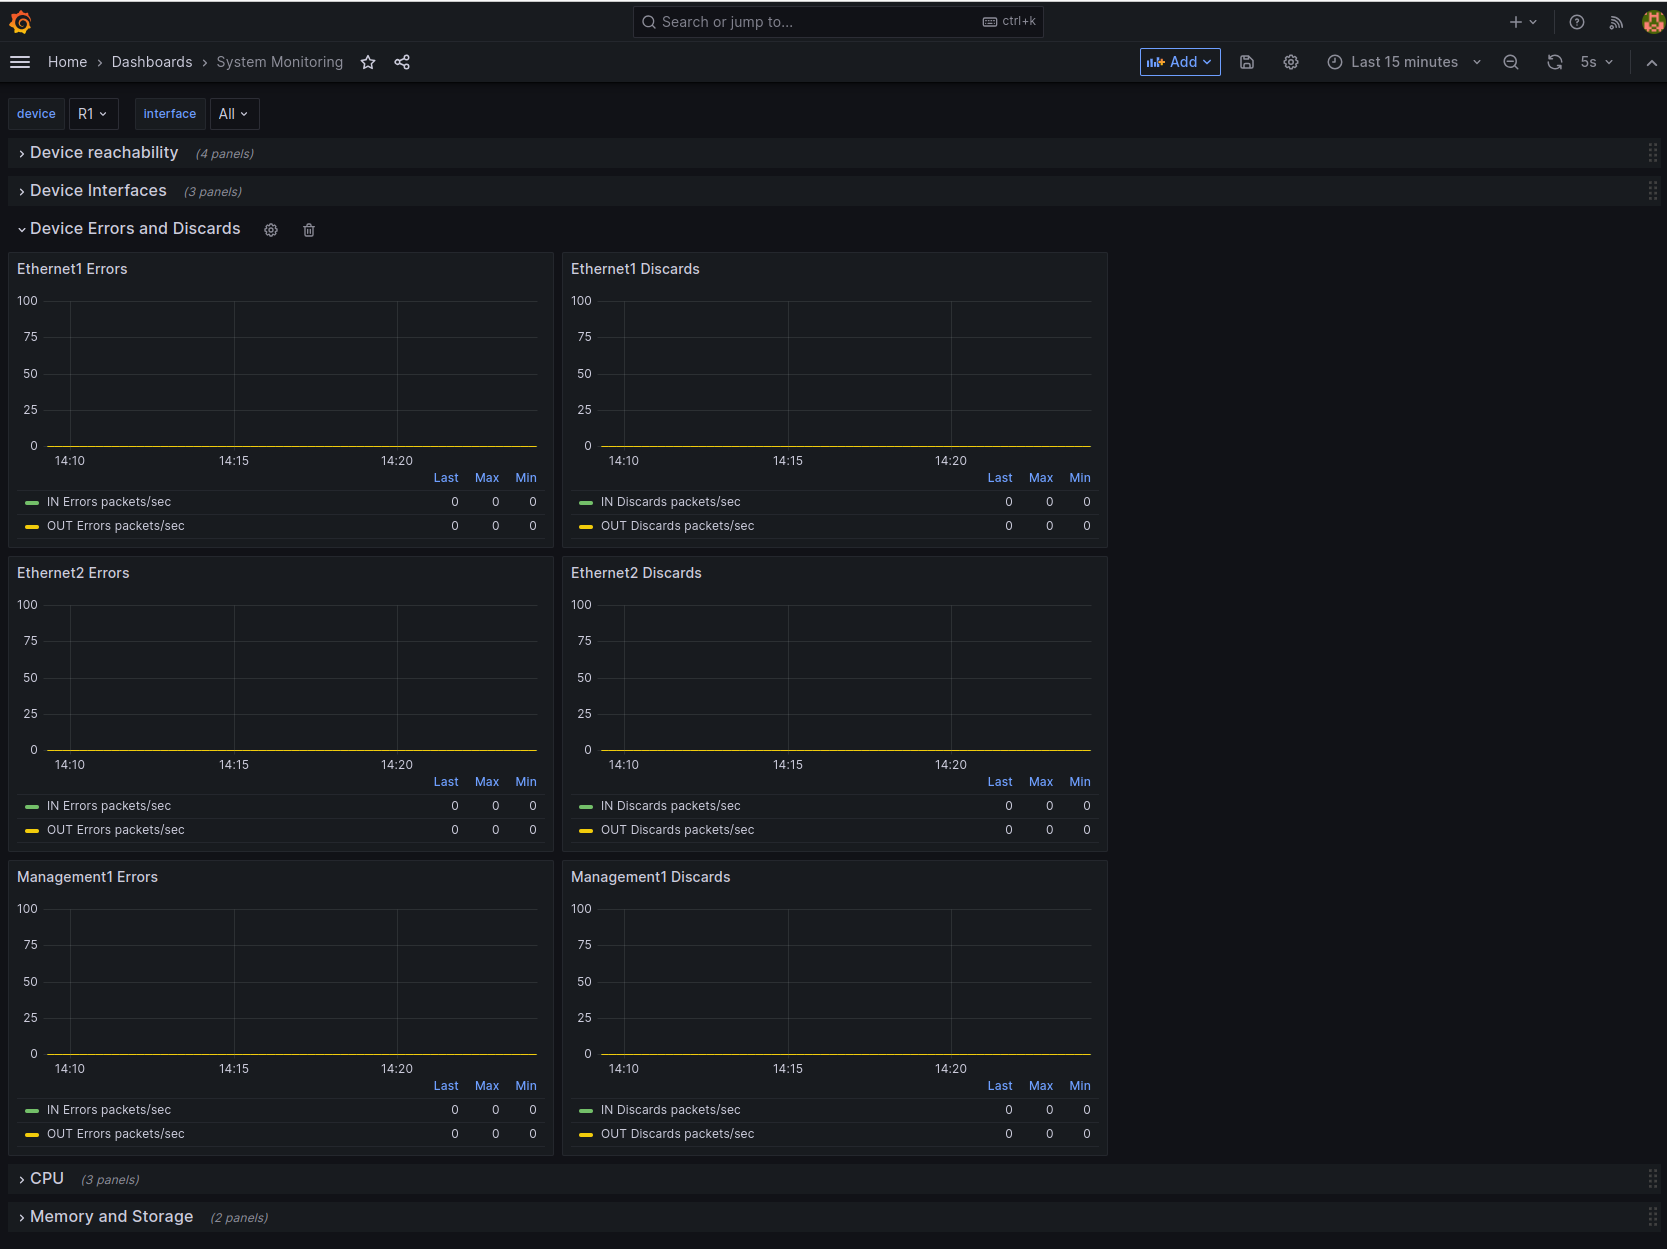
Device errors
Note: Since we are using lab setup, there are no errors or discards visible
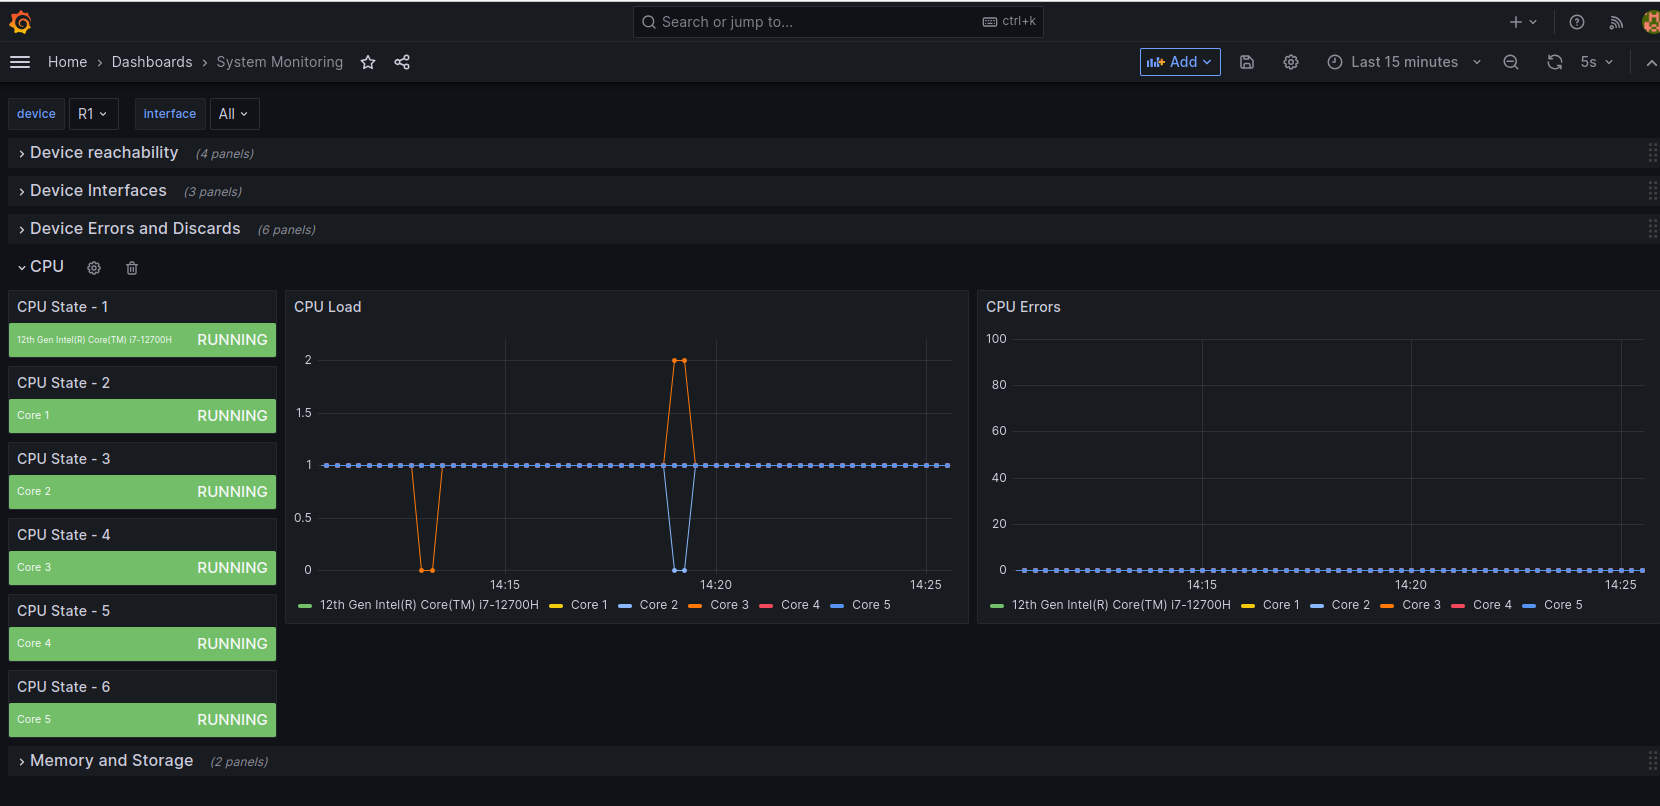
CPU
Memory
Grafana is great tool to be used with networking metrics and definitely help with monitoring networking devices, but also many others like visualize alerts or troubleshoot services degradation in particular region and so on.

