Hexagon grid with Plot - How? #2262
-
|
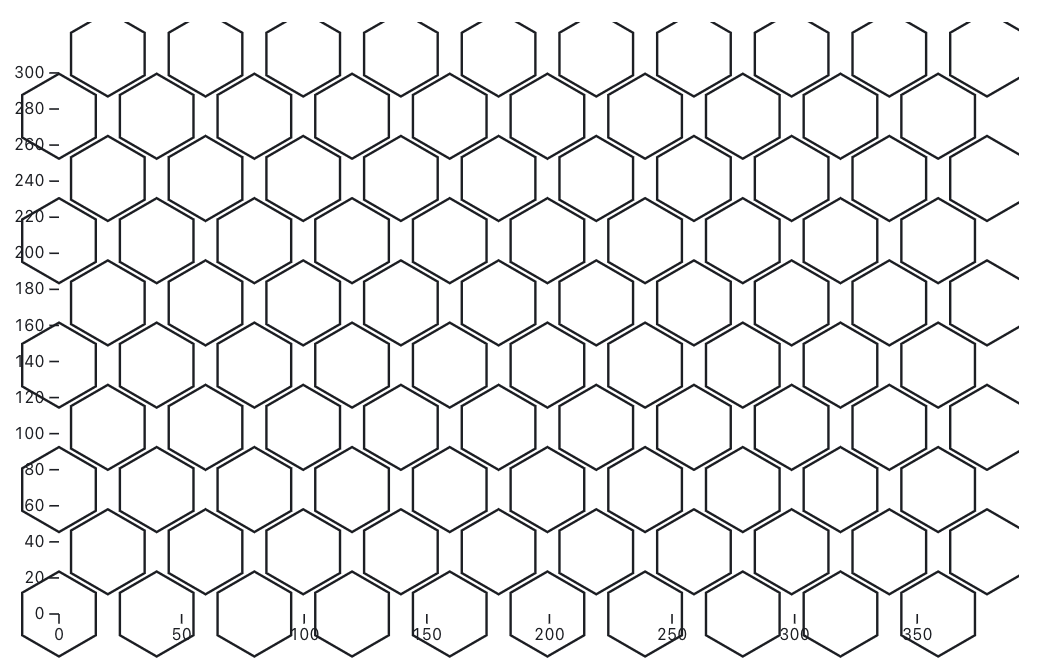
Hi, I would like to use Observable Plot to draw maps consisting of hexagons. I have already calculated the axial coordinates of the hexagon marks, and would like to draw the grid without using the hexbin transform (or any other transforms). Here is my attempt so far: // Parameters
const cols = 10; // Number of columns (axial q)
const rows = 10; // Number of rows (axial r)
const radius = 23; // Radius of hexagons
const bins = [];
// Generate axial coordinates
for (let q = 0; q < cols; q++) {
for (let r = 0; r < rows; r++) {
bins.push({ q, r });
}
}
return Plot.plot({
marks: [
Plot.hexagon(bins, {
r: radius, // Hexagon radius
x: (d) => Math.sqrt(3) * radius * (d.q + ((d.r / 2) % 1)), // Horizontal position
y: (d) => 1.5 * radius * d.r // Vertical position
})
]
});I also created a notebook for this: As you can see, I am struggling with setting the hexagon radius, and x, y mapping function in order to align it perfectly. I'd appreciate any help in the right direction. Thanks. |
Beta Was this translation helpful? Give feedback.
Replies: 2 comments 2 replies
-
|
Your notebook appears to be private, but from your screenshot I'm guessing that the ratios of the x and y axis don't match. You may also want to take a look at the implementation of the Hexgrid mark to compare notes. |
Beta Was this translation helpful? Give feedback.
-
|
You either need to specify the hexagon grid in abstract coordinates and project them (either using a scale or a projection), or you need to compute the hexagon grid in screen coordinates. If you want to use screen coordinates, you could use identity scales, which effectively disables the x and y scales. Plot.plot({
x: { type: "identity" },
y: { type: "identity" },
marks: [
Plot.hexagon(d3.cross(d3.range(2, 16), d3.range(2, 11)), {
r: radius, // Hexagon radius
x: ([i, j]) => radius * (2 * i + (j) % 2), // Horizontal position
y: ([i, j]) => radius * Math.sqrt(3) * j // Vertical position
})
]
})If you want to use abstract coordinates, you could use a geo mark to draw polygons instead of the hexagon mark. You then supply the geo mark with the appropriate Polygon geometry objects. If you want the hexagons to not appear squished, you should also set the aspectRatio to 1, or choose an appropriate projection. Plot.plot({
aspectRatio: 1,
marks: [
Plot.geo(
d3.cross(d3.range(2, 16), d3.range(2, 11)).map(([i, j]) => {
const cx = i * 1.5;
const cy = (j - (i % 2) / 2) * Math.sqrt(3);
const ring = [];
for (let i = 0; i <= 6; ++i) {
const a = (i / 3) * Math.PI;
ring.push([cx + Math.cos(a), cy + Math.sin(a)]);
}
return {type: "Polygon", coordinates: [ring]};
})
)
]
}) |
Beta Was this translation helpful? Give feedback.


You either need to specify the hexagon grid in abstract coordinates and project them (either using a scale or a projection), or you need to compute the hexagon grid in screen coordinates.
If you want to use screen coordinates, you could use identity scales, which effectively disables the x and y scales.
If you want to use abstract coordinates, you could use a geo m…