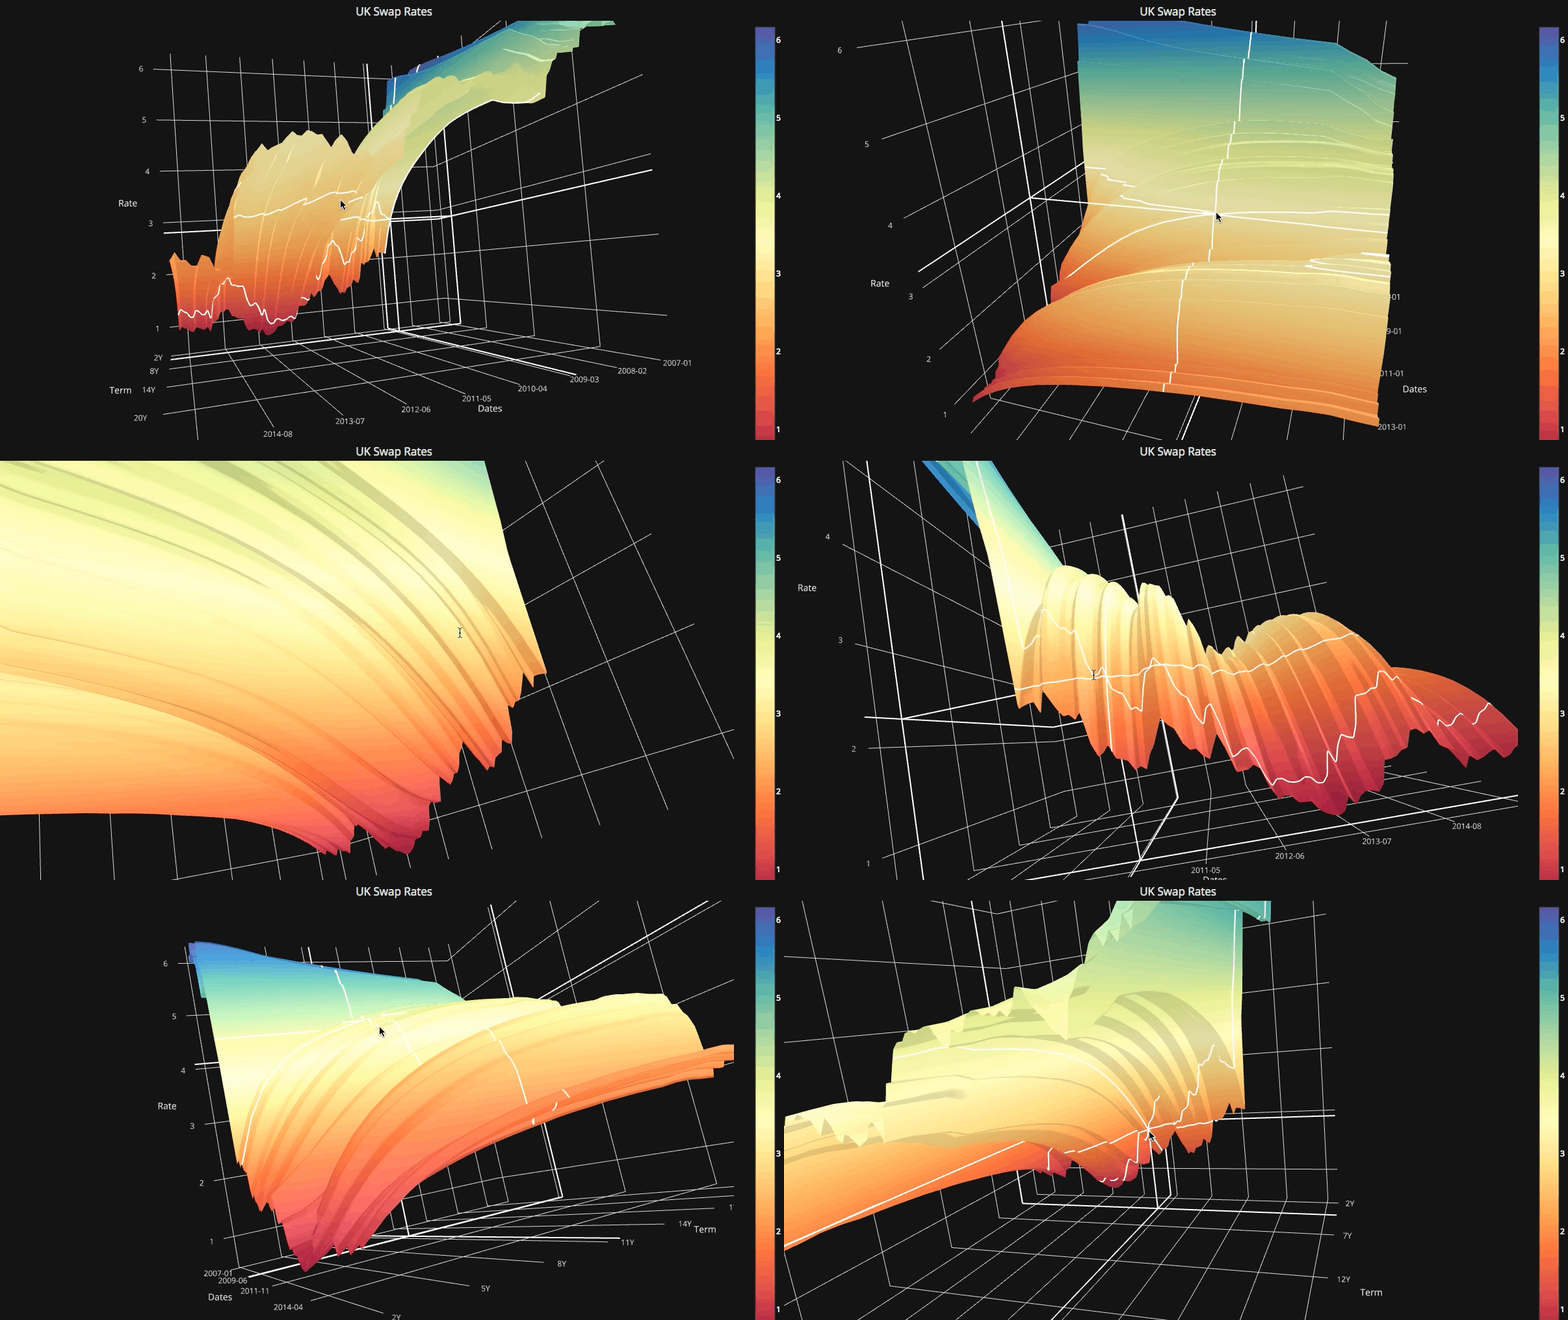
This library binds the power of plotly with the flexibility of pandas for easy plotting.
This library is available on https://github.com/santosjorge/cufflinks
This tutorial assumes that the plotly user credentials have already been configured as stated on the getting started guide.
** Note: ** This version requires TALib to be installed separately.
brew install ta-lib
QuantFigureis a new class that will generate a graph object with persistence. Parameters can be added/modified at any given point.
This can be as easy as:
df=cf.datagen.ohlc()
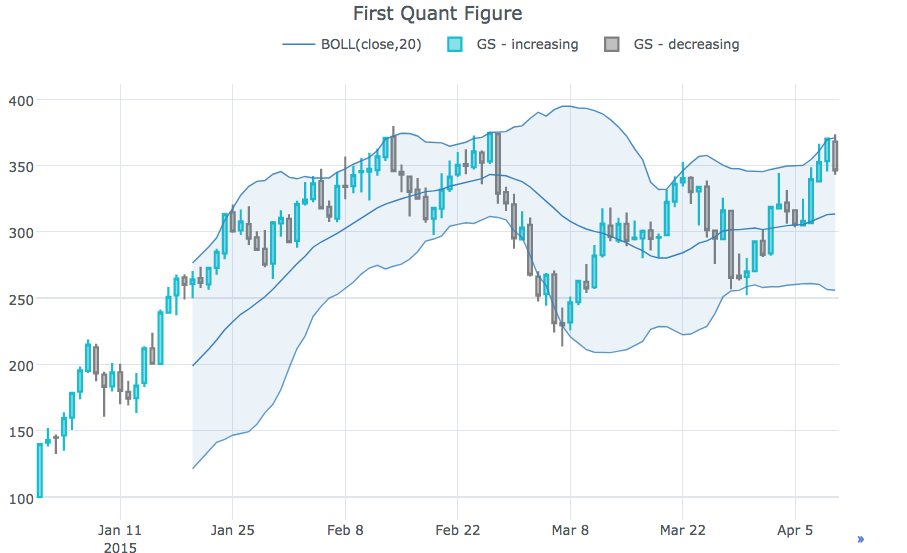
qf=cf.QuantFig(df,title='First Quant Figure',legend='top',name='GS')
qf.add_bollinger_bands()
qf.iplot()- Technical Analysis Studies can be added on demand.
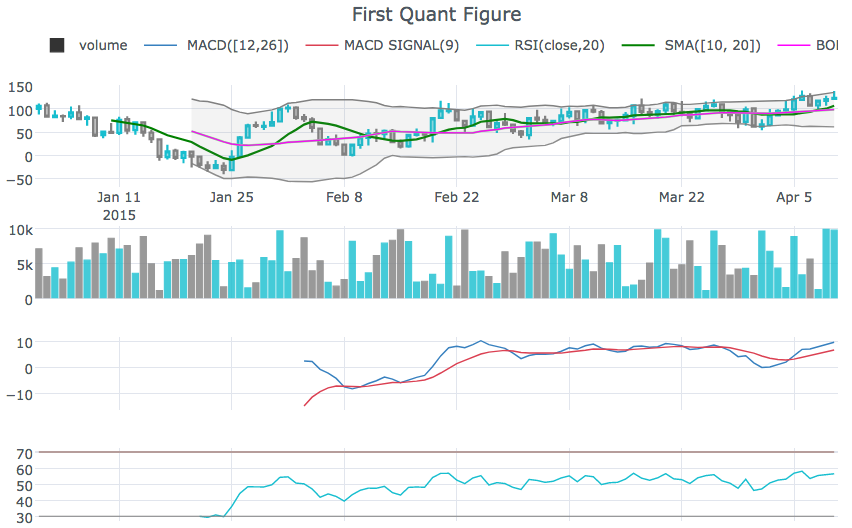
qf.add_sma([10,20],width=2,color=['green','lightgreen'],legendgroup=True)
qf.add_rsi(periods=20,color='java')
qf.add_bollinger_bands(periods=20,boll_std=2,colors=['magenta','grey'],fill=True)
qf.add_volume()
qf.add_macd()
qf.iplot()rangsliderto display a date range slider at the bottomcf.datagen.ohlc().iplot(kind='candle',rangeslider=True)
rangeselectorto display buttons to change the date range displayedcf.datagen.ohlc(500).iplot(kind='candle', rangeselector={ 'steps':['1y','2 months','5 weeks','ytd','2mtd','reset'], 'bgcolor' : ('grey',.3), 'x': 0.3 , 'y' : 0.95})
- Customise annotions, with
fontsize,fontcolor,textangle- Label mode
cf.datagen.lines(1,mode='stocks').iplot(kind='line', annotations={'2015-02-02':'Market Crash', '2015-03-01':'Recovery'}, textangle=-70,fontsize=13,fontcolor='grey')
- Explicit mode
cf.datagen.lines(1,mode='stocks').iplot(kind='line', annotations=[{'text':'exactly here','x':'0.2', 'xref':'paper','arrowhead':2, 'textangle':-10,'ay':150,'arrowcolor':'red'}])
- Label mode
Figure.iplot()to plot figures- New high performing candle and ohlc plots
cf.datagen.ohlc().iplot(kind='candle')
- 'cf.datagen.choropleth()' to for sample choropleth data.
- 'cf.datagen.scattergeo()' to for sample scattergeo data.
- Support for choropleth and scattergeo figures in
iplot - 'cf.get_colorscale' for maps and plotly objects that support colorscales
xrange,yrangeandzrangecan be specified iniplotandgetLayoutcf.datagen.lines(1).iplot(yrange=[5,15])
layout_updatecan be set iniplotandgetLayoutto explicitly update anyLayoutvalue
- Support for Python 3
- Support for pie charts
cf.datagen.pie().iplot(kind='pie',labels='labels',values='values')
- Generate Open, High, Low, Close data
datagen.ohlc()
- Candle Charts support
ohlc=cf.datagen.ohlc()
ohlc.iplot(kind='candle',up_color='blue',down_color='red')
- OHLC (Bar) Charts support
ohlc=cf.datagen.ohlc()
ohlc.iplot(kind='ohlc',up_color='blue',down_color='red')
- Support for logarithmic charts ( logx | logy )
df=pd.DataFrame([x**2] for x in range(100))
df.iplot(kind='lines',logy=True)
- Support for MulitIndex DataFrames
- Support for Error Bars ( error_x | error_y )
cf.datagen.lines(1,5).iplot(kind='bar',error_y=[1,2,3.5,2,2])cf.datagen.lines(1,5).iplot(kind='bar',error_y=20, error_type='percent')
- Support for continuous error bars
cf.datagen.lines(1).iplot(kind='lines',error_y=20,error_type='continuous_percent')cf.datagen.lines(1).iplot(kind='lines',error_y=10,error_type='continuous',color='blue')
- Technical Analysis Studies for Timeseries (beta)
- Simple Moving Averages (SMA)
cf.datagen.lines(1,500).ta_plot(study='sma',periods=[13,21,55])
- Relative Strength Indicator (RSI)
cf.datagen.lines(1,200).ta_plot(study='boll',periods=14)
- Bollinger Bands (BOLL)
cf.datagen.lines(1,200).ta_plot(study='rsi',periods=14)
- Moving Average Convergence Divergence (MACD)
cf.datagen.lines(1,200).ta_plot(study='macd',fast_period=12,slow_period=26, signal_period=9)
- Simple Moving Averages (SMA)
- Support of offline charts
cf.go_offline()cf.go_online()cf.iplot(figure,online=True)(To force online whilst on offline mode)
- Support for secondary axis
fig=cf.datagen.lines(3,columns=['a','b','c']).figure()
fig=fig.set_axis('b',side='right')
cf.iplot(fig)
- Support for global theme setting
cufflinks.set_config_file(theme='pearl')
- New theme ggplot
cufflinks.datagen.lines(5).iplot(theme='ggplot')
- Support for horizontal bar charts barh
cufflinks.datagen.lines(2).iplot(kind='barh',barmode='stack',bargap=.1)
- Support for histogram orientation and normalization
cufflinks.datagen.histogram().iplot(kind='histogram',orientation='h',norm='probability')
- Support for area plots
cufflinks.datagen.lines(4).iplot(kind='area',fill=True,opacity=1)
- Support for subplots
cufflinks.datagen.histogram(4).iplot(kind='histogram',subplots=True,bins=50)cufflinks.datagen.lines(4).iplot(subplots=True,shape=(4,1),shared_xaxes=True,vertical_spacing=.02,fill=True)
- Support for scatter matrix to display the distribution amongst every series in the DataFrame
cufflinks.datagen.lines(4,1000).scatter_matrix()
- Support for vline and hline for horizontal and vertical lines
cufflinks.datagen.lines(3).iplot(hline=[2,3])cufflinks.datagen.lines(3).iplot(hline=dict(y=2,color='blue',width=3))
- Support for vspan and hspan for horizontal and vertical areas
cufflinks.datagen.lines(3).iplot(hspan=(-1,2))cufflinks.datagen.lines(3).iplot(hspan=dict(y0=-1,y1=2,color='orange',fill=True,opacity=.4))
- Global setting for public charts
cufflinks.set_config_file(world_readable=True)
- Enhanced Spread charts
cufflinks.datagen.lines(2).iplot(kind='spread')
- Support for Heatmap charts
cufflinks.datagen.heatmap().iplot(kind='heatmap')
- Support for Bubble charts
cufflinks.datagen.bubble(4).iplot(kind='bubble',x='x',y='y',text='text',size='size',categories='categories')
- Support for Bubble3d charts
cufflinks.datagen.bubble3d(4).iplot(kind='bubble3d',x='x',y='y',z='z',text='text',size='size',categories='categories')
- Support for Box charts
cufflinks.datagen.box().iplot(kind='box')
- Support for Surface charts
cufflinks.datagen.surface().iplot(kind='surface')
- Support for Scatter3d charts
cufflinks.datagen.scatter3d().iplot(kind='scatter3d',x='x',y='y',z='z',text='text',categories='categories')
- Support for Histograms
cufflinks.datagen.histogram(2).iplot(kind='histogram')
- Data generation for most common plot types
cufflinks.datagen
- Data extraction: Extract data from any Plotly chart. Data is delivered in DataFrame
cufflinks.to_df(Figure)
- Integration with colorlover
- Support for scales
iplot(colorscale='accent')to plot a chart using an accent color scale - cufflinks.scales() to see all available scales
- Support for scales
- Support for named colors
*
iplot(colors=['pink','red','yellow'])


