| title | keywords | description | ||||
|---|---|---|---|---|---|---|
prometheus |
|
This document contains information about the Apache APISIX prometheus Plugin. |
The prometheus Plugin exports metrics in Prometheus exposition format.
| Name | Type | Required | Default | Description |
|---|---|---|---|---|
| prefer_name | boolean | False | false | When set to true, prints Route/Service name instead of ID in Prometheus metric. |
You can change the default export URI by configuring the export_uri attribute under plugin_attr in your configuration file (conf/config.yaml).
| Name | Type | Default | Description |
|---|---|---|---|
| export_uri | string | "/apisix/prometheus/metrics" | URI to export the Prometheus metrics. |
Here is a configuration example:
plugin_attr:
  prometheus:
export_uri: /apisix/metricsFor http request related metrics, you could specify extra labels, which match the APISIX variables.
If you specify label for nonexist APISIX variable, the label value would be "".
Currently, only below metrics are supported:
- http_status
- http_latency
- bandwidth
Here is a configuration example:
plugin_attr:
  prometheus:
    metrics:
        http_status:
            extra_labels:
                - upstream_addr: $upstream_addr
- upstream_status: $upstream_statusThis Plugin will add the API endpoint /apisix/prometheus/metrics or your custom export URI for exposing the metrics.
These metrics are exposed by a separate Prometheus server address. By default, the address is 127.0.0.1:9091. You can change it in your configuration file (conf/config.yaml):
plugin_attr:
  prometheus:
    export_addr:
      ip: ${{INTRANET_IP}}
      port: 9092
Now, if the environment variable INTRANET_IP is 172.1.1.1, APISIX will export the metrics via 172.1.1.1:9092.
If you still want to expose the metrics via the data plane port (default: 9080), you can configure it as shown below:
plugin_attr:
  prometheus:
    enable_export_server: false
You can then expose it by using the public-api Plugin.
:::info IMPORTANT
If the Prometheus plugin collects too many metrics, it will take CPU resources to calculate the metric data when getting the metrics via URI, which may affect APISIX to process normal requests. To solve this problem, APISIX exposes the URI and calculates the metrics in the privileged agent. If the URI is exposed using the public-api plugin, then APISIX will calculate the metric data in a normal worker process, which may still affect APISIX processing of normal requests.
This feature requires APISIX to run on APISIX-Base.
:::
The prometheus Plugin can be enabled with an empty table.
The example below shows how you can configure the Plugin on a specific Route:
curl http://127.0.0.1:9180/apisix/admin/routes/1  -H 'X-API-KEY: edd1c9f034335f136f87ad84b625c8f1' -X PUT -d '
{
    "uri": "/hello",
    "plugins": {
        "prometheus":{}
    },
    "upstream": {
        "type": "roundrobin",
        "nodes": {
            "127.0.0.1:80": 1
        }
    }
}'
:::note
When prefer_name is set to true make sure to not duplicate names for multiple Routes/Services or it could be misleading.
:::
You can fetch the metrics from the specified export URI (default: /apisix/prometheus/metrics):
curl -i http://127.0.0.1:9091/apisix/prometheus/metricsYou can add this address to Prometheus to fetch the data:
scrape_configs:
  - job_name: "apisix"
    scrape_interval: 15s # This value will be related to the time range of the rate function in Prometheus QL. The time range in the rate function should be at least twice this value.
    metrics_path: "/apisix/prometheus/metrics"
    static_configs:
      - targets: ["127.0.0.1:9091"]
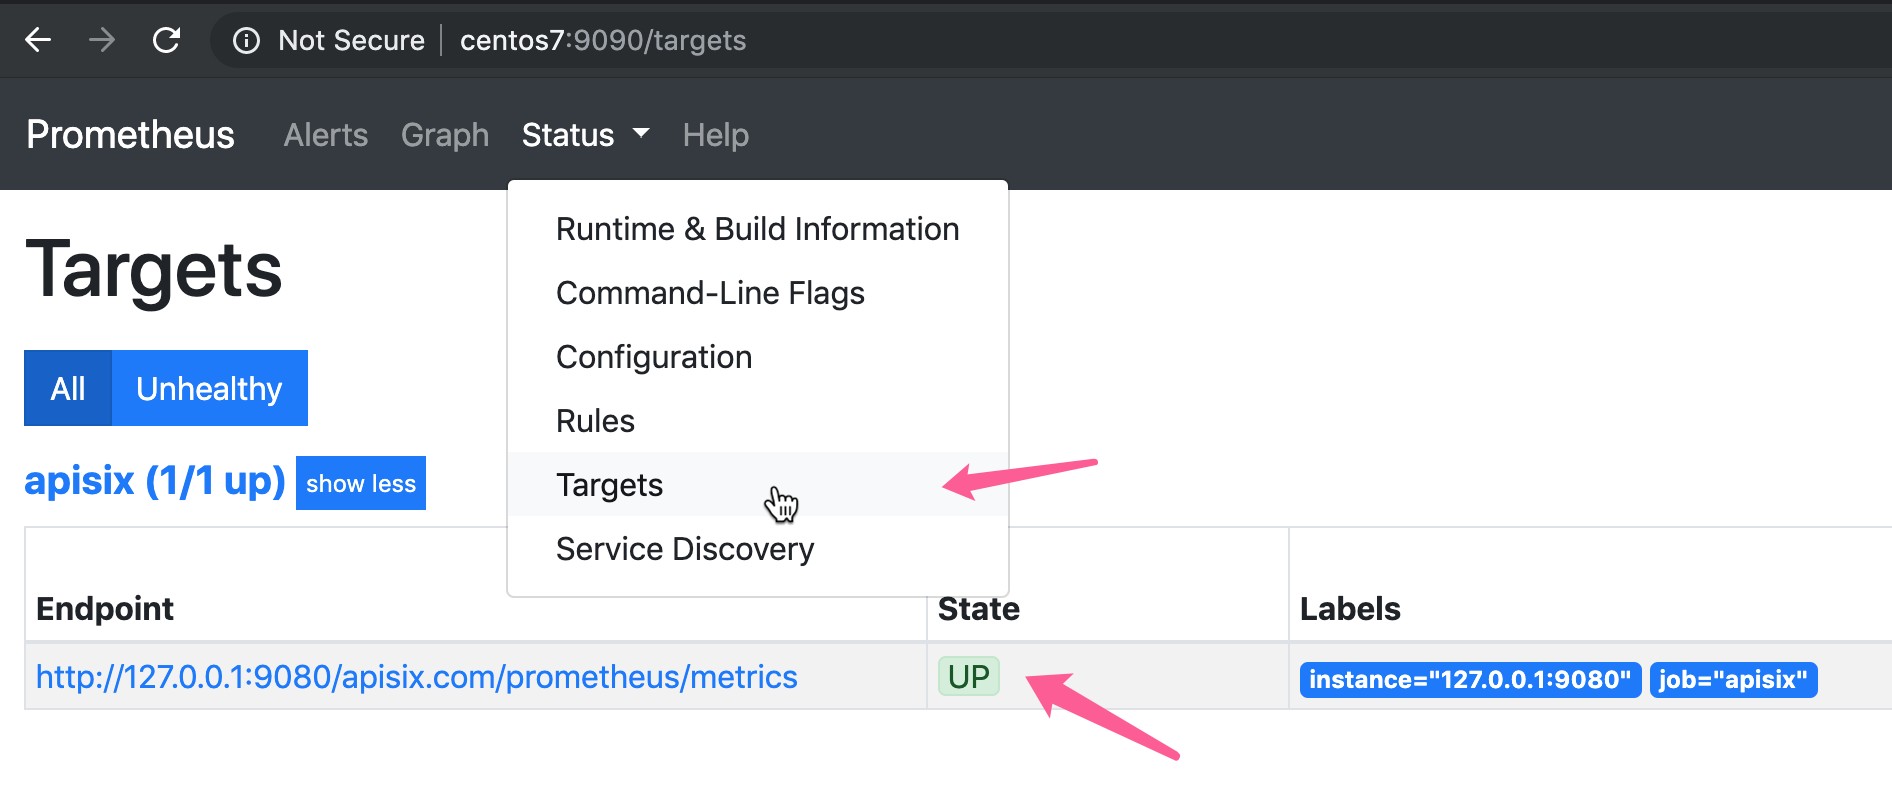
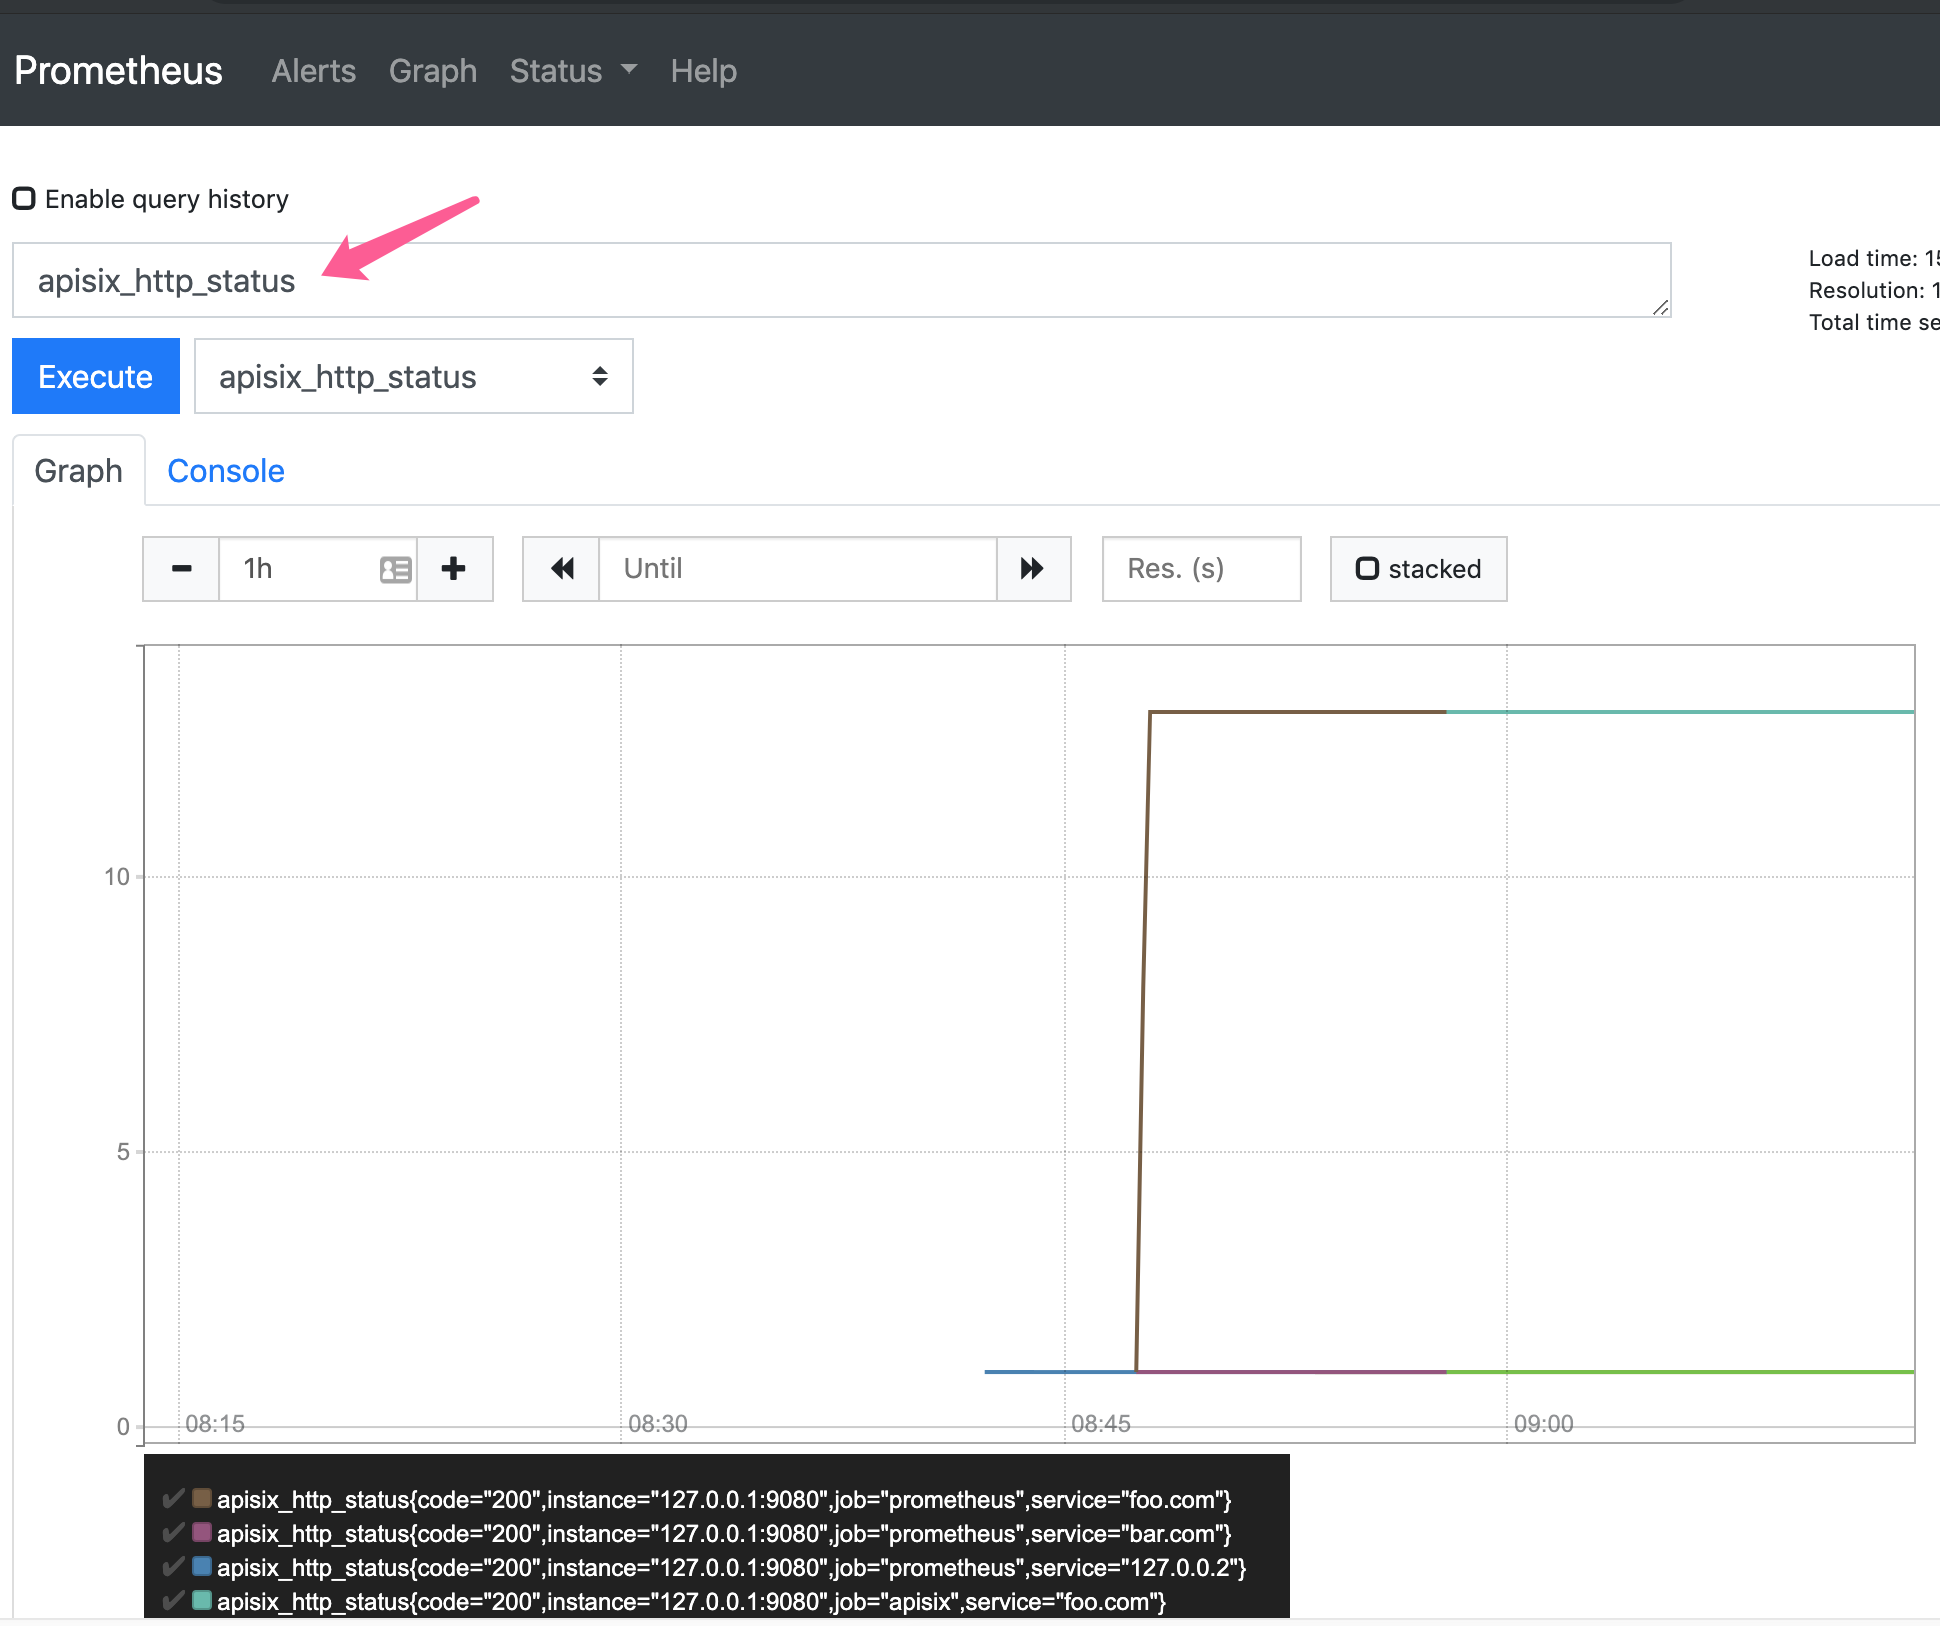
Now, you will be able to check the status in your Prometheus console:
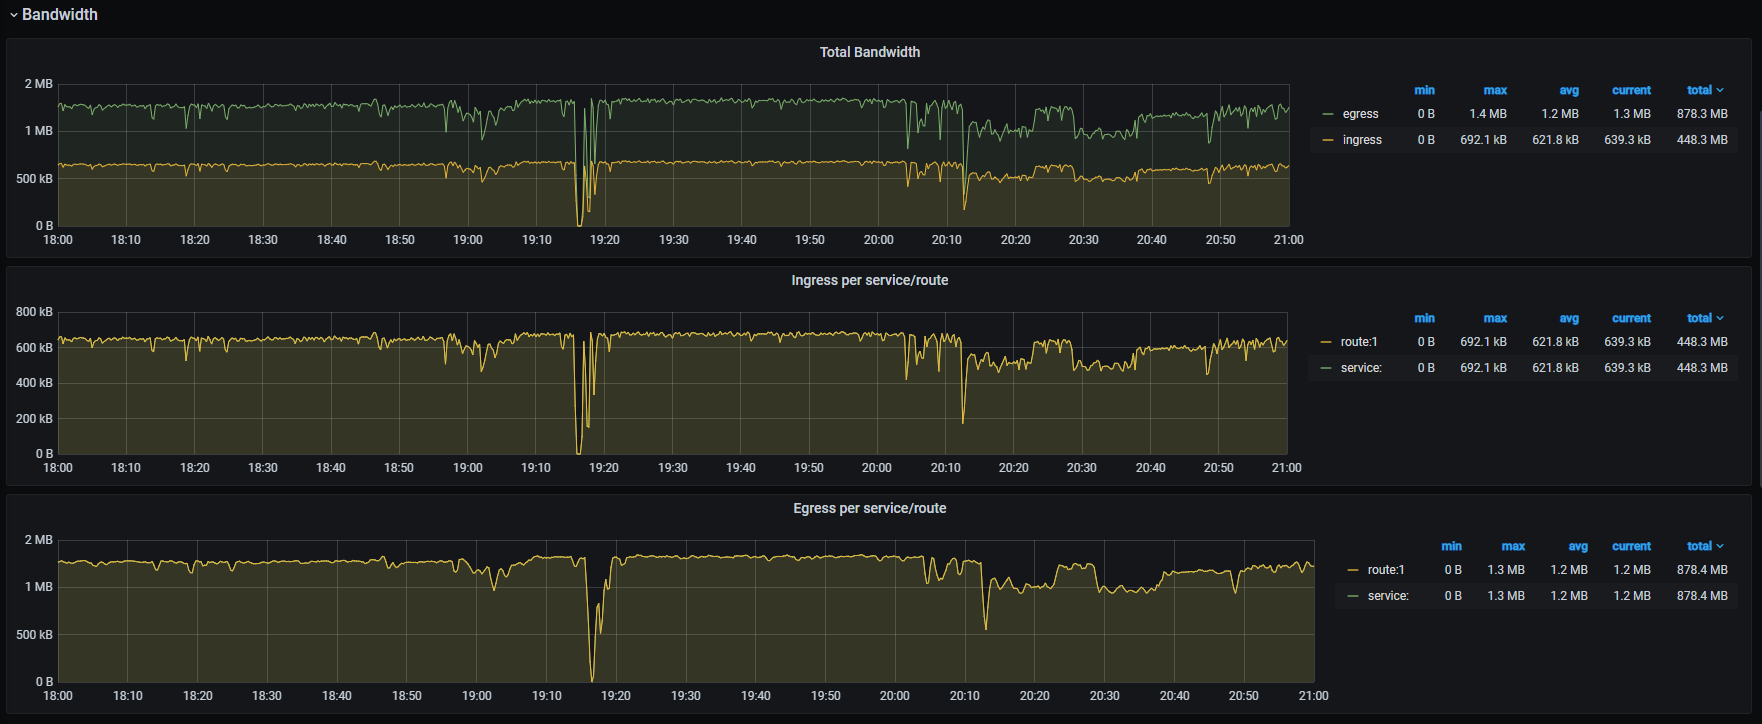
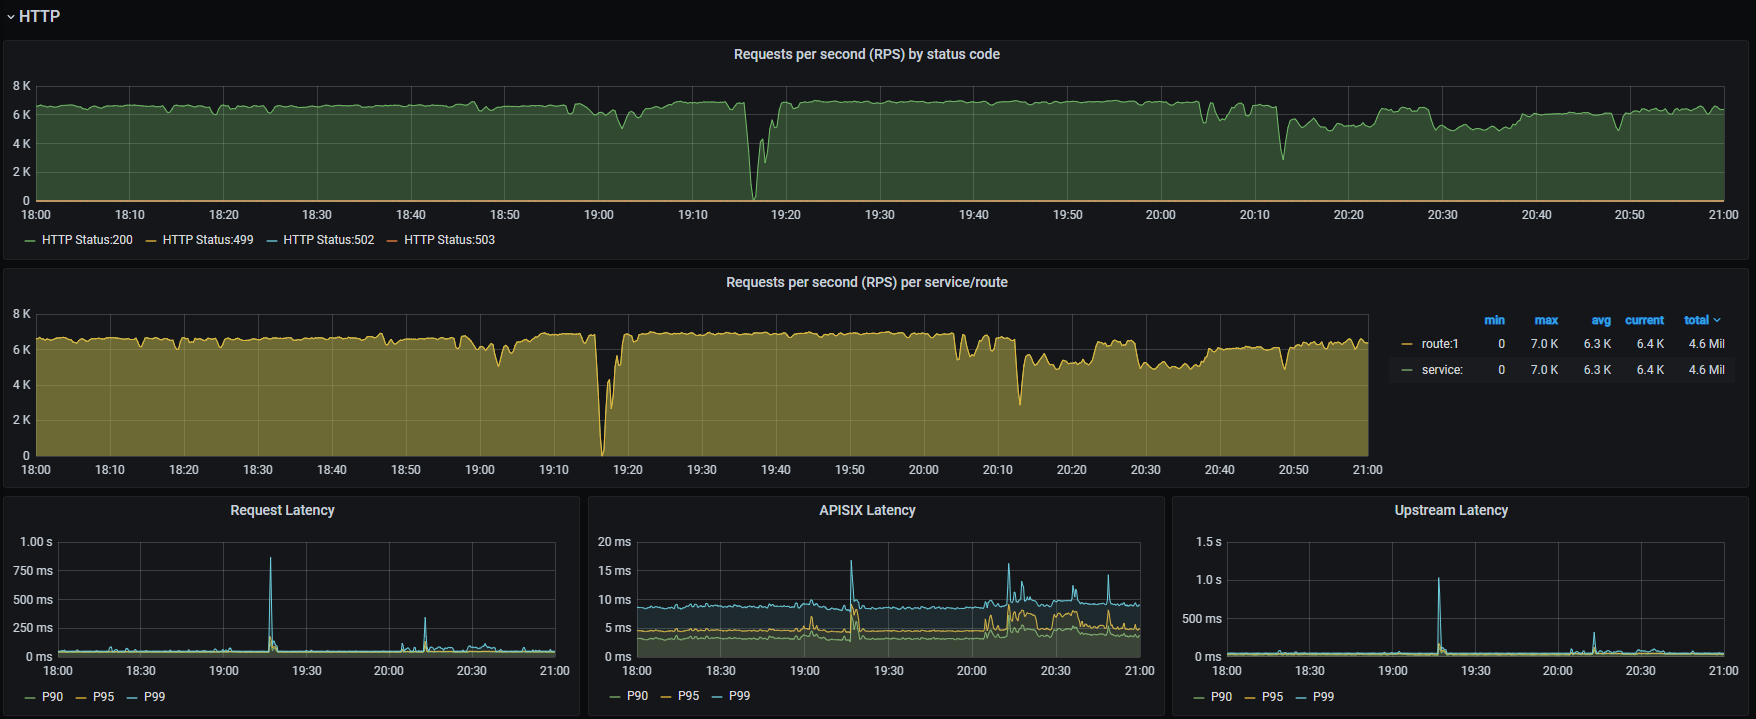
Metrics exported by the prometheus Plugin can be graphed in Grafana using a drop in dashboard.
To set it up, download Grafana dashboard meta and import it in Grafana. Or, you can go to Grafana official for Grafana metadata.
The following metrics are exported by the prometheus Plugin:
-
Status code: HTTP status code returned from Upstream services. They are available for a single service and across all services.
The available attributes are:
Name Description code HTTP status code returned by the upstream service. route route_idof the matched Route with request. Defaults to an empty string if the Routes don't match.matched_uri uriof the Route matching the request. Defaults to an empty string if the Routes don't match.matched_host hostof the Route matching the request. Defaults to an empty string if the Routes don't match.service service_idof the Route matching the request. If the Route does not have aservice_idconfigured, it defaults to$host.consumer consumer_nameof the Consumer matching the request. Defaults to an empty string if it does not match.node IP address of the Upstream node. -
Bandwidth: Total amount of traffic (ingress and egress) flowing through APISIX. Total bandwidth of a service can also be obtained.
The available attributes are:
Name Description type Type of traffic (egress/ingress). route route_idof the matched Route with request. Defaults to an empty string if the Routes don't match.service service_idof the Route matching the request. If the Route does not have aservice_idconfigured, it defaults to$host.consumer consumer_nameof the Consumer matching the request. Defaults to an empty string if it does not match.node IP address of the Upstream node. -
etcd reachability: A gauge type representing whether etcd can be reached by APISIX. A value of
1represents reachable and0represents unreachable. -
Connections: Nginx connection metrics like active, reading, writing, and number of accepted connections.
-
Batch process entries: A gauge type useful when Plugins like syslog, http-logger, tcp-logger, udp-logger, and zipkin use batch process to send data. Entries that hasn't been sent in batch process will be counted in the metrics.
-
Latency: Histogram of the request time per service in different dimensions.
The available attributes are:
Name Description type Value can be one of apisix,upstream, orrequest. This translates to latency caused by APISIX, Upstream, or both (their sum).service service_idof the Route matching the request. If the Route does not have aservice_idconfigured, it defaults to$host.consumer consumer_nameof the Consumer matching the request. Defaults to an empty string if it does not match.node IP address of the Upstream node. -
Info: Information about the APISIX node.
-
Shared dict: The capacity and free space of all nginx.shared.DICT in APISIX.
-
apisix_upstream_status: Health check result status of upstream nodes. A value of1represents healthy and0represents unhealthy.The available attributes are:
Name Description name resource id where the upstream node is attached to, e.g. /apisix/routes/1,/apisix/upstreams/1.ip ip address of the node. port port number of the node.
Here are the original metrics from APISIX:
curl http://127.0.0.1:9091/apisix/prometheus/metrics# HELP apisix_bandwidth Total bandwidth in bytes consumed per service in Apisix
# TYPE apisix_bandwidth counter
apisix_bandwidth{type="egress",route="",service="",consumer="",node=""} 8417
apisix_bandwidth{type="egress",route="1",service="",consumer="",node="127.0.0.1"} 1420
apisix_bandwidth{type="egress",route="2",service="",consumer="",node="127.0.0.1"} 1420
apisix_bandwidth{type="ingress",route="",service="",consumer="",node=""} 189
apisix_bandwidth{type="ingress",route="1",service="",consumer="",node="127.0.0.1"} 332
apisix_bandwidth{type="ingress",route="2",service="",consumer="",node="127.0.0.1"} 332
# HELP apisix_etcd_modify_indexes Etcd modify index for APISIX keys
# TYPE apisix_etcd_modify_indexes gauge
apisix_etcd_modify_indexes{key="consumers"} 0
apisix_etcd_modify_indexes{key="global_rules"} 0
apisix_etcd_modify_indexes{key="max_modify_index"} 222
apisix_etcd_modify_indexes{key="prev_index"} 35
apisix_etcd_modify_indexes{key="protos"} 0
apisix_etcd_modify_indexes{key="routes"} 222
apisix_etcd_modify_indexes{key="services"} 0
apisix_etcd_modify_indexes{key="ssls"} 0
apisix_etcd_modify_indexes{key="stream_routes"} 0
apisix_etcd_modify_indexes{key="upstreams"} 0
apisix_etcd_modify_indexes{key="x_etcd_index"} 223
# HELP apisix_batch_process_entries batch process remaining entries
# TYPE apisix_batch_process_entries gauge
apisix_batch_process_entries{name="http-logger",route_id="9",server_addr="127.0.0.1"} 1
apisix_batch_process_entries{name="sls-logger",route_id="9",server_addr="127.0.0.1"} 1
apisix_batch_process_entries{name="tcp-logger",route_id="9",server_addr="127.0.0.1"} 1
apisix_batch_process_entries{name="udp-logger",route_id="9",server_addr="127.0.0.1"} 1
apisix_batch_process_entries{name="sys-logger",route_id="9",server_addr="127.0.0.1"} 1
apisix_batch_process_entries{name="zipkin_report",route_id="9",server_addr="127.0.0.1"} 1
# HELP apisix_etcd_reachable Config server etcd reachable from Apisix, 0 is unreachable
# TYPE apisix_etcd_reachable gauge
apisix_etcd_reachable 1
# HELP apisix_http_status HTTP status codes per service in Apisix
# TYPE apisix_http_status counter
apisix_http_status{code="200",route="1",matched_uri="/hello",matched_host="",service="",consumer="",node="127.0.0.1"} 4
apisix_http_status{code="200",route="2",matched_uri="/world",matched_host="",service="",consumer="",node="127.0.0.1"} 4
apisix_http_status{code="404",route="",matched_uri="",matched_host="",service="",consumer="",node=""} 1
# HELP apisix_http_requests_total The total number of client requests
# TYPE apisix_http_requests_total gauge
apisix_http_requests_total 1191780
# HELP apisix_nginx_http_current_connections Number of HTTP connections
# TYPE apisix_nginx_http_current_connections gauge
apisix_nginx_http_current_connections{state="accepted"} 11994
apisix_nginx_http_current_connections{state="active"} 2
apisix_nginx_http_current_connections{state="handled"} 11994
apisix_nginx_http_current_connections{state="reading"} 0
apisix_nginx_http_current_connections{state="waiting"} 1
apisix_nginx_http_current_connections{state="writing"} 1
# HELP apisix_nginx_metric_errors_total Number of nginx-lua-prometheus errors
# TYPE apisix_nginx_metric_errors_total counter
apisix_nginx_metric_errors_total 0
# HELP apisix_http_latency HTTP request latency in milliseconds per service in APISIX
# TYPE apisix_http_latency histogram
apisix_http_latency_bucket{type="apisix",route="1",service="",consumer="",node="127.0.0.1",le="1"} 1
apisix_http_latency_bucket{type="apisix",route="1",service="",consumer="",node="127.0.0.1",le="2"} 1
apisix_http_latency_bucket{type="request",route="1",service="",consumer="",node="127.0.0.1",le="1"} 1
apisix_http_latency_bucket{type="request",route="1",service="",consumer="",node="127.0.0.1",le="2"} 1
apisix_http_latency_bucket{type="upstream",route="1",service="",consumer="",node="127.0.0.1",le="1"} 1
apisix_http_latency_bucket{type="upstream",route="1",service="",consumer="",node="127.0.0.1",le="2"} 1
...
# HELP apisix_node_info Info of APISIX node
# TYPE apisix_node_info gauge
apisix_node_info{hostname="desktop-2022q8f-wsl"} 1
# HELP apisix_shared_dict_capacity_bytes The capacity of each nginx shared DICT since APISIX start
# TYPE apisix_shared_dict_capacity_bytes gauge
apisix_shared_dict_capacity_bytes{name="access-tokens"} 1048576
apisix_shared_dict_capacity_bytes{name="balancer-ewma"} 10485760
apisix_shared_dict_capacity_bytes{name="balancer-ewma-last-touched-at"} 10485760
apisix_shared_dict_capacity_bytes{name="balancer-ewma-locks"} 10485760
apisix_shared_dict_capacity_bytes{name="discovery"} 1048576
apisix_shared_dict_capacity_bytes{name="etcd-cluster-health-check"} 10485760
...
# HELP apisix_shared_dict_free_space_bytes The free space of each nginx shared DICT since APISIX start
# TYPE apisix_shared_dict_free_space_bytes gauge
apisix_shared_dict_free_space_bytes{name="access-tokens"} 1032192
apisix_shared_dict_free_space_bytes{name="balancer-ewma"} 10412032
apisix_shared_dict_free_space_bytes{name="balancer-ewma-last-touched-at"} 10412032
apisix_shared_dict_free_space_bytes{name="balancer-ewma-locks"} 10412032
apisix_shared_dict_free_space_bytes{name="discovery"} 1032192
apisix_shared_dict_free_space_bytes{name="etcd-cluster-health-check"} 10412032
...
# HELP apisix_upstream_status Upstream status from health check
# TYPE apisix_upstream_status gauge
apisix_upstream_status{name="/apisix/routes/1",ip="100.24.156.8",port="80"} 0
apisix_upstream_status{name="/apisix/routes/1",ip="52.86.68.46",port="80"} 1To disable the prometheus Plugin, you can delete the corresponding JSON configuration from the Plugin configuration. APISIX will automatically reload and you do not have to restart for this to take effect.
curl http://127.0.0.1:9180/apisix/admin/routes/1  -H 'X-API-KEY: edd1c9f034335f136f87ad84b625c8f1' -X PUT -d '
{
    "uri": "/hello",
    "plugins": {},
    "upstream": {
        "type": "roundrobin",
        "nodes": {
            "127.0.0.1:80": 1
        }
    }
}':::info IMPORTANT
This feature requires APISIX to run on APISIX-Base.
:::
We can also enable prometheus to collect metrics for TCP/UDP.
First of all, ensure prometheus plugin is in your configuration file (conf/config.yaml):
stream_plugins:
  - ...
  - prometheus
Then you need to configure the prometheus plugin on the stream route:
curl http://127.0.0.1:9180/apisix/admin/stream_routes/1 -H 'X-API-KEY: edd1c9f034335f136f87ad84b625c8f1' -X PUT -d '
{
    "plugins": {
        "prometheus":{}
    },
    "upstream": {
        "type": "roundrobin",
        "nodes": {
            "127.0.0.1:80": 1
        }
    }
}'The following metrics are available when using APISIX as an L4 proxy.
-
Stream Connections: The number of processed connections at the route level.Attributes:
Name Description route matched stream route ID -
Connections: Various Nginx connection metrics like active, reading, writing, and number of accepted connections. -
Info: Information about the current APISIX node.
Here are examples of APISIX metrics:
$ curl http://127.0.0.1:9091/apisix/prometheus/metrics...
# HELP apisix_node_info Info of APISIX node
# TYPE apisix_node_info gauge
apisix_node_info{hostname="desktop-2022q8f-wsl"} 1
# HELP apisix_stream_connection_total Total number of connections handled per stream route in APISIX
# TYPE apisix_stream_connection_total counter
apisix_stream_connection_total{route="1"} 1


