This repository contains examples for configuring monitoring of Redpanda using Prometheus and Grafana.
Note
This version is designed to work with the public_metrics endpoint that was introduced in Redpanda 22.2 and is provided by Redpanda Cloud. If you are running an older version of Redpanda please use the legacy version of these dashboards.
Important
The latest version of the Redpanda Ops Dashboard includes the newer Kafka handler latency metric, specifically redpanda_kafka_handler_latency_seconds_bucket{handler="produce"} and redpanda_kafka_handler_latency_seconds_bucket{handler="fetch"}. This metric is only available from Redpanda versions 23.1.19+ and 23.2.12+.
The grafana-dashboards folder contains sample dashboards that can be imported directly into a Grafana or Grafana Cloud instance.
The following dashboards are provided as examples:
- Redpanda Ops Dashboard - Provides an overview of KPIs for a Redpanda cluster with health indicators. This is suitable for ops or SRE to monitor on a daily or continuous basis.
- Kafka Topic Metrics - Provides throughput, read/write rates, and on-disk sizes of each/all topics.
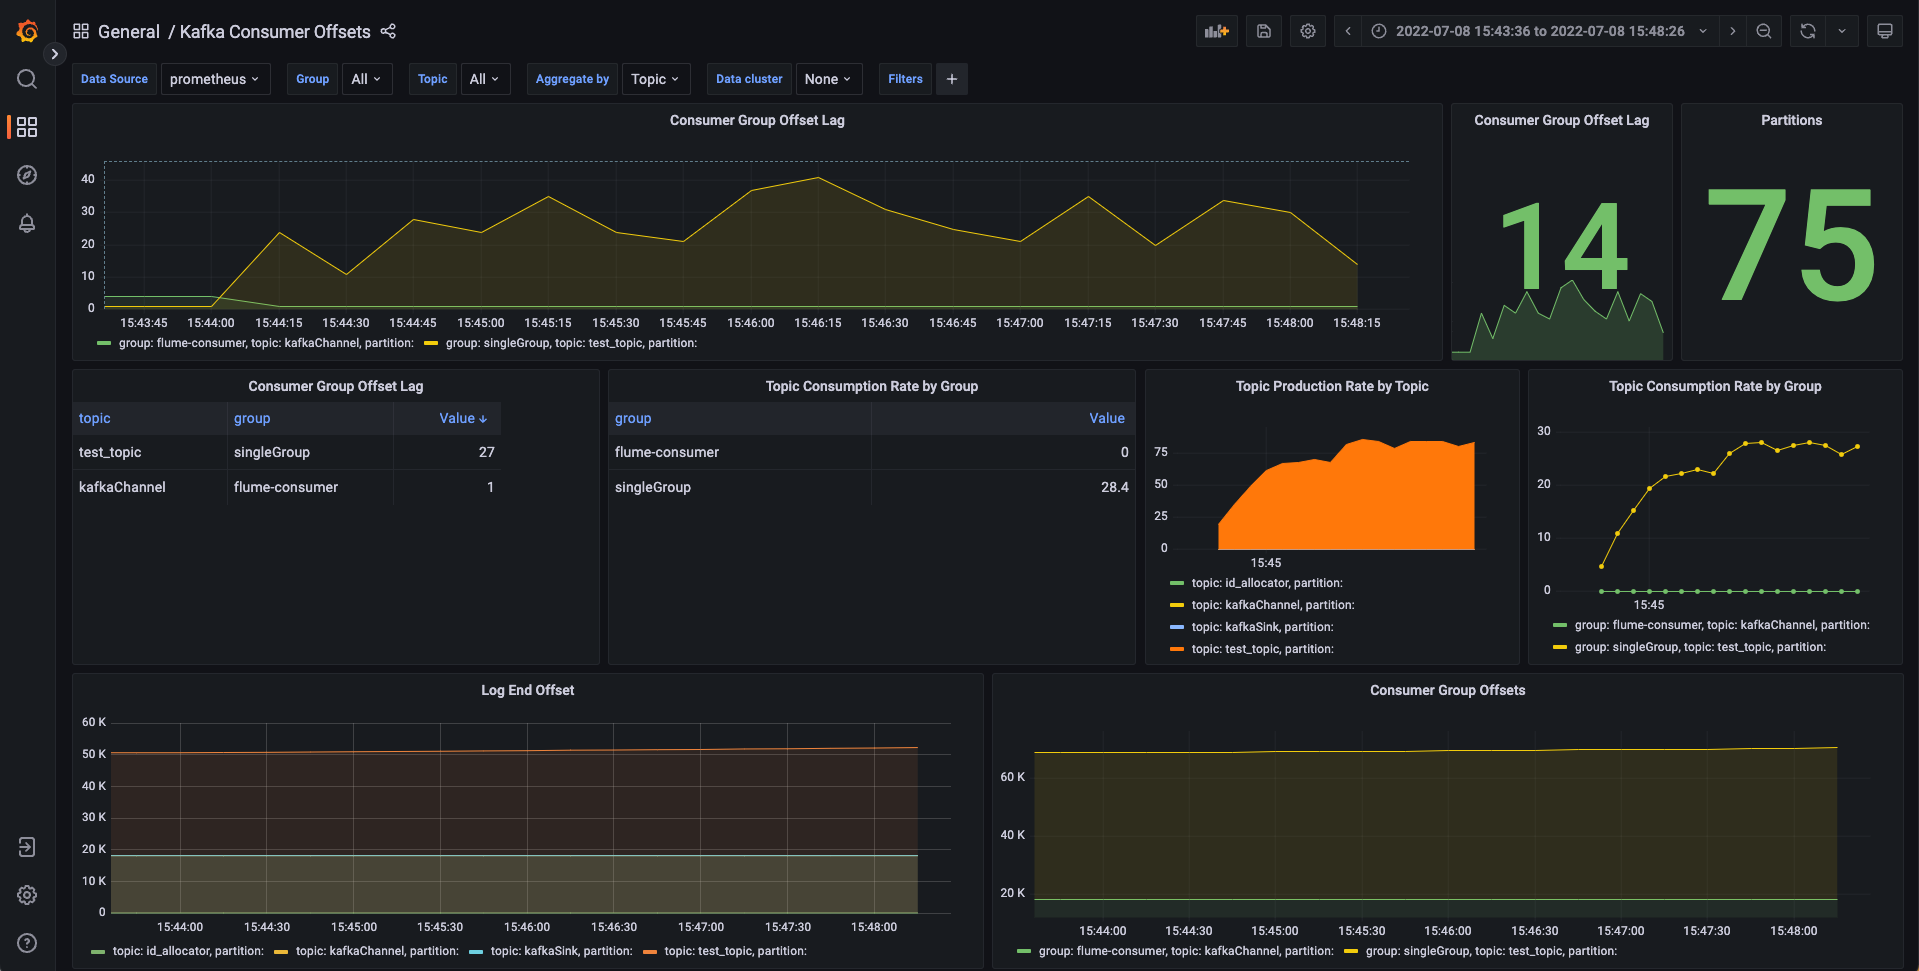
- Kafka Consumer Offsets - Metrics and KPIs that provide details of topic consumers and how far they are lagging behind the end of the log.
- Redpanda Dashboard - The default dashboard that would be generated by
the
rpk generate grafana-dashboardcommand. Note: This is considered deprecated in favour of the above dashboards. - Kafka Consumer Metrics - Allows for monitoring of Java Kafka consumers, using the Prometheus JMX Exporter and the Kafka Sample Configuration.
This repository contains examples for configuring alerting using Prometheus (via Alert Manager) or Grafana.
Grafana can use Alert Manager as a source of alerts, or it can manage alerts independently of Prometheus.
The demo folder includes a full dockerized sandbox, that will spin up a three-node Redpanda cluster, an instance of Redpanda Console, a Prometheus instance and a Grafana instance with Prometheus and Grafana configured with the dashboards in the grafana-dashboards folder.
The cloud folder has a Docker Compose file that will bring up Prometheus and Grafana, with instructions on how to scrape the Prometheus endpoint exposed by your Redpanda Cloud cluster


