Moscow, one of the largest metropolises in the world with a population of more than 12 million people, covers an area of more than 2561.5 km² with an average density of inheritance of 4924.96 people / km². Moscow has a very uneven population density from 30429 people / km² for the "Зябликово" borough, to 560 people / km² for the "Молжаниновский" borough. The average cost of real estate varies from 68,768 rubles / m² for the "Кленовское" borough to 438,568 rubles / m² for the "Арбат" borough.
Owners of cafes, fitness centers and other social facilities are expected to prefer boroughs with a high population density. Investors will prefer areas with low housing costs and low competitiveness. In my research, I will try to determine the optimal places for the location of fitness centers in Moscow boroughs, taking into account the population density,the cost of real estate and the density of other fitness facilities. The key criteria for selecting suitable locations for fitness centers will be:
- high population of the borough
- low cost of real estate in the borough
- the absence in the immediate vicinity of other fitness facilities
I will use the approaches and methods of machine learning to determine the location of fitness centers in accordance with the specified criteria. The main stakeholders of my research will be investors interested in opening new fitness centers.
Based on the problem and the established selection criteria, to conduct the research, I will need the following information:
- main dataset with the list of Moscow Borough, containing the following attributes:
- name of the each Moscow Borough
- type of the each Moscow Borough
- name of the each Moscow District in which Borough is belong to
- area of the each Moscow Borough in square kilometers
- the population of the each Moscow Borough
- housing area of the each Moscow Borough in square meters
- average housing price of the each Moscow Borough
- geographical coordinates of the each Moscow Borough
- shape of the each Moscow Borough in GEOJSON format
- list of venues placed in the each Moscow Borough with their geographical coordinates and categories
Data for Moscow Boroughs dataset were downloaded from multiple HTTP page combined into one pandas dataframe.
- List of Moscow District and they Boroughs were downloaded from the page Moscow Boroughs
- Information about area of the each Moscow Borough in square kilometers, their population and housing area in square meters were downloaded from the page Moscow Boroughs Population Density
- Information about housing price of the each Moscow Borough were downloaded from the page Moscow Boroughs Housing Price
Geographical coordinates of the each Moscow Borough were queried through Nominatim service. As the Nominatim service are quite unstable it was quite a challenge to request coordinate in several iterations.
Shape of the each Moscow Borough in GEOJSON format was downloaded from the page Moscow Boroughs GEOJSON
To determine venues the service Forsquare API was used.
The API of Forsquare service have the restriction of 100 venues, which it can return in one request.
To obtain list of all venues I used the following approach:
- present Moscow area in the form of a regular grid of circles of quite small diameter, no more than 100 venues in each circle
- perform exploration using Forsquare API with quite bigger radius than circle of a grid to make sure it overlaps/full coverage to don't miss any venues
- cleaning list of venues from duplicates.
As data for Moscow Boroughs dataset were downloaded from multiple HTTP page it was necessary to perform a data cleaning.
I had a problem to found proper statistics about “housing prices” and “housing area” for some Moscow boroughs, so I had to exclude 26 boroughs from my analysis.
Fortunately, they all had a low population density, which meat criteria of my research and did not reduce it quality.
When I gathered Moscow Boroughs geographical coordinates, using Nominatim service, I have an occasionally problem with russian leter ё. So I have to manyaly obtain coordinates for such boroughs.
Another problem with Nominatim service is that it return not very accurate coordinate of some Boroughs. So I needed to adjust they manually in the map.
GEOJSON file downloaded from the page Moscow Boroughs GEOJSON was quite good and not required any addition clearing.
Using Forsquare API I obtained 34460 venues in 7899 cells of regular grid around center of Moscow City.
As I used a quite bigger radius (350 meters) for venue explorations than circle of a grid (300 meters), there was a need to remove duplicates venues.
After duplicates removal I had 27622 unique venues in the circle radius of 28 000 meters around the Moscow City.
The second task was to bind each venue to Moscow Boroughs in which borders they were placed. To perform this task I created a polygon for each Moscow Borough from GEOJSON file and found which venues coordinate included into each polygon.
The third task was to remove all the venues that placed outside of the Moscow boroughs.
The fourth task was to get main category from the category list for each venue.
As the result, I had list of 20864 venues placed in the Moscow Boroughs with their geographical coordinates and categories
The prepared and cleared Moscow Boroughs dataset can be downloaded by link Moscow Boroughs dataset
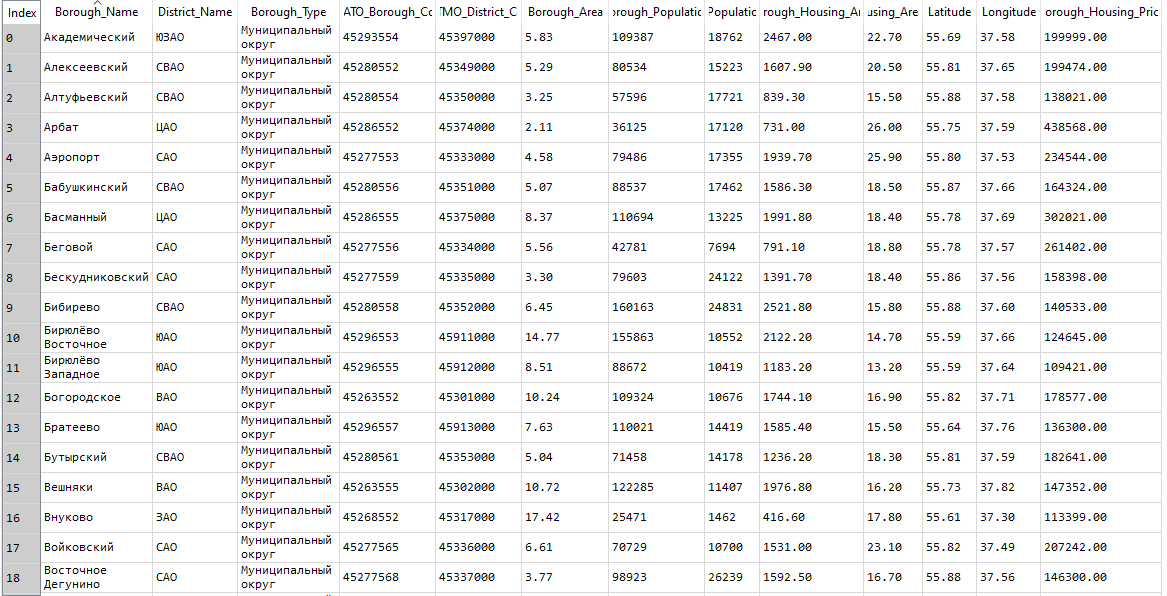
The picture below shows a small part of the Moscow Boroughs dataset
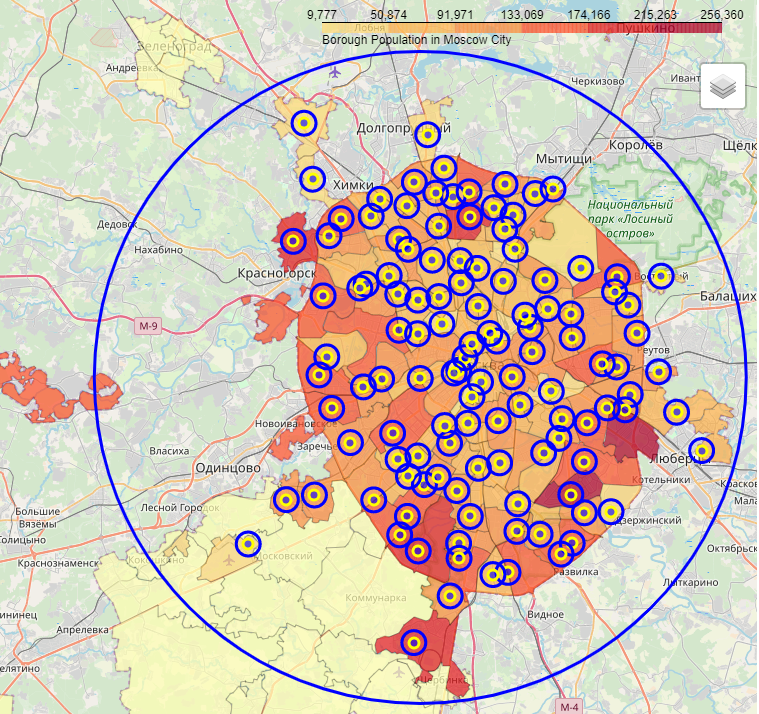
The picture below shows a choropleth map of the Moscow Boroughs population and the center of each boroughs.
As we can see, use center of the boroughs for searching venues is quite useless as each borough have very sophisticated shape.
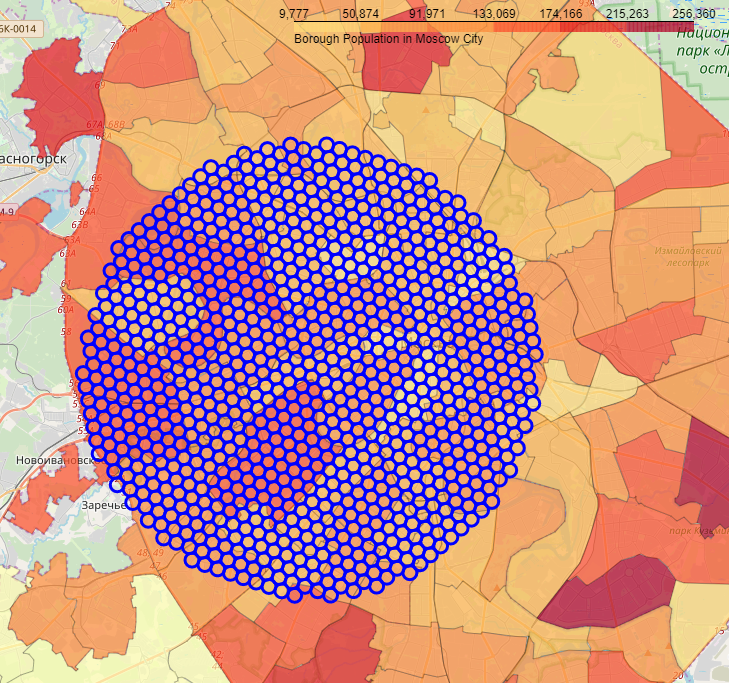
So I needed to present Moscow area in the form of a regular grid of circles of quite small diameter inside the circle of 28 000 meter in radius, which cover all the Moscow Boroughs in my research.
The picture below shows an Example of such hexagonal grid of area candidates
The prepared and cleared Moscow venues dataset can be downloaded by link Moscow venues dataset
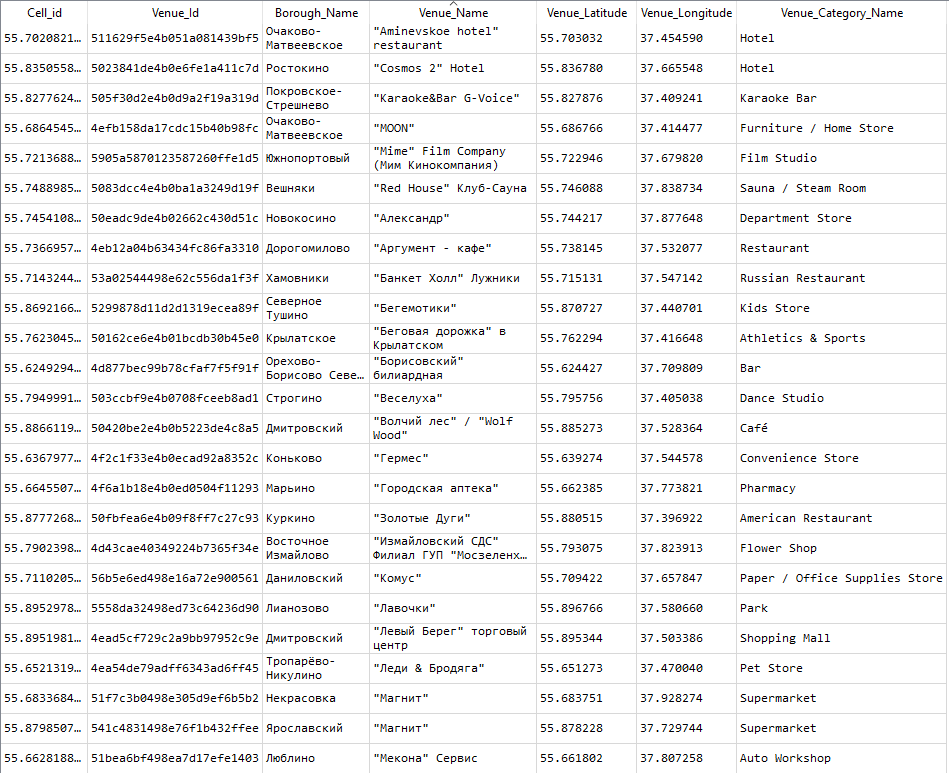
The picture below shows a small part of the Moscow Boroughs dataset
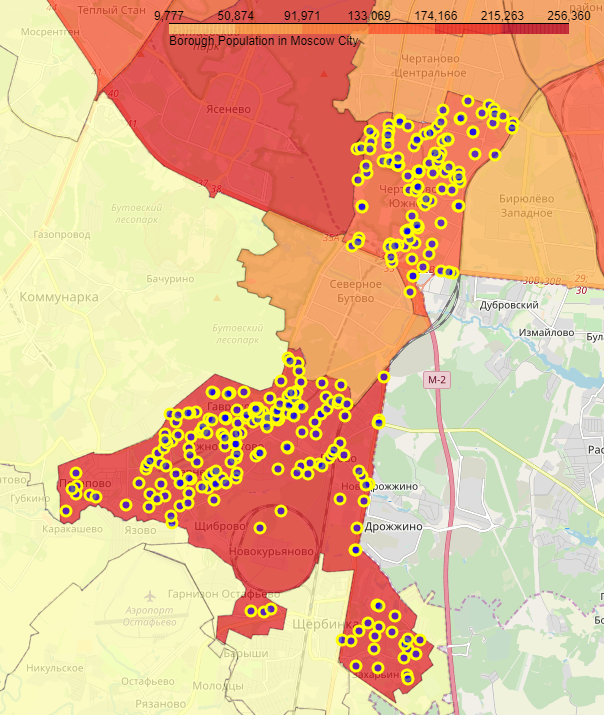
The picture below shows a example of the some Moscow Boroughs and their venues
The key criteria for my research are:
- high population of the boroughs
- low cost of real estate in the boroughs area
- the absence in the immediate vicinity of the other fitness facilities
So I need to perform at least two tasks during analysis:
- first is to find boroughs with highest population and smallest housing price
- second is to provide a tool or methodology for determining vicinity of other fitness facilities in the boroughs
For the first task I try to use some approaches and methods of machine learning. And found out, what of the approaches suits my tasks best. I will use:
- exploratory data analysis, including descriptive statistical analysis, categorical variables analysis and сorrelation analysis
- segmentation with K-Means clustering
For the second task I decided to use visualization approach to mapping fitness facilities on to the interactive choropleth map and heatmap.
This approach can be easily used by stakeholders of my research to identify vicinity of other fitness facilities in the eache Boroughs.
We have following key features in Moscow Boroughs dataset:
- District - name of the Moscow District in which Borough is belong to
- Area - area of the Moscow Borough in square kilometers
- Population_Density - population density of the Moscow Borough
- Housing_Area - housing area of the Moscow Borough in square meters
Let's analyze features and key criteria using:
- descriptive statistical analysis
- categorical variables analysis
- сorrelation analysis
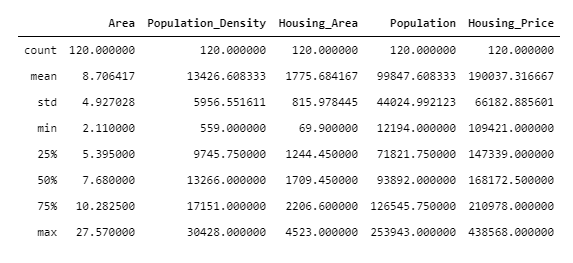
The picture below shows basic statistics for all features.
As we can see, Moscow Boroughs has a very uneven population from 12 194 people to 253 943 people.
The average cost of real estate varies from 109 421 rubles/m² to 438 568 rubles/m².
I have one categorical variable - name of the Moscow District in which Borough is belong to.
Let's analize relationship between categorical feature 'District' and key criteria using boxplots visualization.
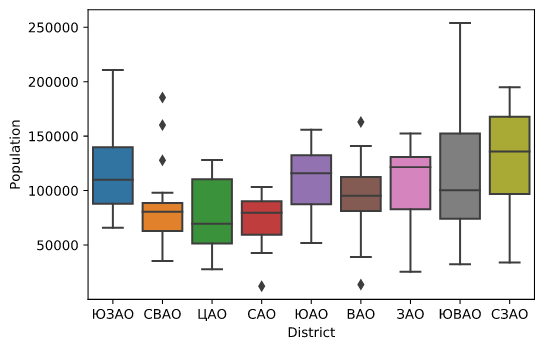
The picture below shows relationship between 'District' and 'Population'.
We can see that the distributions of Population between Boroughs in the different Districts have aт overlap, but we can estimate, that the most populated Boroughs are placed in 'ЮЗАО', 'ЮАО', 'СЗАО' and 'ЗАО' Districts.
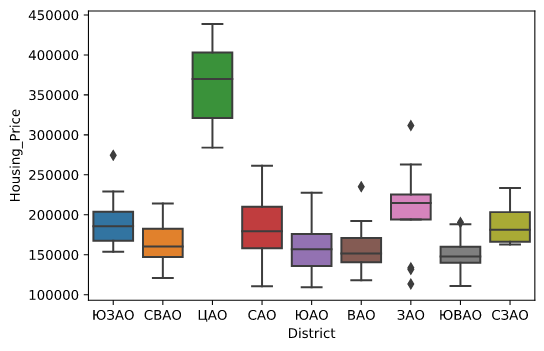
The next picture shows relationship between 'District' and 'Housing Price'.
We can see that the distributions of Housing Price between Boroughs in the different Districts are distinct enough.
As the result of boxplots visualization, categorical feature 'District' would be a good potential predictor only of Housing Price.
The picture below shows correlation matrix.
Correlation between 'Area', 'Population_Density' and 'Population' is statistically significant, although the linear relationship isn't extremely strong.
Correlation between 'Housing_Are' and 'Population' is statistically hughly significant, and the linear relationship is extremely strong.
Correlation between 'Area', 'Population_Density', 'Housing_Area' and 'Housing_Price' is not statistically significant, although the linear relationship isn't strong.
Correlation between 'Area' to 'Population_Density' is statistically hughly significant, and the linear relationship is extremely strong.
So we can exclude 'Population_Density' from our considerations.
In my research, I decided to try segmentation with K-Means clustering to detect Boroughs that have highest population and smallest housing price.
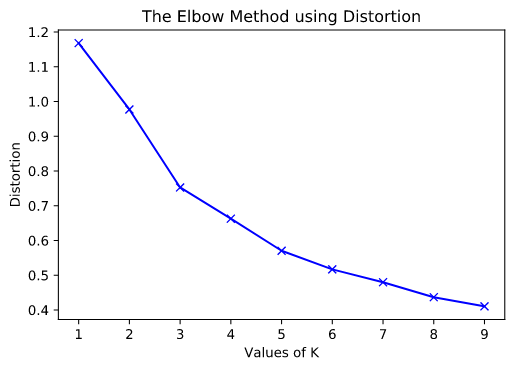
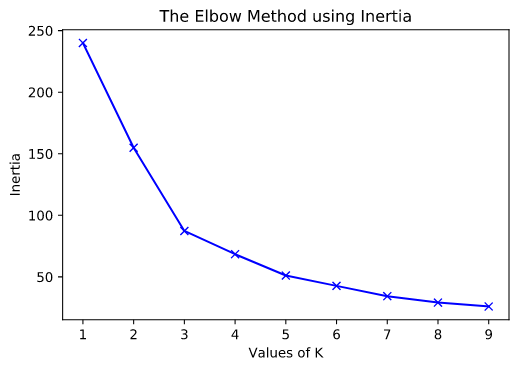
To determine right number of clusters, I used elbow method. According elbow method I implemented K-Means clustering from 1 to 10 centroids and calculate distortion and inertia for each variant.
The next pictures show elbow method using Distortion and Inertia. We can see that there are elbows at 3 and 5 centroid.
I decided to use 3 centroid in my research.
To analyze K-Means clusters I calculated some additional statistics:
- count boroughs in the cluster
- sum population in the cluster
- sum area of the cluster
- mean population in the boroughs in the cluster
- mean housing price in the boroughs in the cluster
- % population in the cluster to all Moscow City population
- % area of the cluster to all Moscow City area
- population density in the cluster
The next pictures show these statistics
As we can see, there are 3 clusters:
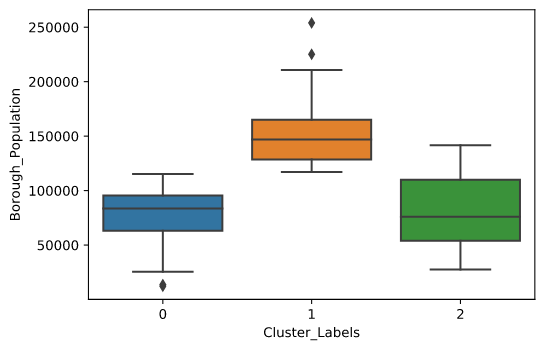
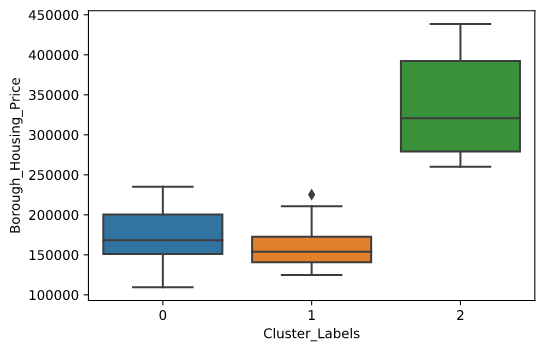
- "0" Cluster - characterized by low mean population (78538 people per Borough), relatively high mean housing price (173695 rubles/m²) and low population density (10328 people/km²)
- "1" Cluster - characterized by highest mean population (153187 people per Borough), smallest mean housing price (160741 rubles/m²) and highest population density (13312 people/km²)
- "2" Cluster - characterized by low mean population (79805 people per Borough), highest mean housing price (333794 rubles/m²) and low population density (10533 people/km²)
The next pictures show these clusters using boxplots visualization.
Very good result of the KMean clustering.
"1" Cluster perfectly fits my research criteria:
- boroughs from this cluster have highest mean population and smallest mean housing price
- in 34 boroughs about 43% of the Moscow population occupied only 37% of the Moscow City area, that mean the highest population density
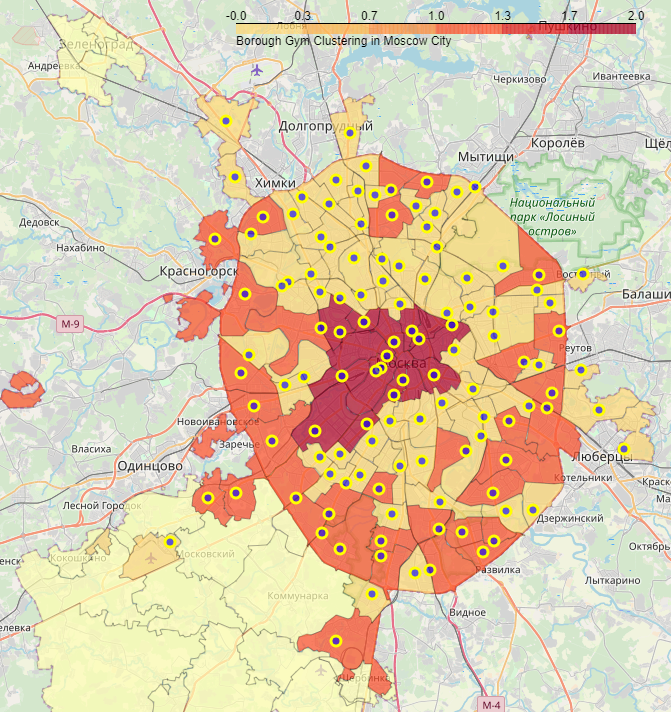
The next picture shows all clusters on choropleth map.
As we can see Boroughs in our target "1" Cluster mostly placed in the periphery of the Moscow City.
But not all of the periphery Boroughs are well populated so not meet our criteria.
The result of my research consisted of:
- List of the optimal Boroughs for the location of fitness centers, according to the main criterias
- high population of the borough
- low cost of real estate in the borough
- List of the other competitive fitness facilities in the each Borough from the optimal list
- Interactive choropleth map and heatmap with other competitive fitness facilities in the each Borough
The result dataset of the optimal Boroughs for the location of fitness centers can be downloaded by link Moscow Recomended Borough
Result dataset contains columns:
- Borough_Name - name of the Moscow Borough
- District_Name - name of the Moscow District in which Borough is belong to
- Borough_Type - type of the Moscow Borough
- Borough_Area - area of the Moscow Borough in square kilometers
- Borough_Population - population of the Moscow Borough
- Borough_Population_Density - population density of the Moscow Borough
- Borough_Housing_Area - housing area of the Moscow Borough in thousands of square meters
- Borough_Housing_Price - average housing price of the Moscow Borough
The picture below shows a part of this dataset.
There are 928 venues of "Gym / Fitness Center" subcategories of all 20864 venues in Moscow City and only 259 of them are placed in the optimal Boroughs.
The result dataset of the competitive fitness facilities can be downloaded by link Competitive fitness facilities
Result dataset contains columns:
- Borough_Name - name of the Moscow Borough
- Venue_Name - name of the fitness facilities
- Venue_Category_Name - category of the fitness facilities
- Venue_Location - address of the fitness facilities
- Venue_Latitude - latitude of the fitness facilities
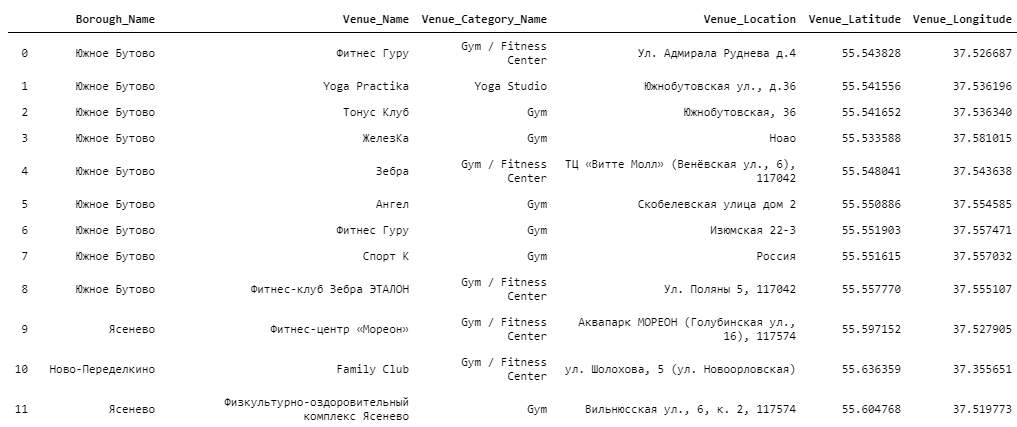
- Venue_Longitude - longitude of the fitness facilities
The picture below shows a part of this dataset.
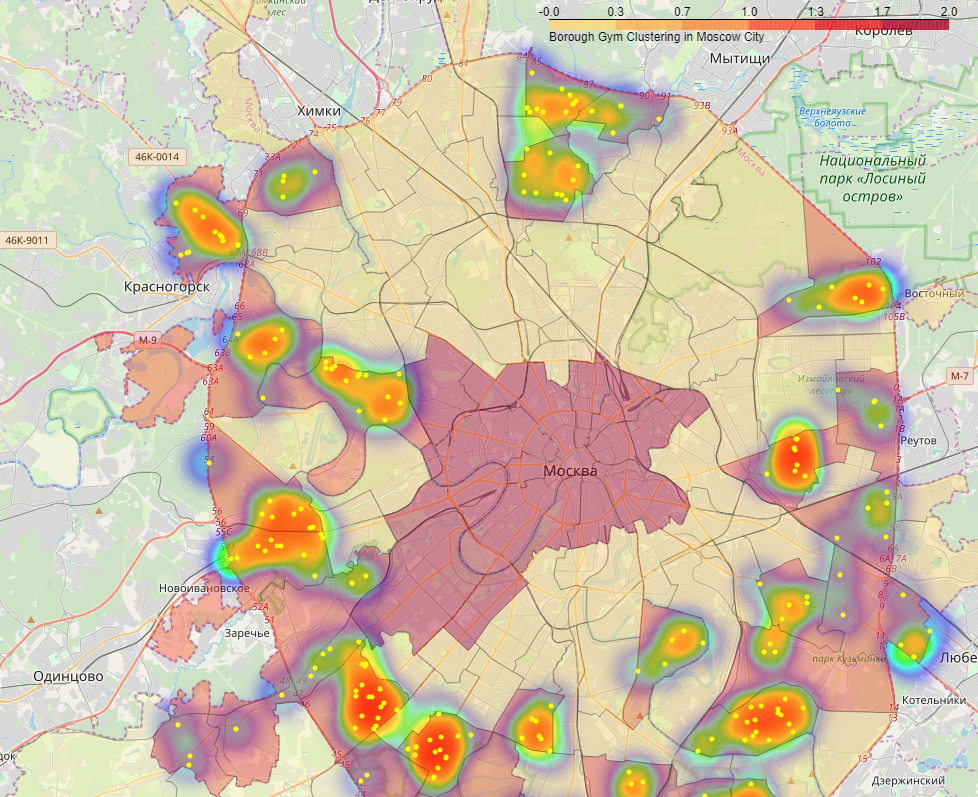
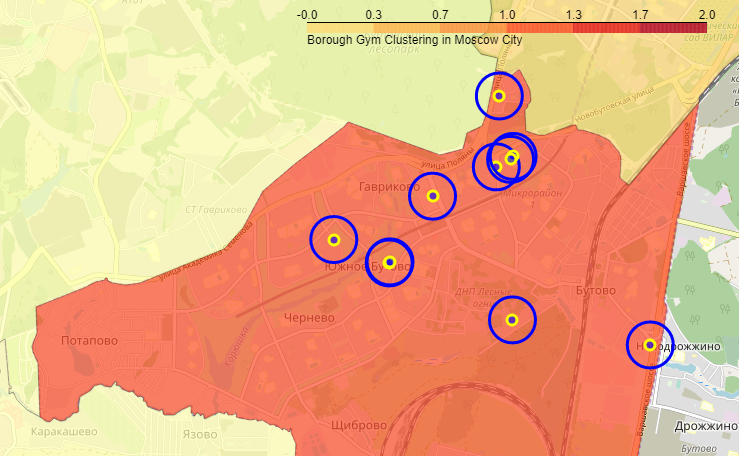
The interactive choropleth map and heatmap of competitive fitness facilities can be accessible by link Interactive map
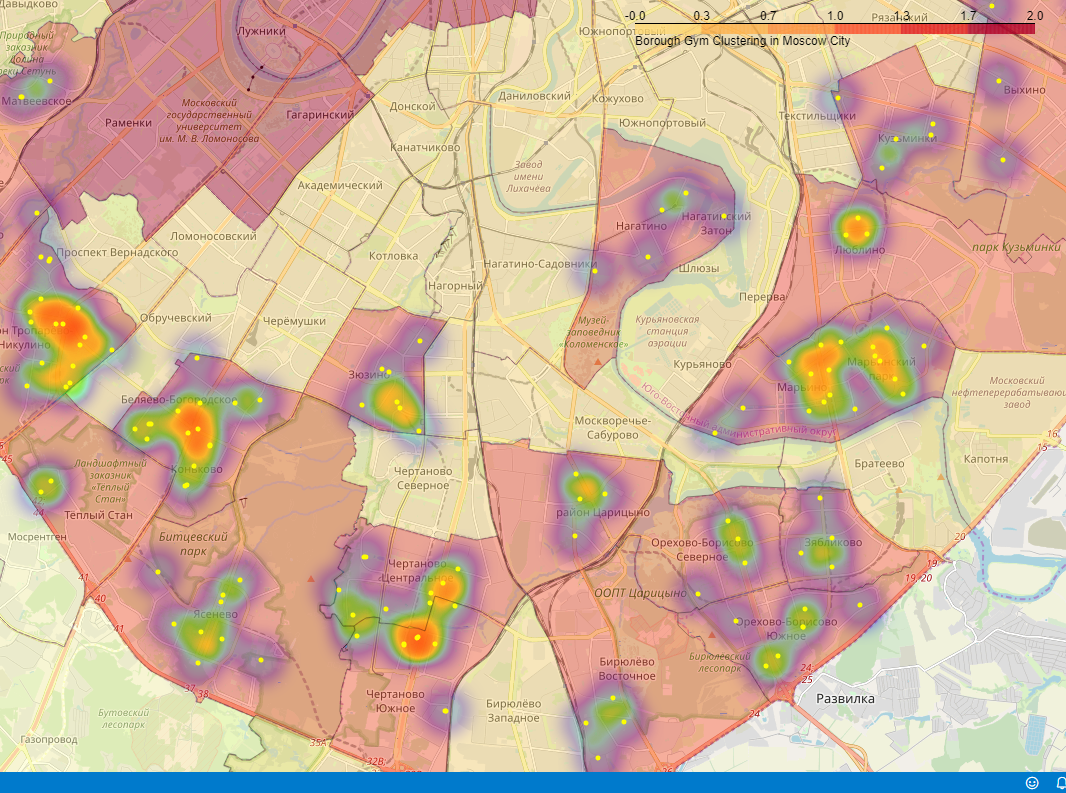
The pictures below show a part of this map.
The pictures below show a part of the competitive fitness facilities and circle in 250 meter around them.
In the course of my research I gathered a lot of informations about Moscow Boroughs, such as:
- area of the each Moscow Borough in square kilometers
- the population of the each Moscow Borough
- housing area of the each Moscow Borough in square meters
- average housing price of the each Moscow Borough
- geographical coordinates of the each Moscow Borough
- shape of the each Moscow Borough in GEOJSON format
- list of venues placed in the each Moscow Borough with their geographical coordinates and categories
All this informations was cleared and hosted on GitHub and can be accessed in future research.
I have used segmentation with K-Means clustering to detect Boroughs that have highest population and smallest housing price. When I tested the elbow method, I set the optimum k value to 3, but there are another elbow at 5 centroid. Additional analysis can be done with 5 clusters, that can present slightly another set of optimal Boroughs for the location of fitness centers. So recommended boroughs list should therefore be considered only as a starting point for more detailed analysis.
To determining vicinity of other fitness facilities in the boroughs I used visualization approach to mapping fitness centers on to the interactive choropleth map and heatmap.
Our visual analysis of the competitive fitness facilities shows that although there is a great number of fitness facilities (more than 250), there are pockets of low density in our list of the optimal Boroughs set.
In the future, research can be done additional analysis using categorical segmentations of the fitness facilities and calculate grid of location candidates taking into account fitness centers density.
Purpose of my project was to identify the optimal places for the location of fitness centers in Moscow boroughs, taking into account the dencity of population, the cost of real estate and the density of other fitness facilities in order to aid stakeholders in narrowing down the search for optimal location for a new fitness centers.
Results provided by me research can ease new investors to found out potentially best place for new a new fitness centers.
Best regards,
Presnyakov Roman.
