| title | excerpt | products | keywords | ||||||
|---|---|---|---|---|---|---|---|---|---|
How to monitor a Django application with Prometheus |
Set up Prometheus to monitor a Django application |
|
|
Prometheus is an open-source systems monitoring and alerting toolkit that can be used to easily and cheaply monitor infrastructure and applications. In this tutorial we show how to monitor a Django application with Prometheus. (And even if you don't have a Django application, we include an optional step to create one so that everyone can follow along.)
A machine with the following installed:
- Python
- pip
- A locally running Prometheus instance
(Please skip this step if you already have a Django application.)
python -m pip install DjangoNavigate to the directory where you want to create the project, and run:
django-admin startproject mysiteThis creates a mysite directory in your current directory, that looks
something like this (more here):
mysite/
    manage.py
    mysite/
        __init__.py
        settings.py
        urls.py
        asgi.py
        wsgi.py
Change to the outer mysite directory, and run:
python manage.py runserverYou should see something like this:
Performing system checks...

System check identified no issues (0 silenced).

You have unapplied migrations; your app may not work properly until they are applied.
Run 'python manage.py migrate' to apply them.

March 10, 2020 - 15:50:53
Django version 3.0, using settings 'mysite.settings'
Starting development server at http://127.0.0.1:8000/
Quit the server with CONTROL-C.
If that works, then visit http://127.0.0.1:8000/ from your Web browser.
You should see a "Congratulations!" page, with a rocket taking off.
(If that didn't work, then please take a look at the Django documentation for troubleshooting.)
We use the django-prometheus package for exporting prometheus-style monitoring metrics from our Django application.
python -m pip install django-prometheusIn settings.py, add:
INSTALLED_APPS = [
   ...
   'django_prometheus',
   ...
]

MIDDLEWARE = [
    'django_prometheus.middleware.PrometheusBeforeMiddleware',
    # All your other middlewares go here, including the default
    # middlewares like SessionMiddleware, CommonMiddleware,
    # CsrfViewmiddleware, SecurityMiddleware, etc.
    'django_prometheus.middleware.PrometheusAfterMiddleware',
]
In urls.py, make sure you have this in the header:
from django.conf.urls import include, pathThen add this under urlpatterns:
urlpatterns = [
    ...
    path('', include('django_prometheus.urls')),
]Restart the application and curl the /metrics endpoint:
python manage.py runserver
curl localhost:8000/metrics
(Alternatively, once you've restarted your application, visit http://localhost:8000/metrics from your web browser.)
You should see something like this:
# HELP python_gc_objects_collected_total Objects collected during gc
# TYPE python_gc_objects_collected_total counter
python_gc_objects_collected_total{generation="0"} 11716.0
python_gc_objects_collected_total{generation="1"} 1699.0
python_gc_objects_collected_total{generation="2"} 616.0
# HELP python_gc_objects_uncollectable_total Uncollectable object found during GC
# TYPE python_gc_objects_uncollectable_total counter
python_gc_objects_uncollectable_total{generation="0"} 0.0
python_gc_objects_uncollectable_total{generation="1"} 0.0
python_gc_objects_uncollectable_total{generation="2"} 0.0
# HELP python_gc_collections_total Number of times this generation was collected
# TYPE python_gc_collections_total counter
python_gc_collections_total{generation="0"} 7020.0
python_gc_collections_total{generation="1"} 638.0
python_gc_collections_total{generation="2"} 34.0
# HELP python_info Python platform information
# TYPE python_info gauge
python_info{implementation="CPython",major="3",minor="8",patchlevel="0",version="3.8.0"} 1.0
...
(Note: This section assumes that you have a locally running Prometheus instance.)
Under scrape_configs:, add:
- job_name: django
  scrape_interval: 10s
  static_configs:
  - targets:
- localhost:8000./prometheus --config.file=prometheus.ymlOnce you are running Prometheus locally, visit the Prometheus Expression Browser (running on localhost) from your web browser.
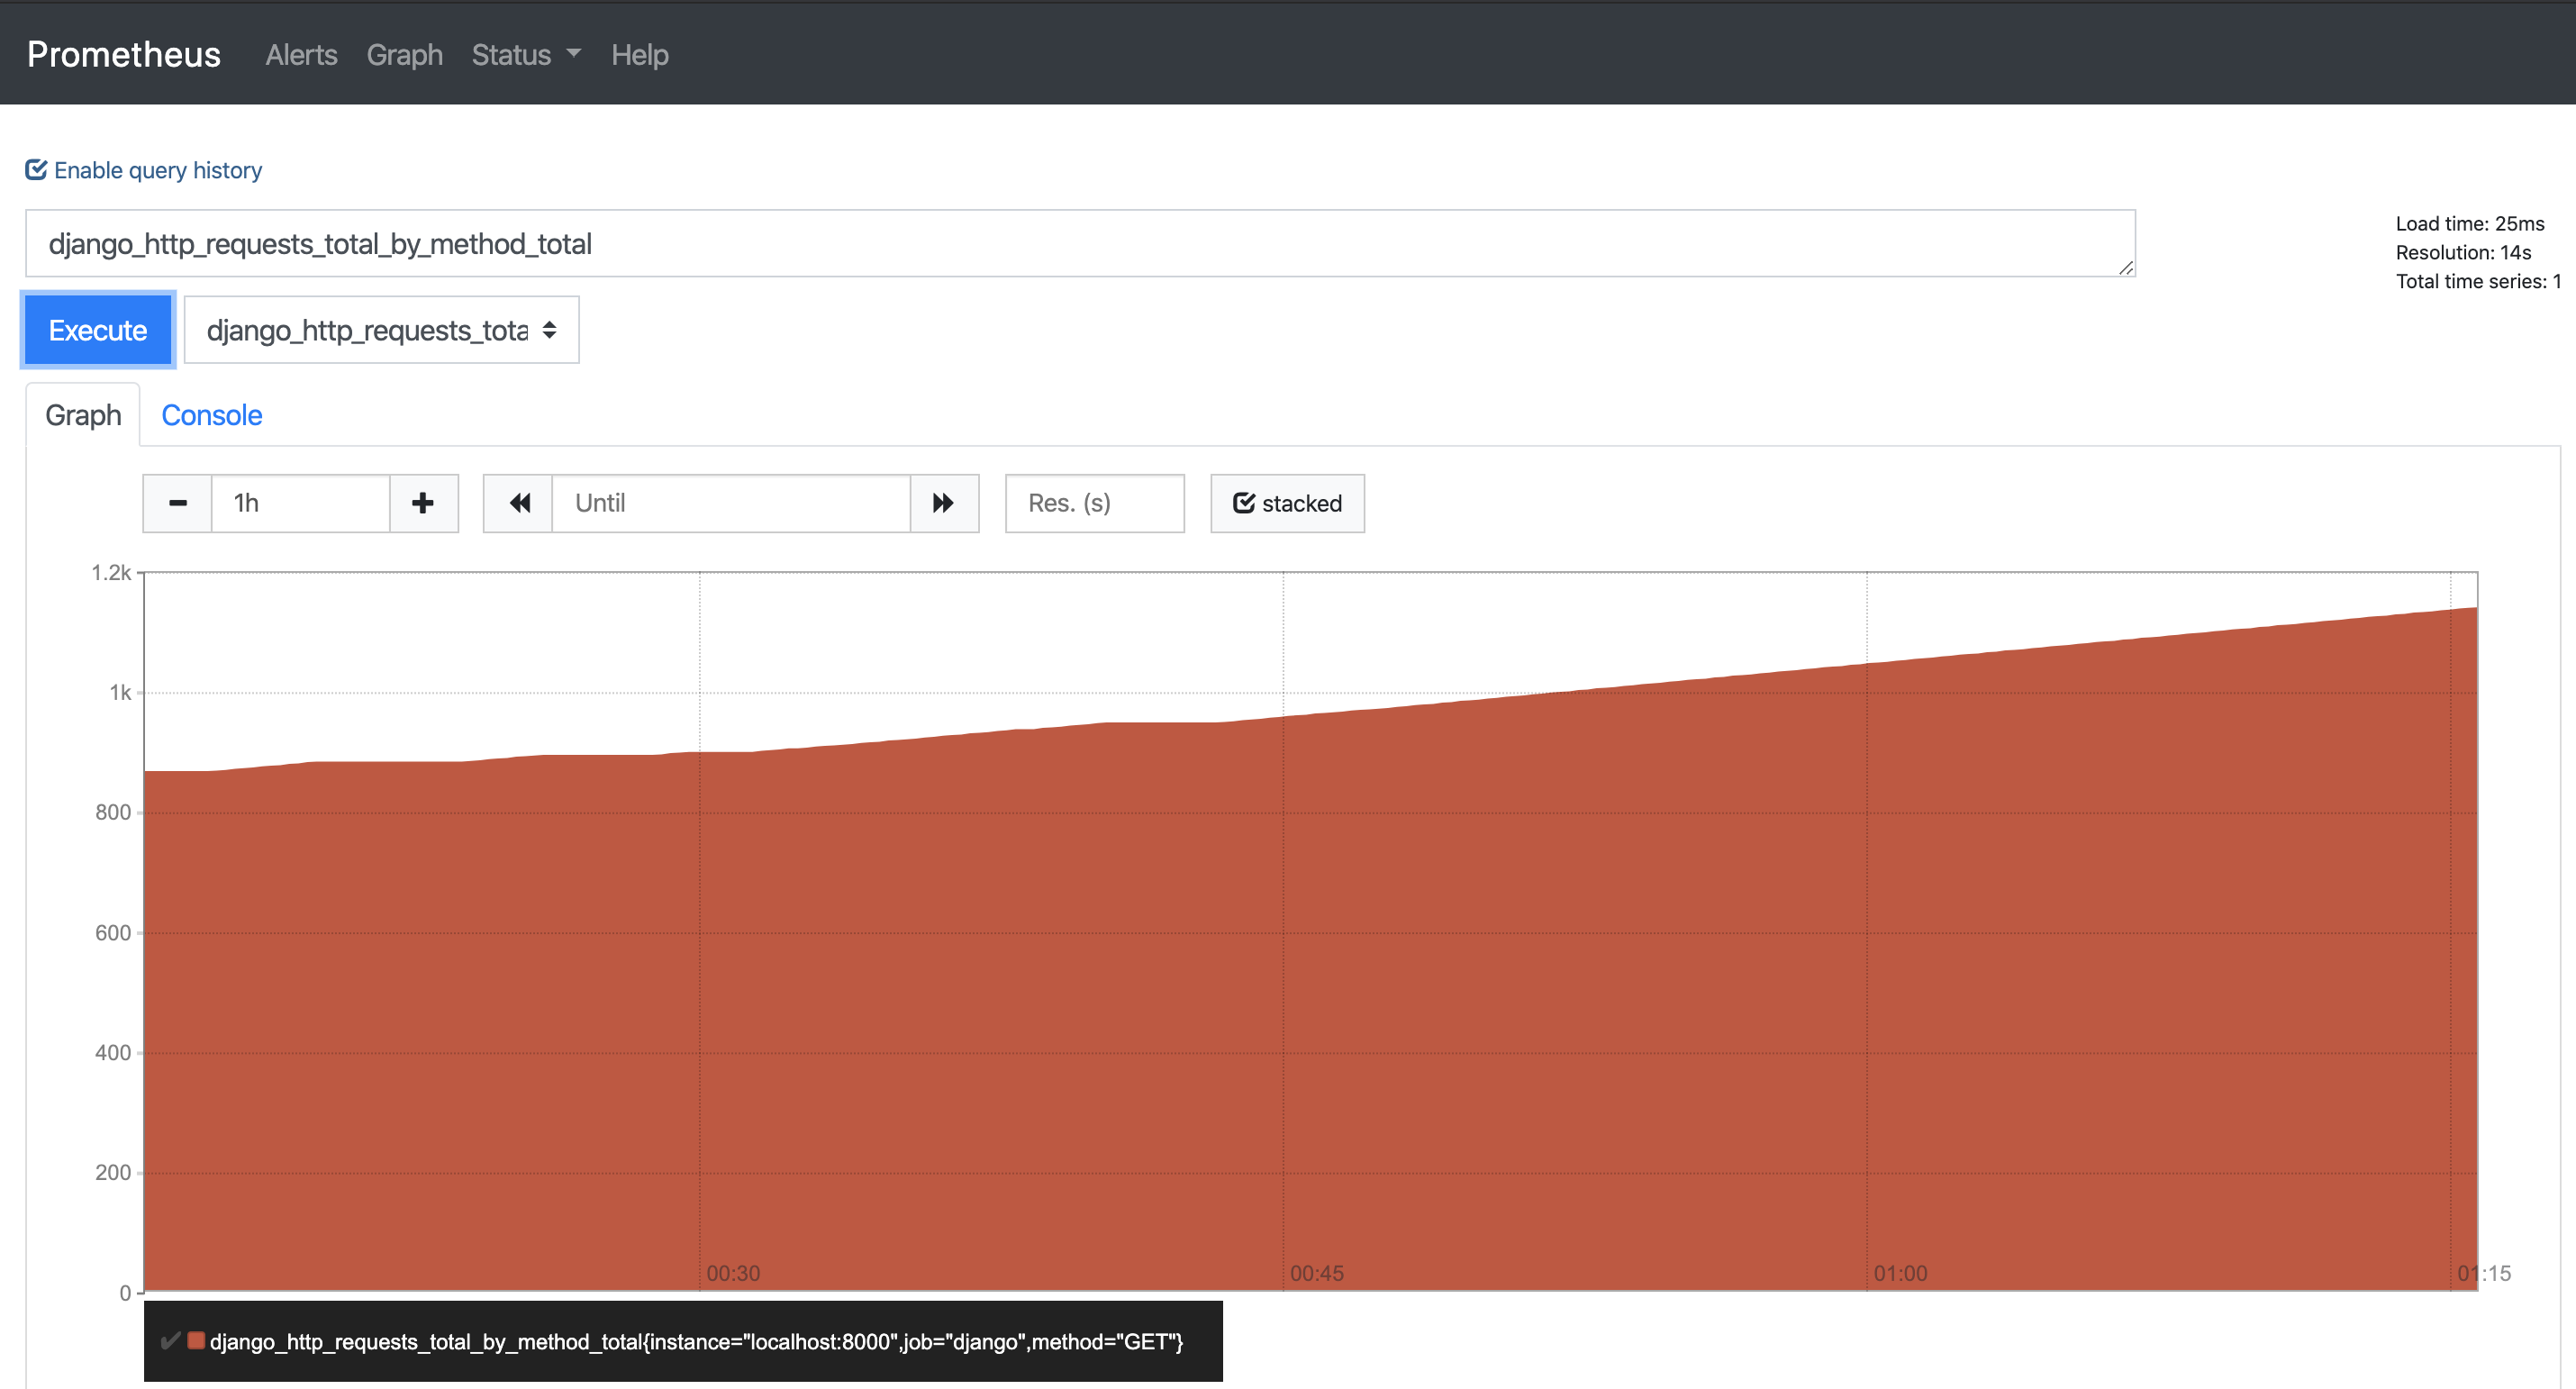
For example, you can visit the below page, which graphs the total number of http requests your Django application received in the last hour:
Graph of Django HTTP requests, served on localhost
It should look something like this:
If you'd like to do more testing, visit your Django application several more times and reload the Prometheus Expression Browser to confirm that it is working. Also feel free to explore the other Django metrics that Prometheus is collecting.
Django-prometheus is quite powerful, and allows you to easily instrument additional aspects of your application, including:
- Your databases
- Your models (for example, monitor the creation/deletion/update rate for your models)
- Your caches
- Your own custom metrics in your code
More information on how to do all of these is here.
Congratulations. you are now monitoring your Django application with Prometheus.
