Note: Data used here are modified from KITTI dataset.
10_3d_pointcloud 08_2d_visualization
- update your forked repo from my repo(ref)
- following 01_git, create a new branch
LAST#_11projectionin your forked repo - activate the environment you created in 03_conda
- create a notebook under
submissionsand name asLAST#.ipynb - start
jupyterlab, it should open a window in your browser. open yourLAST#.ipynb - following 10_3d_pointcloud, read image
image.png, read calibration matrices fromcalib.txtand point cloud fromvelo.bin; do the preprocessing - plot projected point cloud
- Last tutorial we said X2 = R0_rect @ Tr_velo_to_cam @ X1 to transfer point clouds from Velodyne coordinate to rectified camera coordinate. Here we just need further P2 to project from rectified camera coordinate to camera 2 coordinate, X3 = P2 @ R0_rect @ Tr_velo_to_cam @ X1.
- prepare all metrics into homogeneous and perform the above calculation (remember to transpose); drop the last column in X3
- divide x (first column) and y (second column) in X3 by z(third column)(why)
- get the index of points that are inside the image view (i.e., x within [0, width) and y within [0, height)) and farther away than 2 meters (z > 2, filter out points that are too close to the sensor)
- use the following code to create a figure:
    px = 1 / plt.rcParams['figure.dpi']  # pixel in inches
    h, w = im.height, im.width
    fig, ax = plt.subplots(1, 1, figsize=(w*px, h*px))
    ax.set_xlim([0, w])
    ax.set_ylim([h, 0])
- plot the scatter on the figure (
ax.scatter()); set marker size to 3 and colors to 1/z (you can use z as well. 1/z is just further scaling the distance to make colors more differentiated in the figure. you can plot both and compare.); you should see the following: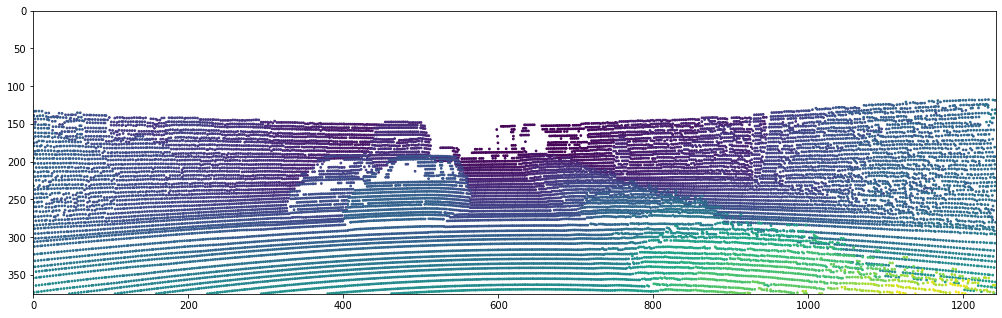
- read
label.txt, parse each line, skip "DontCare" class, get 2D bounding box, and plot it (similar to what we did in 08_2d_visulization); you should see the following: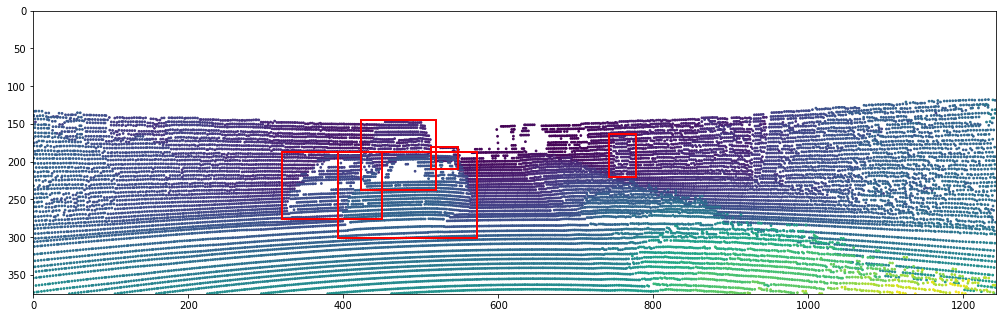
- plot image as well (
ax.imshow()); you should see the following: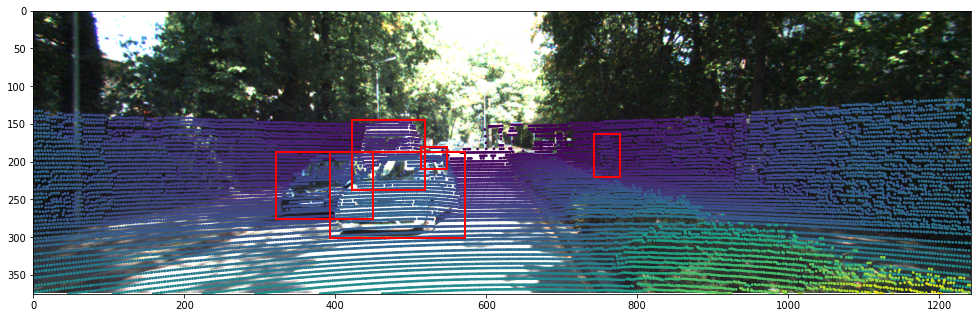
- stage changes, commit with the message "learning KITTI", push and submit a pr


