车道检查(Advanced Lane Finding Project)
项目实现步骤:
- 使用提供的一组棋盘格图片计算相机校正矩阵(camera calibration matrix)和失真系数(distortion coefficients).
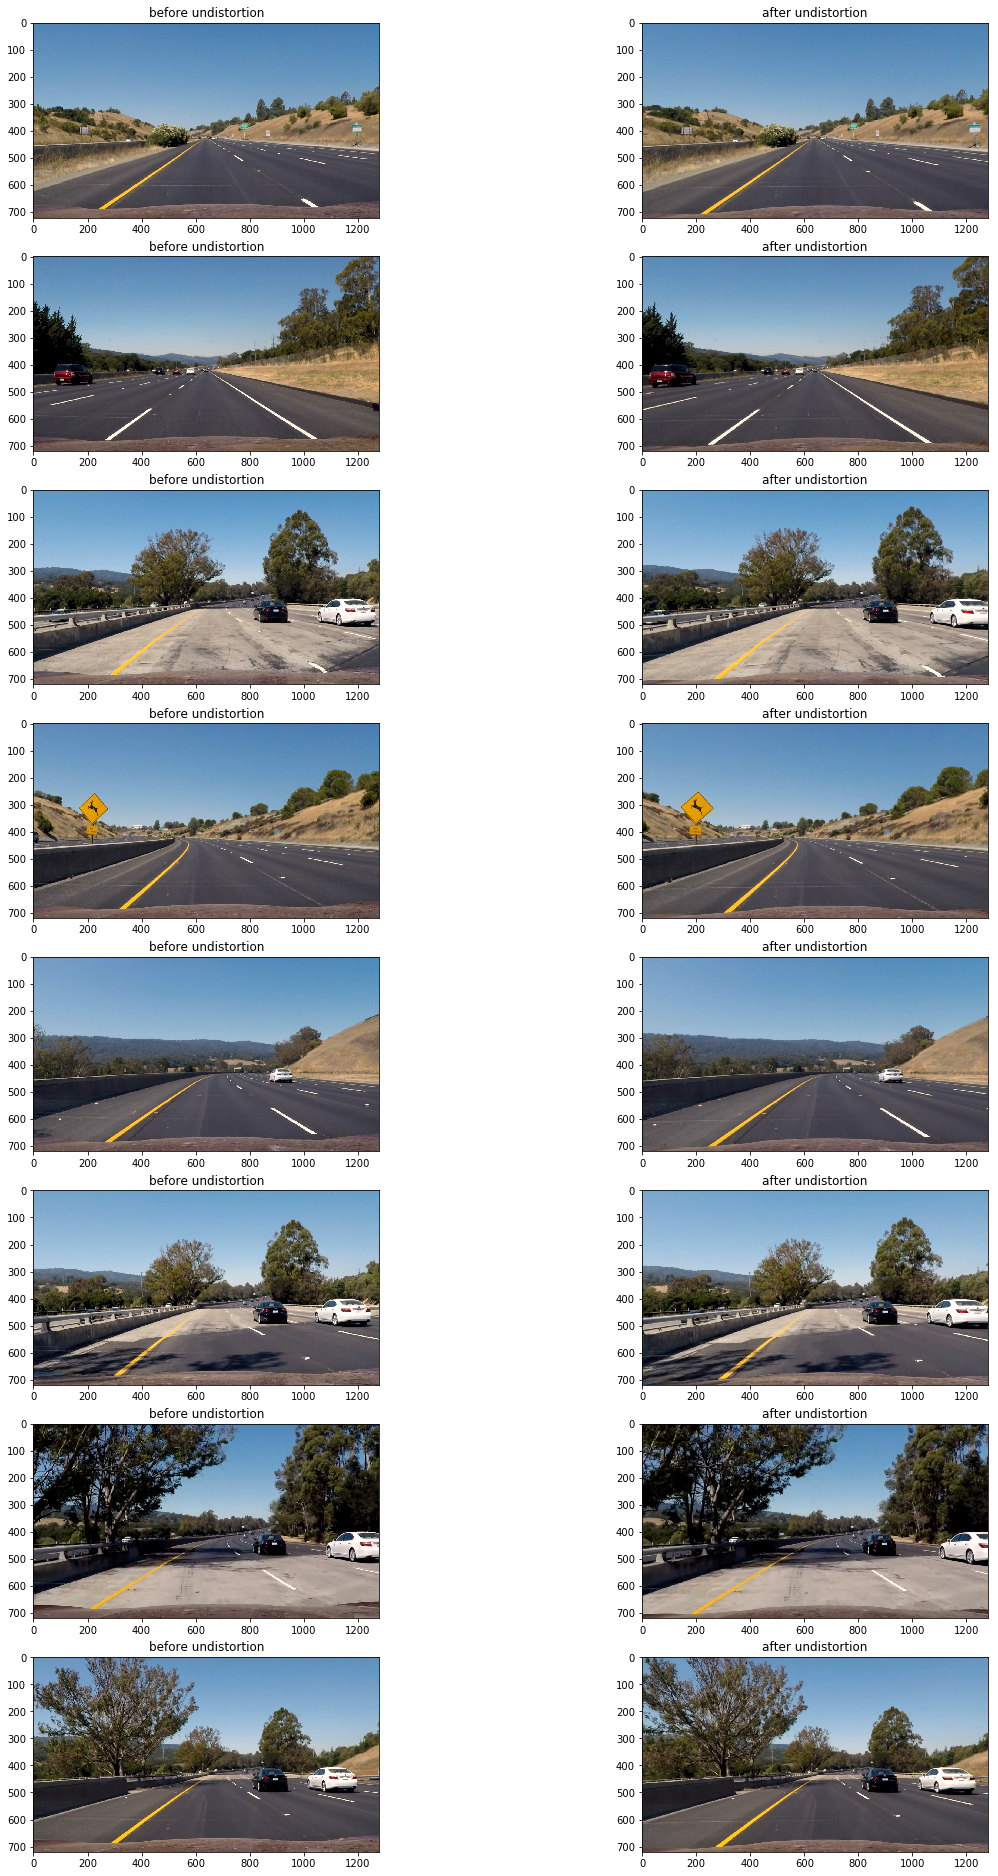
- 校正图片
- 使用梯度阈值(gradient threshold),颜色阈值(color threshold)等处理图片得到清晰捕捉车道线的二进制图(binary image).
- 使用透视变换(perspective transform)得到二进制图(binary image)的鸟瞰图(birds-eye view).
- 检测属于车道线的像素并用它来测出车道边界.
- 计算车道曲率及车辆相对车道中央的位置.
- 使用透视变换(perspective transform)把得到的车道边界变换会原图视角并镶嵌到原图上.
- 处理图片展示车道区域,及车道的曲率和车辆位置.
这里会使用opencv提供的方法通过棋盘格图片组计算相机校正矩阵(camera calibration matrix)和失真系数(distortion coefficients)。首先要得到棋盘格内角的世界坐标"object points"和对应图片坐标"image point"。假设棋盘格内角世界坐标的z轴为0,棋盘在(x,y)面上,则对于每张棋盘格图片组的图片而言,对应"object points"都是一样的。而通过使用openCv的cv2.findChessboardCorners(),传入棋盘格的灰度(grayscale)图片和横纵内角点个数就可得到图片内角的"image point"。
def get_obj_img_points(images,grid=(9,6)):
    object_points=[]
    img_points = []
    for img in images:
        #生成object points
        object_point = np.zeros( (grid[0]*grid[1],3),np.float32 )
        object_point[:,:2]= np.mgrid[0:grid[0],0:grid[1]].T.reshape(-1,2)
        #得到灰度图片
        gray = cv2.cvtColor(img,cv2.COLOR_BGR2GRAY)
        #得到图片的image points
        ret, corners = cv2.findChessboardCorners(gray, grid, None)
        if ret:
            object_points.append(object_point)
            img_points.append(corners)
    return object_points,img_points
然后使用上方法得到的object_points and img_points 传入cv2.calibrateCamera() 方法中就可以计算出相机校正矩阵(camera calibration matrix)和失真系数(distortion coefficients),再使用 cv2.undistort()方法就可得到校正图片。
def cal_undistort(img, objpoints, imgpoints):
    ret, mtx, dist, rvecs, tvecs = cv2.calibrateCamera(objpoints, imgpoints, img.shape[1::-1], None, None)
    dst = cv2.undistort(img, mtx, dist, None, mtx)
    return dst
以下为其中一张棋盘格图片校正前后对比:
代码如下:
#获取棋盘格图片
cal_imgs = utils.get_images_by_dir('camera_cal')
#计算object_points,img_points
object_points,img_points = utils.calibrate(cal_imgs,grid=(9,6))
#获取测试图片
test_imgs = utils.get_images_by_dir('test_images')

#校正测试图片
undistorted = []
for img in test_imgs:
    img = utils.cal_undistort(img,object_points,img_points)
    undistorted.append(img)
这里会使用梯度阈值(gradient threshold),颜色阈值(color threshold)等来处理校正后的图片,捕获车道线所在位置的像素。(这里的梯度指的是颜色变化的梯度)
以下方法通过"cv2.Sobel()"方法计算x轴方向或y轴方向的颜色变化梯度导数,并以此进行阈值过滤(thresholding),得到二进制图(binary image):
def abs_sobel_thresh(img, orient='x', thresh_min=0, thresh_max=255):
    #装换为灰度图片
    gray = cv2.cvtColor(img, cv2.COLOR_RGB2GRAY)
    #使用cv2.Sobel()计算计算x方向或y方向的导数
    if orient == 'x':
        abs_sobel = np.absolute(cv2.Sobel(gray, cv2.CV_64F, 1, 0))
    if orient == 'y':
        abs_sobel = np.absolute(cv2.Sobel(gray, cv2.CV_64F, 0, 1))
    #阈值过滤
    scaled_sobel = np.uint8(255*abs_sobel/np.max(abs_sobel))
    binary_output = np.zeros_like(scaled_sobel)
    binary_output[(scaled_sobel >= thresh_min) & (scaled_sobel <= thresh_max)] = 1

    return binary_output
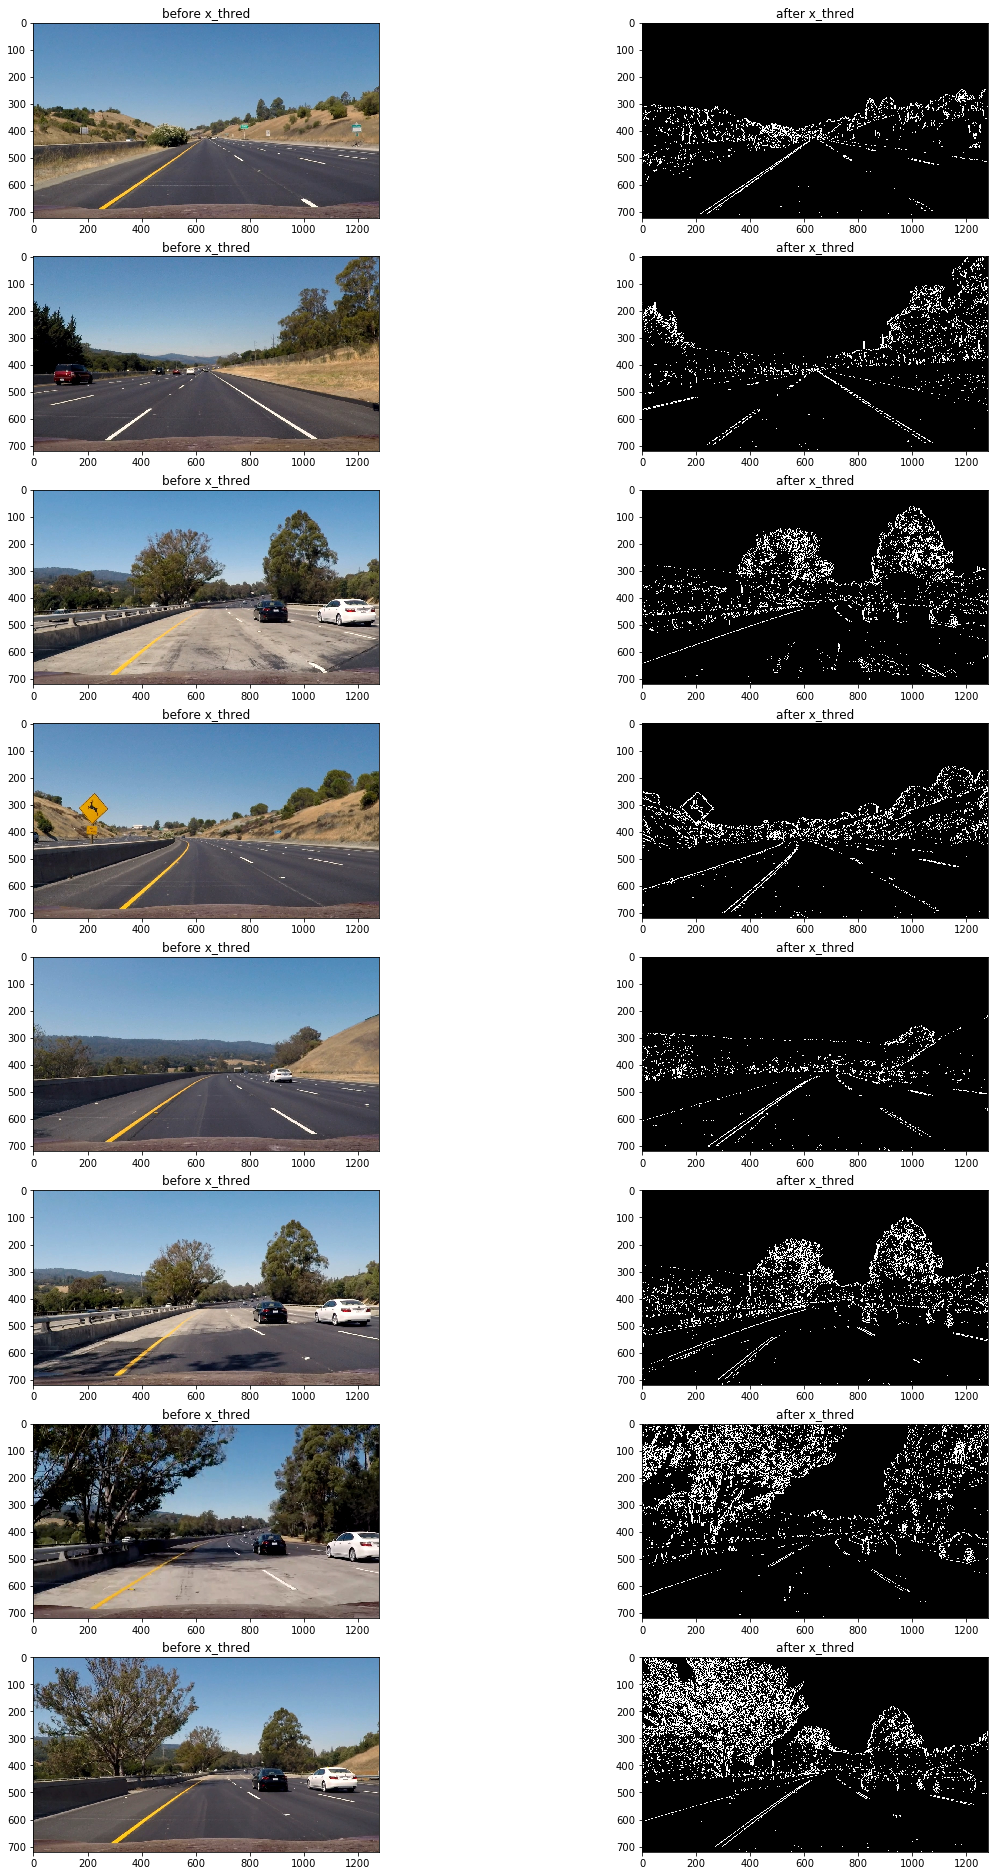
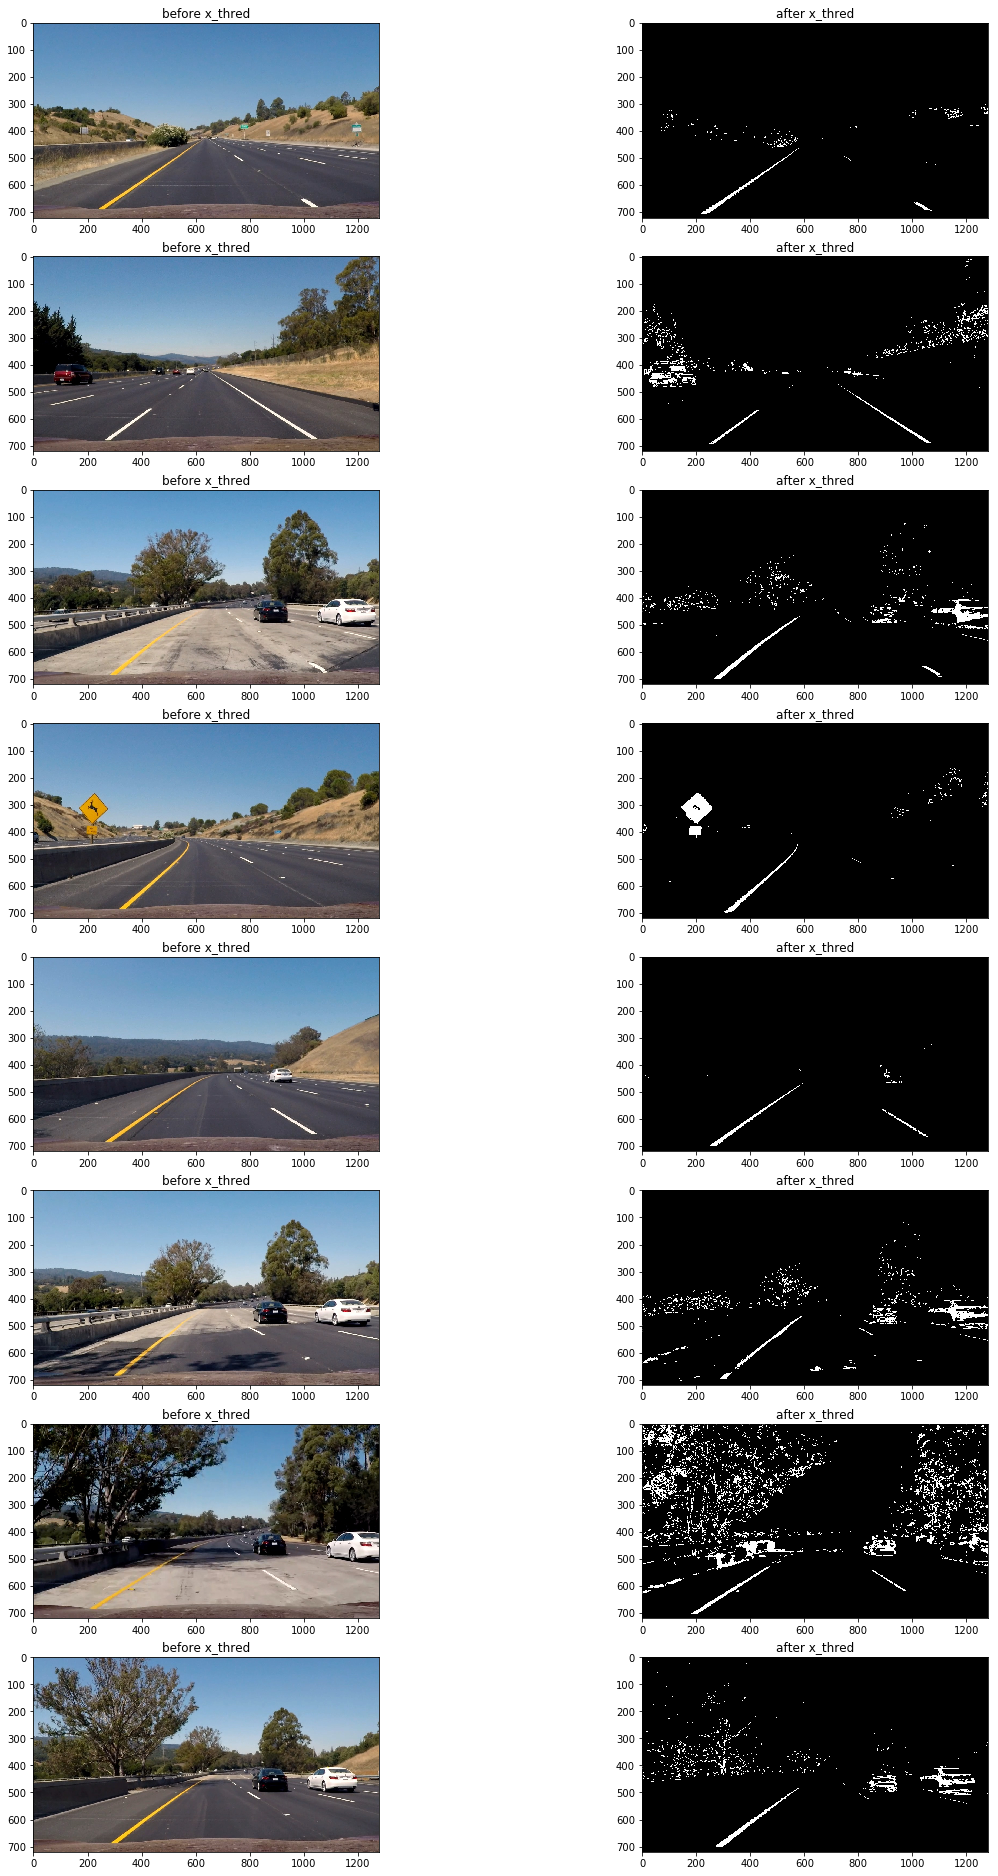
通过测试发现使用x轴方向阈值在35到100区间过滤得出的二进制图可以捕捉较为清晰的车道线:
x_thresh = utils.abs_sobel_thresh(img, orient='x', thresh_min=35, thresh_max=100)
可以看到该方法的缺陷是在路面颜色相对较浅且车道线颜色为黄色时,无法捕捉到车道线(第三,第六,第七张图),但在其他情况车道线捕捉效果还是不错的。
接下来测试一下使用全局的颜色变化梯度来进行阈值过滤:
def mag_thresh(img, sobel_kernel=3, mag_thresh=(0, 255)):
    # Convert to grayscale
    gray = cv2.cvtColor(img, cv2.COLOR_RGB2GRAY)
    # Take both Sobel x and y gradients
    sobelx = cv2.Sobel(gray, cv2.CV_64F, 1, 0, ksize=sobel_kernel)
    sobely = cv2.Sobel(gray, cv2.CV_64F, 0, 1, ksize=sobel_kernel)
    # Calculate the gradient magnitude
    gradmag = np.sqrt(sobelx**2 + sobely**2)
    # Rescale to 8 bit
    scale_factor = np.max(gradmag)/255
    gradmag = (gradmag/scale_factor).astype(np.uint8)
    # Create a binary image of ones where threshold is met, zeros otherwise
    binary_output = np.zeros_like(gradmag)
    binary_output[(gradmag >= mag_thresh[0]) & (gradmag <= mag_thresh[1])] = 1

    # Return the binary image
    return binary_output
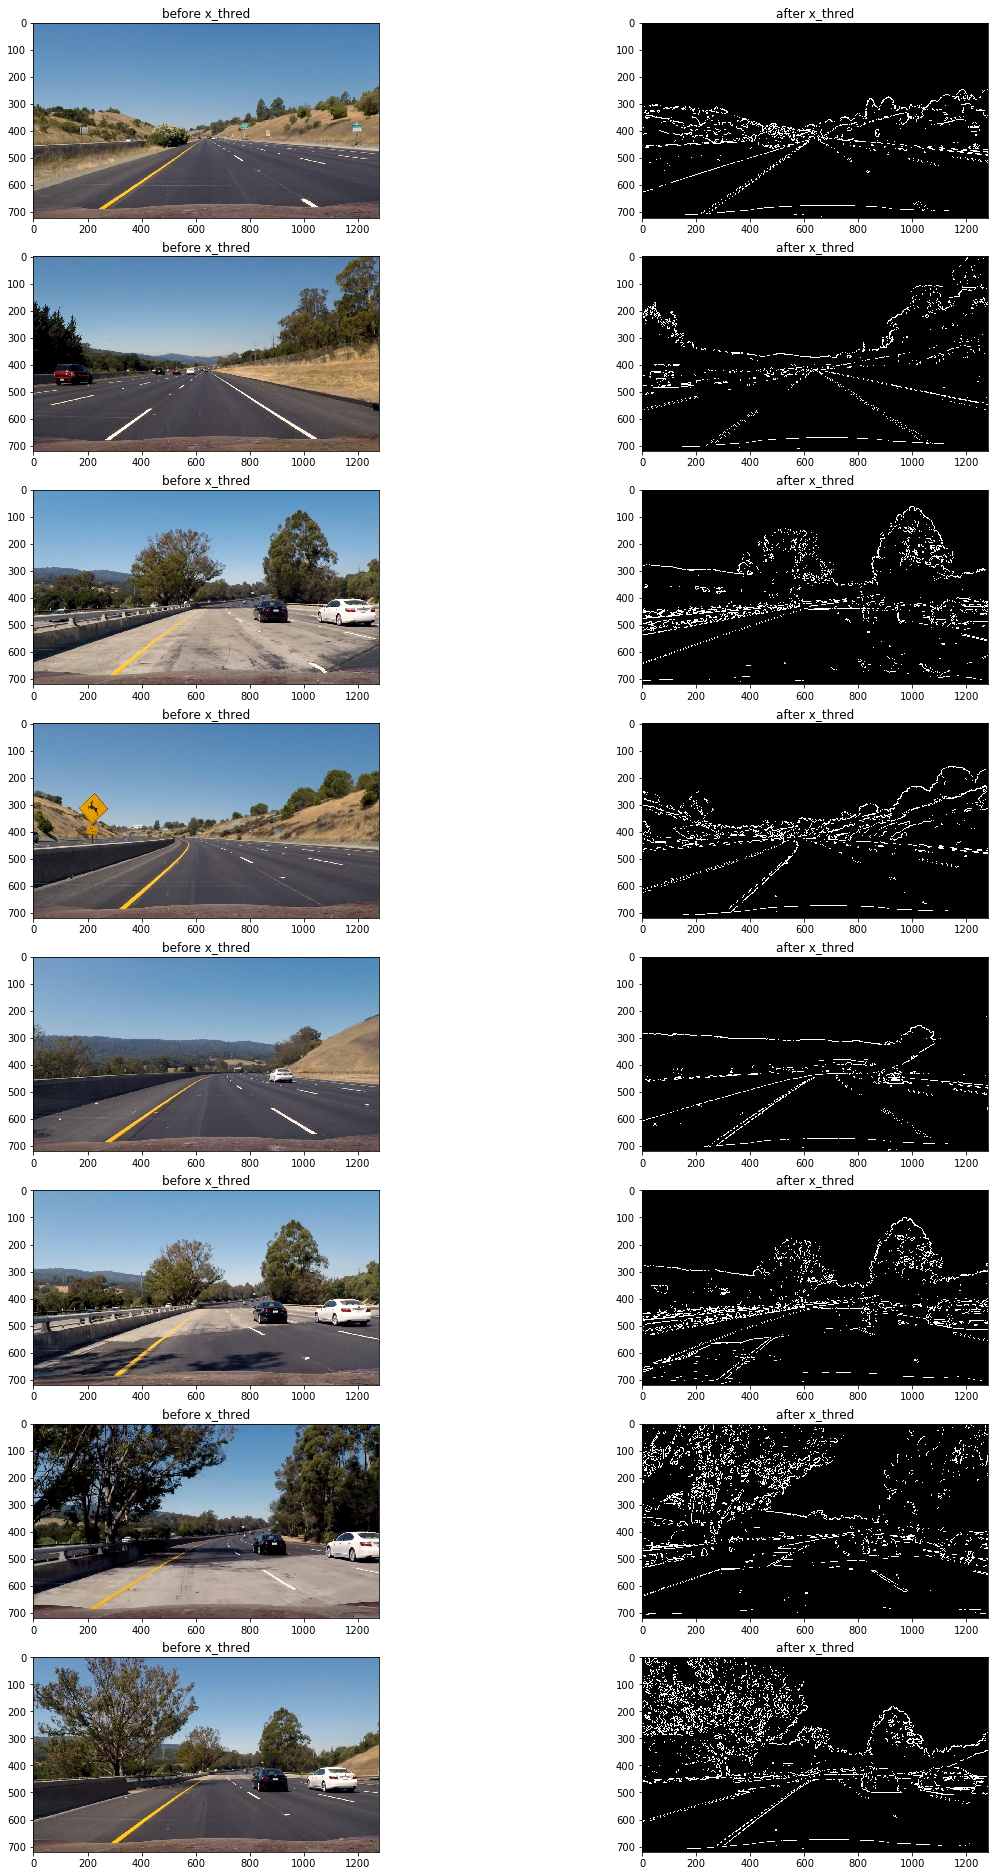
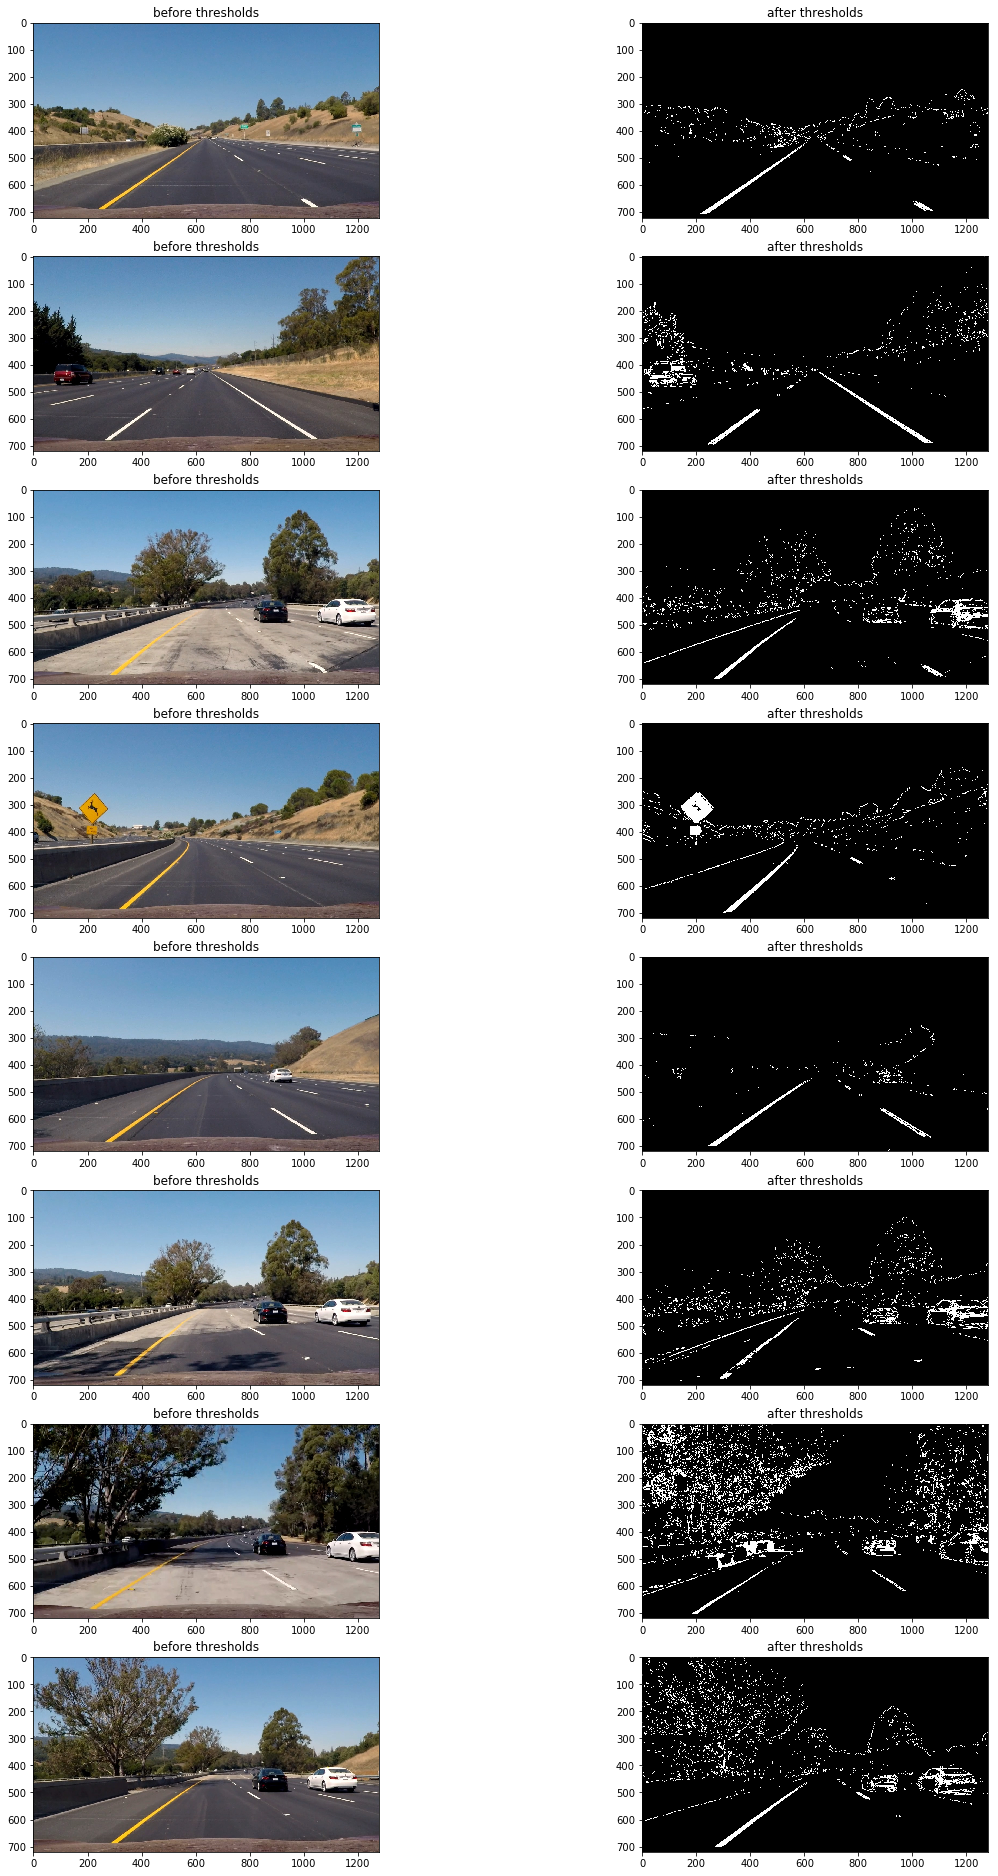
mag_thresh = utils.mag_thresh(img, sobel_kernel=9, mag_thresh=(50, 100))
结果仍然不理想(观察第三,第六,第七张图片),原因是当路面颜色相对较浅且车道线颜色为黄色时,颜色变化梯度较小,想要把捕捉车道线需要把阈值下限调低,然而这样做同时还会捕获大量的噪音像素,效果会更差。
Still not capable of capture the lane line where both the road and lane color are light.(See 3rd,6th,7th image)
So I turn to direction threshholds:
def dir_threshold(img, sobel_kernel=3, thresh=(0, np.pi/2)):
    # Grayscale
    gray = cv2.cvtColor(img, cv2.COLOR_RGB2GRAY)
    # Calculate the x and y gradients
    sobelx = cv2.Sobel(gray, cv2.CV_64F, 1, 0, ksize=sobel_kernel)
    sobely = cv2.Sobel(gray, cv2.CV_64F, 0, 1, ksize=sobel_kernel)
    # Take the absolute value of the gradient direction,
    # apply a threshold, and create a binary image result
    absgraddir = np.arctan2(np.absolute(sobely), np.absolute(sobelx))
    binary_output =  np.zeros_like(absgraddir)
    binary_output[(absgraddir >= thresh[0]) & (absgraddir <= thresh[1])] = 1

    # Return the binary image
    return binary_output
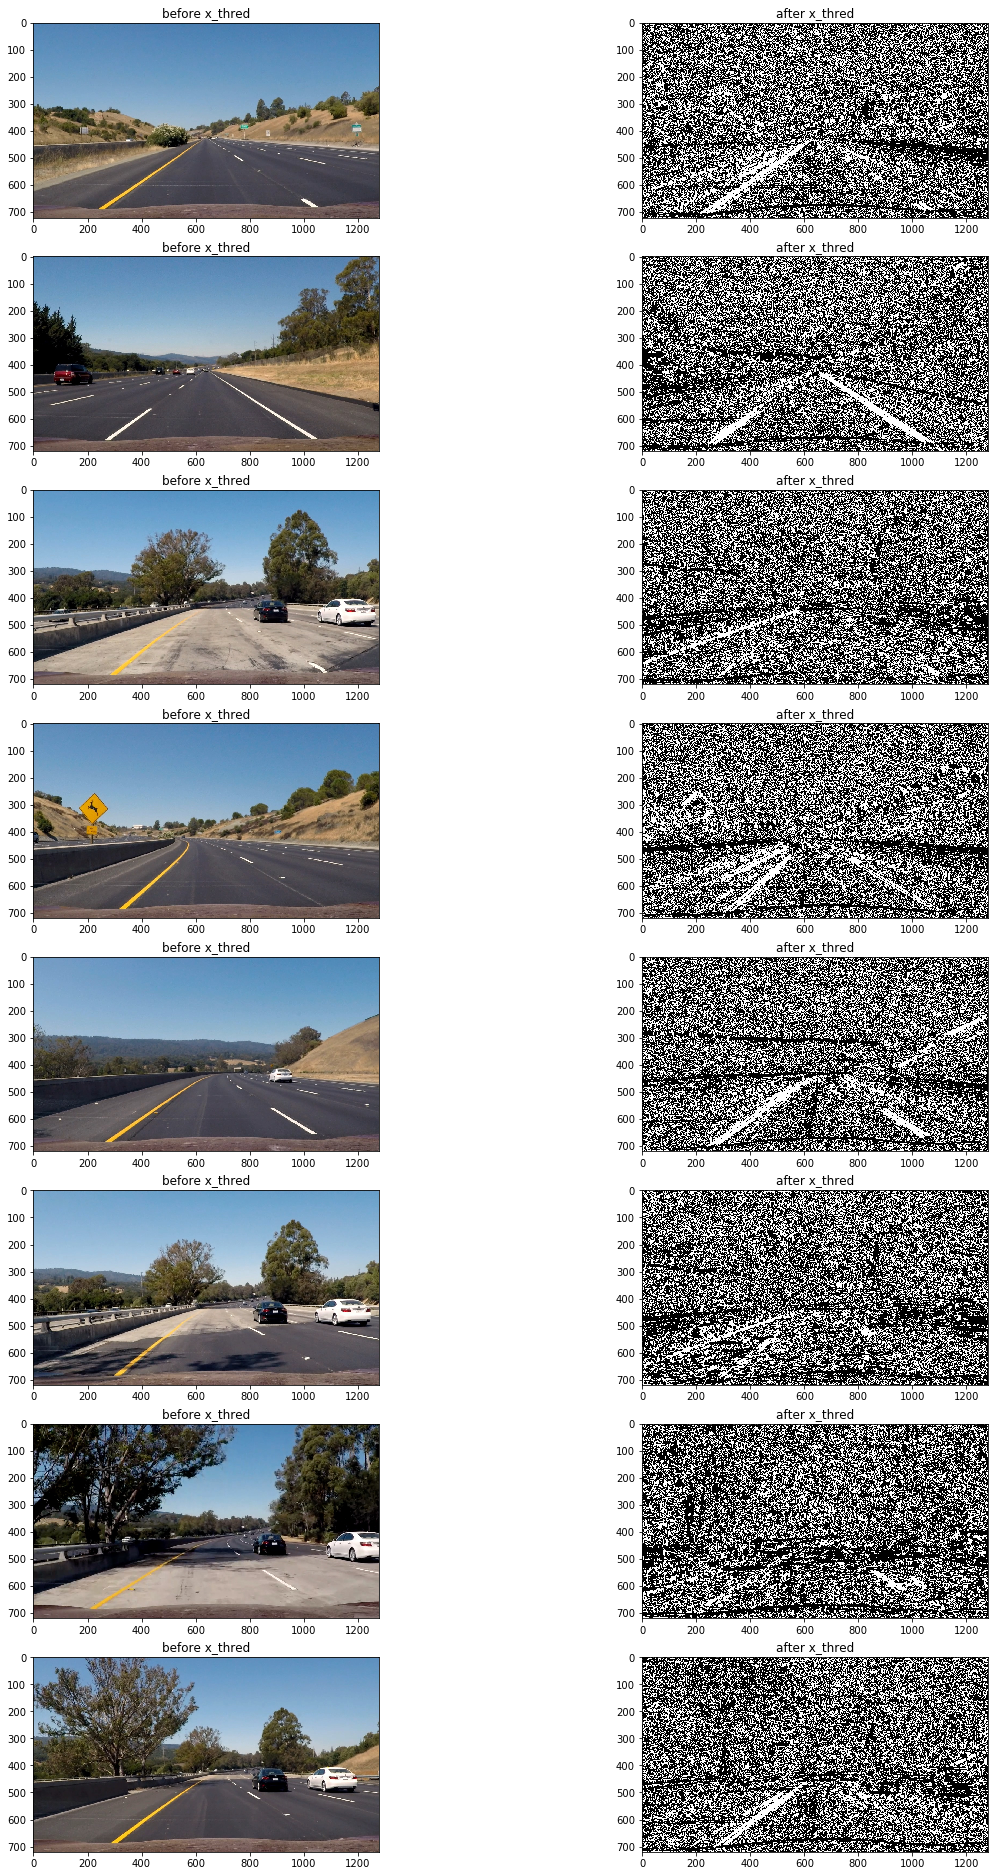
dir_thresh = utils.dir_threshold(img, sobel_kernel=21, thresh=(0.7, 1.3))
It seems a bit too much blur.
Seems gradient thresholds are not capable to handle this situation
How about color thresholds:
def hls_select(img,channel='s',thresh=(0, 255)):
    hls = cv2.cvtColor(img, cv2.COLOR_RGB2HLS)
    if channel=='h':
        channel = hls[:,:,0]
    elif channel=='l':
        channel=hls[:,:,1]
    else:
        channel=hls[:,:,2]
    binary_output = np.zeros_like(channel)
    binary_output[(channel > thresh[0]) & (channel <= thresh[1])] = 1
    return binary_output
s_thresh = utils.hls_select(img,channel='s',thresh=(180, 255))
The s color channel did a great job on capature the lane where both lane and road color are light.
But still it lose track of the lane on some place.
It seems difference thresholds capature lane line under difference situation.
So I used a combination of color and gradient thresholds to generate a binary image at the end. And after try a few difference pramemter and combination, I finaly got the result like this:
3. Describe how (and identify where in your code) you performed a perspective transform and provide an example of a transformed image.
The code for perspective transform is in the line 35-40 of file "utils.py" I chose to hardcode the source and destination points to calculate the transform matrix:
| Source | Destination |
|---|---|
| 585, 460 | 320, 0 |
| 203, 720 | 320, 720 |
| 1127, 720 | 960, 720 |
| 695, 460 | 960, 0 |
def get_M_Minv():
    src = np.float32([[(203, 720), (585, 460), (695, 460), (1127, 720)]])
    dst = np.float32([[(320, 720), (320, 0), (960, 0), (960, 720)]])
    M = cv2.getPerspectiveTransform(src, dst)
    Minv = cv2.getPerspectiveTransform(dst,src)
    return M,Minv
And then I use the transform matrix to performed perspective transform:
thresholded_wraped = cv2.warpPerspective(thresholded, M, img.shape[1::-1], flags=cv2.INTER_LINEAR)
The code for my perspective transform includes a function called warper(), which appears in lines 1 through 8 in the file example.py (output_images/examples/example.py) (or, for example, in the 3rd code cell of the IPython notebook). The warper() function takes as inputs an image (img), as well as source (src) and destination (dst) points. I chose the hardcode the source and destination points in the following manner:
src = np.float32(
    [[(img_size[0] / 2) - 55, img_size[1] / 2 + 100],
    [((img_size[0] / 6) - 10), img_size[1]],
    [(img_size[0] * 5 / 6) + 60, img_size[1]],
    [(img_size[0] / 2 + 55), img_size[1] / 2 + 100]])
dst = np.float32(
    [[(img_size[0] / 4), 0],
    [(img_size[0] / 4), img_size[1]],
    [(img_size[0] * 3 / 4), img_size[1]],
    [(img_size[0] * 3 / 4), 0]])
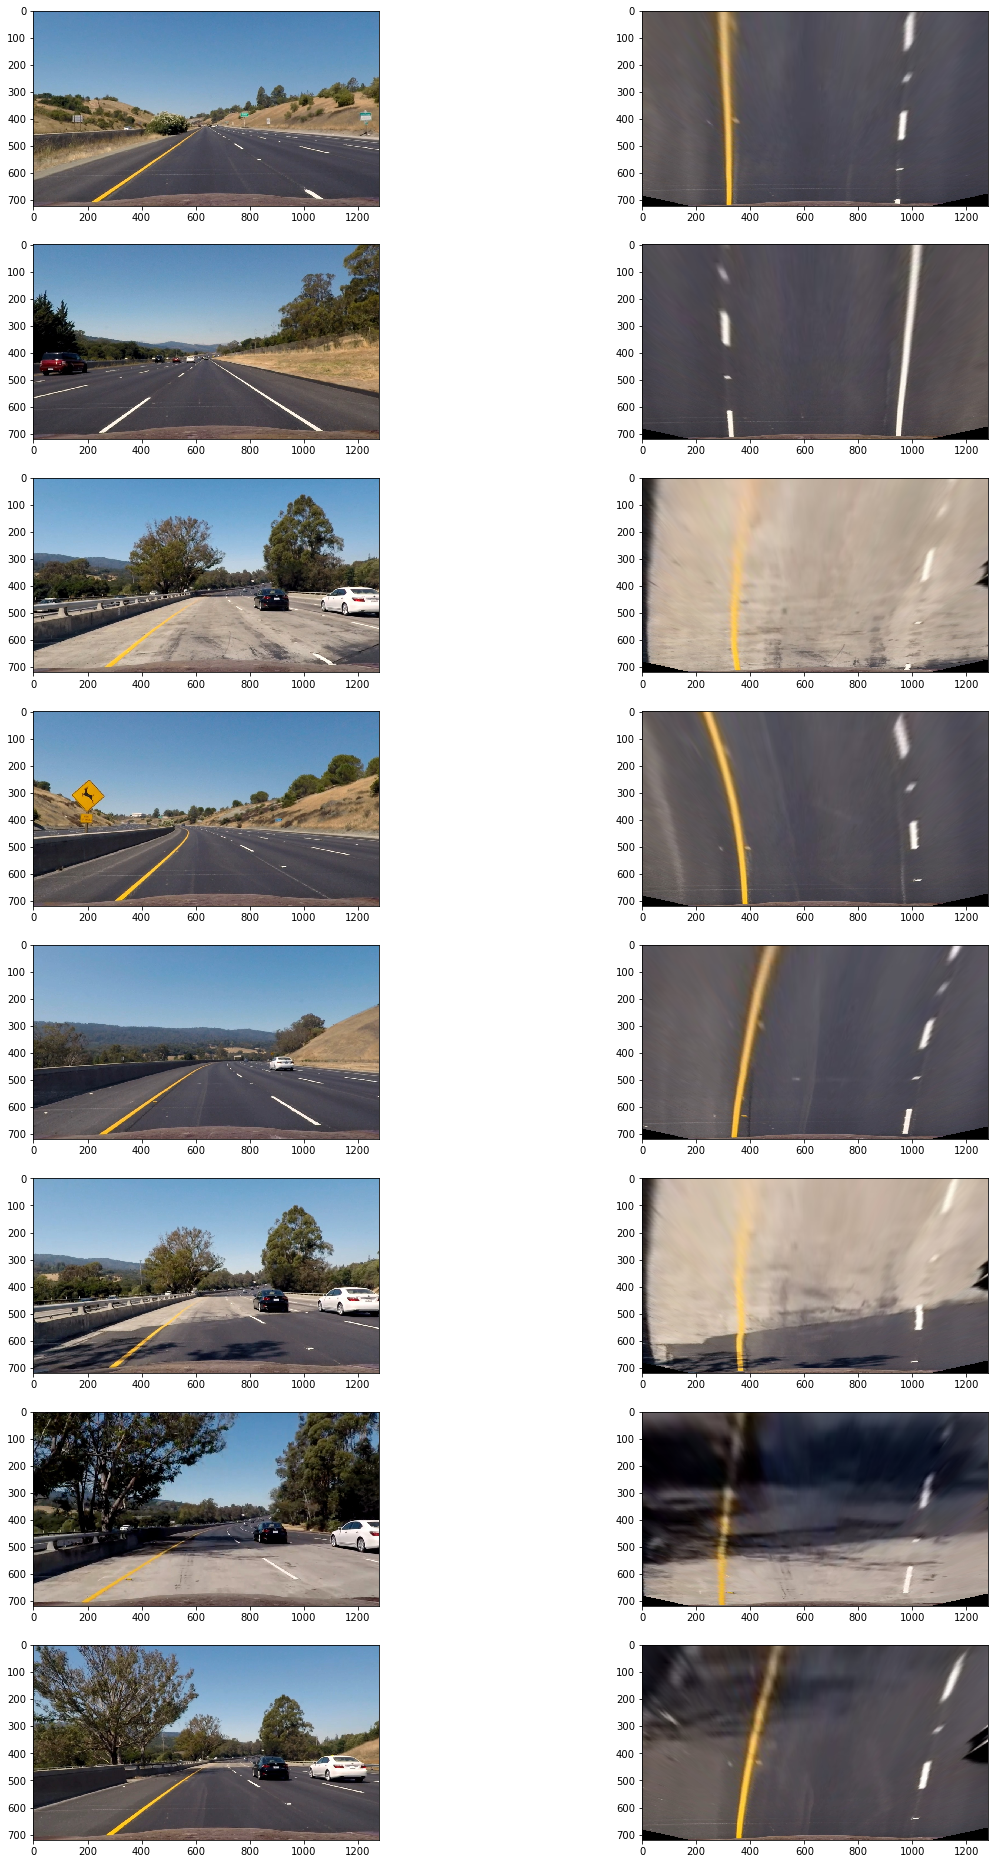
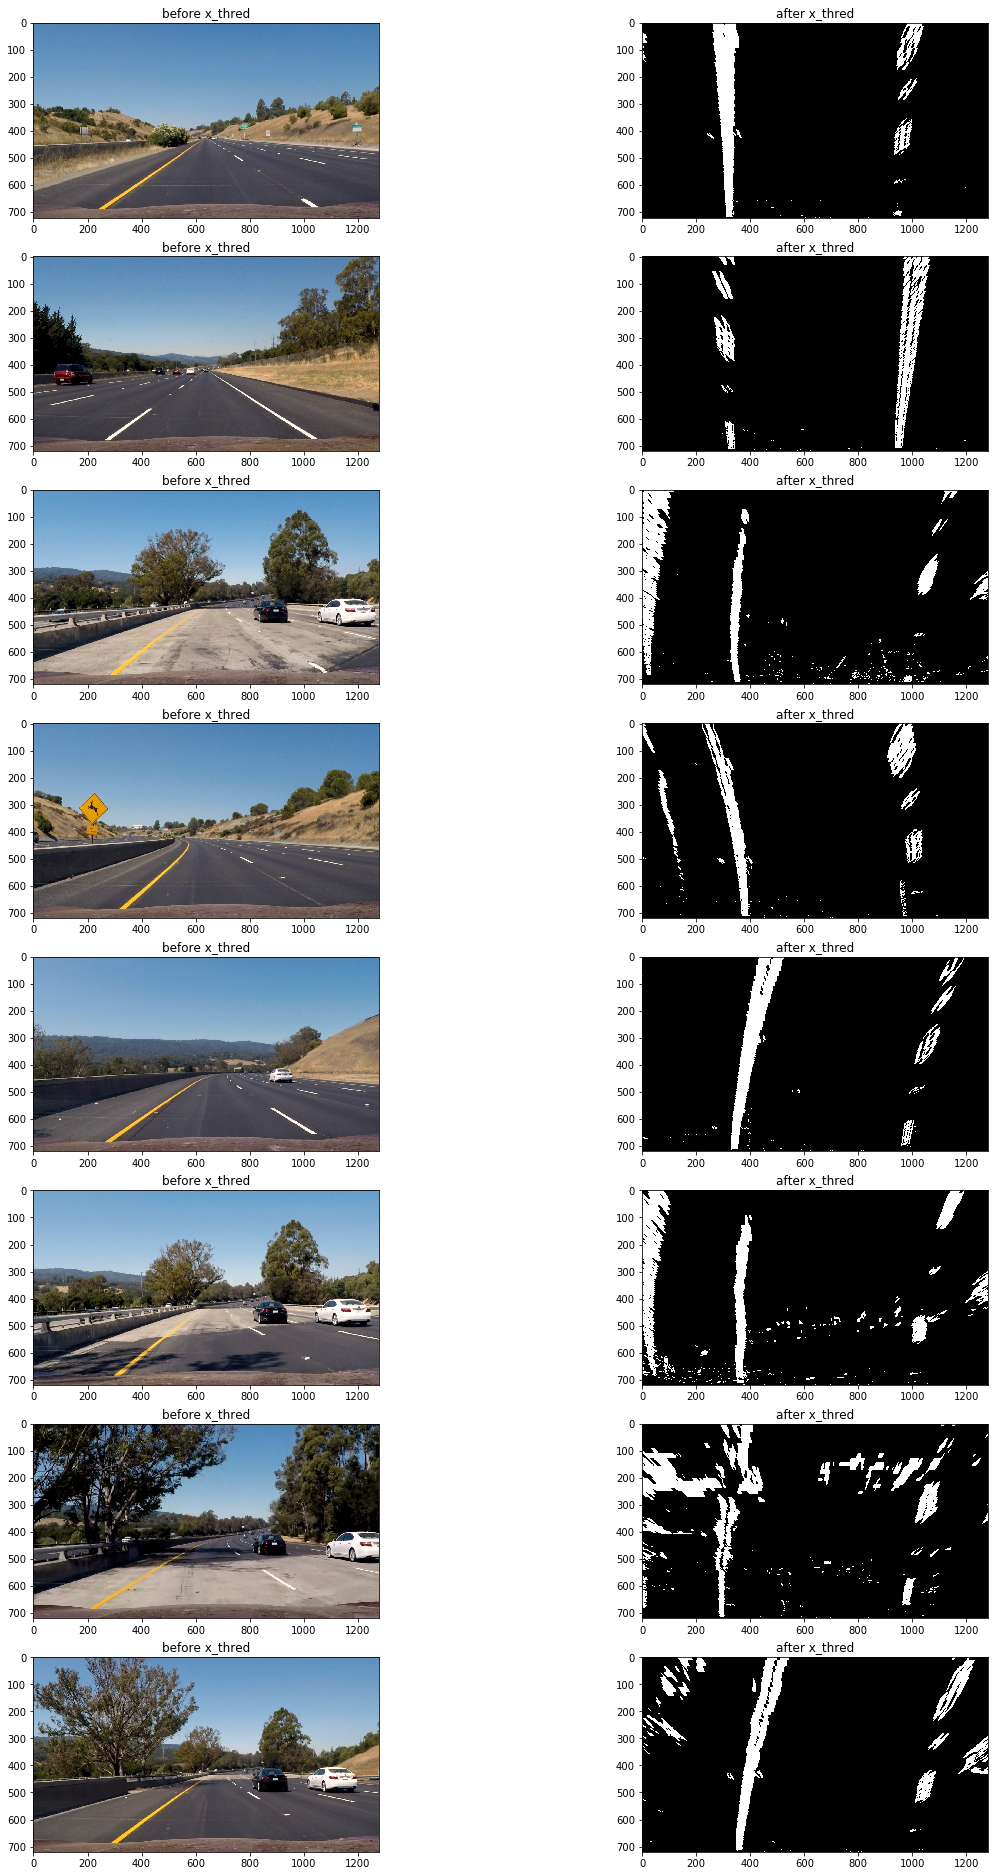
I verified that my perspective transform was working as expected that the lines appear parallel in the warped image.
And this is the result I got after I performed perspective transform to the threshholded image:
4. Describe how (and identify where in your code) you identified lane-line pixels and fit their positions with a polynomial?
The code for identified lane-line pixels is in the line 115-203 of file "utils.py"
I use the Peaks in a Histogram method to identified the x position of the lane lines in binary_wraped image.
This is how the Histogram of the test binary_wraped image:

Then I will use the sliding window to indentified the pixel that belong to the line:
def find_line(binary_warped):
    # Take a histogram of the bottom half of the image
    histogram = np.sum(binary_warped[binary_warped.shape[0]//2:,:], axis=0)
    # Find the peak of the left and right halves of the histogram
    # These will be the starting point for the left and right lines
    midpoint = np.int(histogram.shape[0]/2)
    leftx_base = np.argmax(histogram[:midpoint])
    rightx_base = np.argmax(histogram[midpoint:]) + midpoint

    # Choose the number of sliding windows
    nwindows = 9
    # Set height of windows
    window_height = np.int(binary_warped.shape[0]/nwindows)
    # Identify the x and y positions of all nonzero pixels in the image
    nonzero = binary_warped.nonzero()
    nonzeroy = np.array(nonzero[0])
    nonzerox = np.array(nonzero[1])
    # Current positions to be updated for each window
    leftx_current = leftx_base
    rightx_current = rightx_base
    # Set the width of the windows +/- margin
    margin = 100
    # Set minimum number of pixels found to recenter window
    minpix = 50
    # Create empty lists to receive left and right lane pixel indices
    left_lane_inds = []
    right_lane_inds = []

    # Step through the windows one by one
    for window in range(nwindows):
        # Identify window boundaries in x and y (and right and left)
        win_y_low = binary_warped.shape[0] - (window+1)*window_height
        win_y_high = binary_warped.shape[0] - window*window_height
        win_xleft_low = leftx_current - margin
        win_xleft_high = leftx_current + margin
        win_xright_low = rightx_current - margin
        win_xright_high = rightx_current + margin
        # Identify the nonzero pixels in x and y within the window
        good_left_inds = ((nonzeroy >= win_y_low) & (nonzeroy < win_y_high) &
        (nonzerox >= win_xleft_low) &  (nonzerox < win_xleft_high)).nonzero()[0]
        good_right_inds = ((nonzeroy >= win_y_low) & (nonzeroy < win_y_high) &
        (nonzerox >= win_xright_low) &  (nonzerox < win_xright_high)).nonzero()[0]
        # Append these indices to the lists
        left_lane_inds.append(good_left_inds)
        right_lane_inds.append(good_right_inds)
        # If you found > minpix pixels, recenter next window on their mean position
        if len(good_left_inds) > minpix:
            leftx_current = np.int(np.mean(nonzerox[good_left_inds]))
        if len(good_right_inds) > minpix:
            rightx_current = np.int(np.mean(nonzerox[good_right_inds]))

    # Concatenate the arrays of indices
    left_lane_inds = np.concatenate(left_lane_inds)
    right_lane_inds = np.concatenate(right_lane_inds)

    # Extract left and right line pixel positions
    leftx = nonzerox[left_lane_inds]
    lefty = nonzeroy[left_lane_inds]
    rightx = nonzerox[right_lane_inds]
    righty = nonzeroy[right_lane_inds]

    # Fit a second order polynomial to each
    left_fit = np.polyfit(lefty, leftx, 2)
    right_fit = np.polyfit(righty, rightx, 2)

    return left_fit, right_fit, left_lane_inds, right_lane_inds
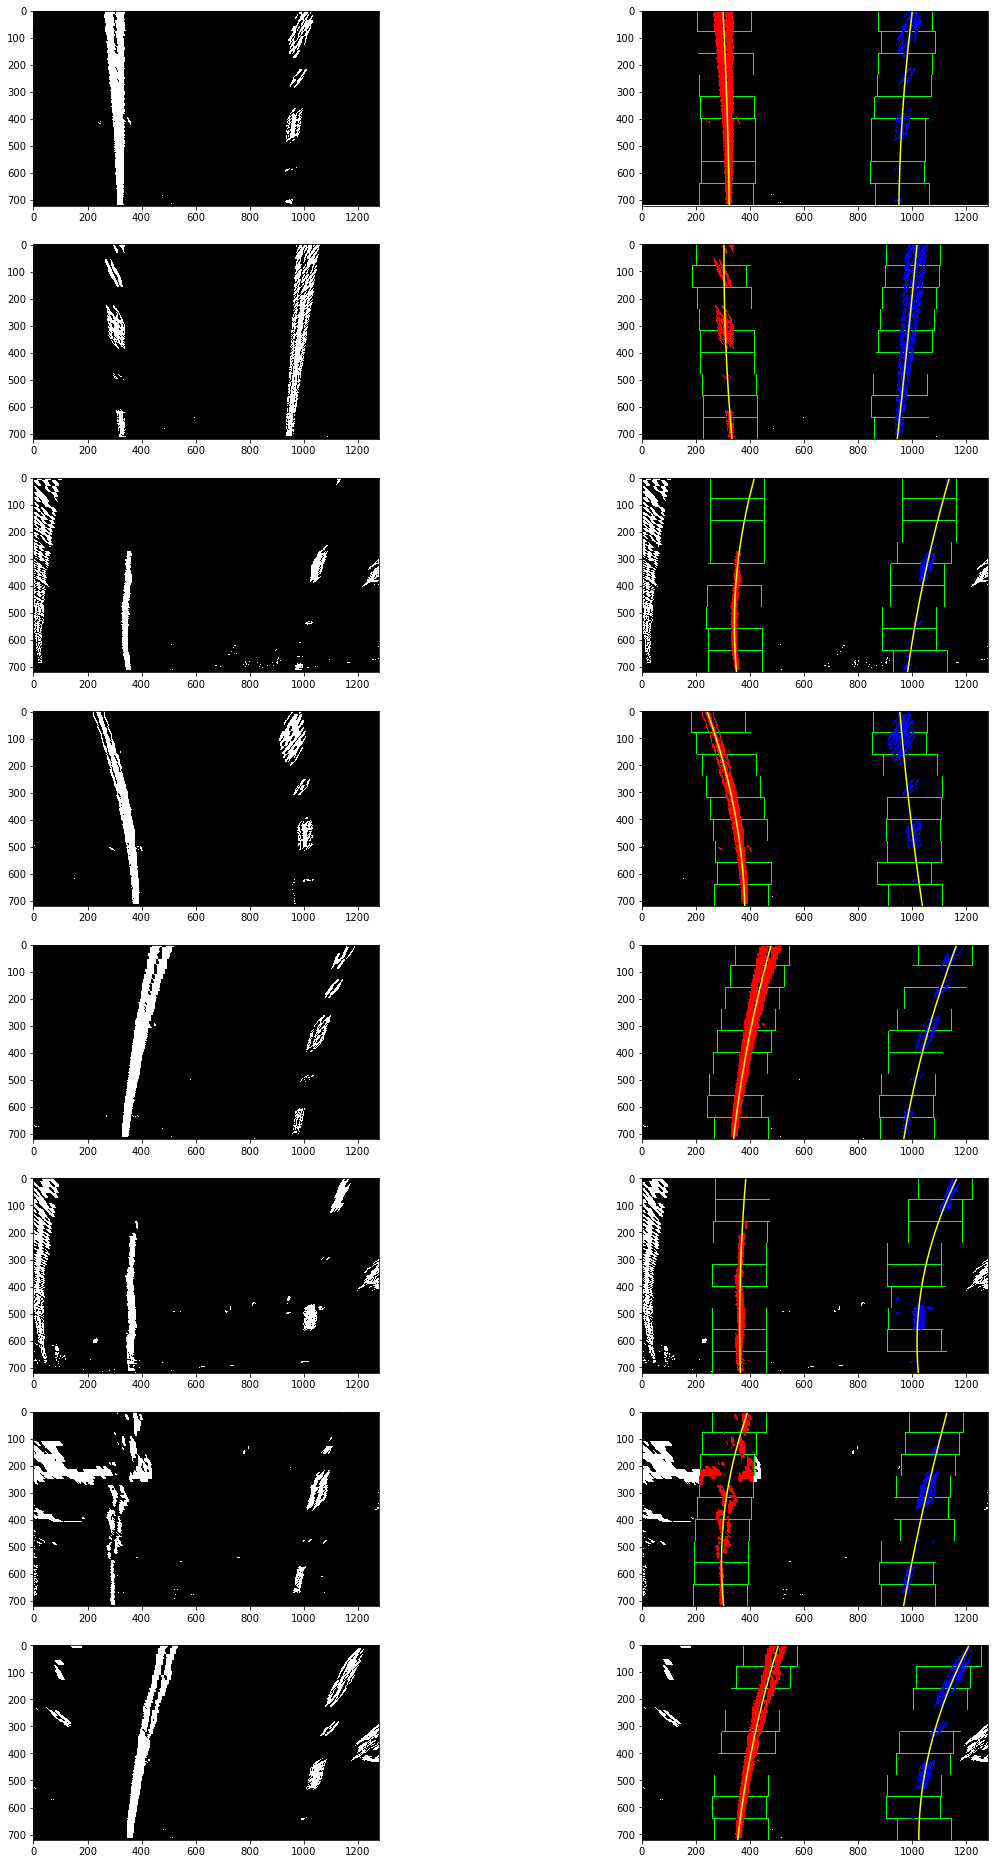
After I apply the find_line method and plot the 2nd order polynomial line to the binary_wraped images, I got the result:
5. Describe how (and identify where in your code) you calculated the radius of curvature of the lane and the position of the vehicle with respect to center.
The code for calculated the radius of curvature of the lane and the position of the vehicle with respect to center is in the line 115-203 of file "utils.py"
I difine a function that take a binary_wraped image,the left and right lane polynomial coefficients and output the radius of curvature of the lane and the position of the vehicle with respect to center.
def calculate_curv_and_pos(binary_warped,left_fit, right_fit):
    # Define y-value where we want radius of curvature
    ploty = np.linspace(0, binary_warped.shape[0]-1, binary_warped.shape[0] )
    leftx = left_fit[0]*ploty**2 + left_fit[1]*ploty + left_fit[2]
    rightx = right_fit[0]*ploty**2 + right_fit[1]*ploty + right_fit[2]
    # Define conversions in x and y from pixels space to meters
    ym_per_pix = 30/720 # meters per pixel in y dimension
    xm_per_pix = 3.7/700 # meters per pixel in x dimension
    y_eval = np.max(ploty)
    # Fit new polynomials to x,y in world space
    left_fit_cr = np.polyfit(ploty*ym_per_pix, leftx*xm_per_pix, 2)
    right_fit_cr = np.polyfit(ploty*ym_per_pix, rightx*xm_per_pix, 2)
    # Calculate the new radii of curvature
    left_curverad = ((1 + (2*left_fit_cr[0]*y_eval*ym_per_pix + left_fit_cr[1])**2)**1.5) / np.absolute(2*left_fit_cr[0])
    right_curverad = ((1 + (2*right_fit_cr[0]*y_eval*ym_per_pix + right_fit_cr[1])**2)**1.5) / np.absolute(2*right_fit_cr[0])

    curvature = ((left_curverad + right_curverad) / 2)
    #print(curvature)
    lane_width = np.absolute(leftx[719] - rightx[719])
    lane_xm_per_pix = 3.7 / lane_width
    veh_pos = (((leftx[719] + rightx[719]) * lane_xm_per_pix) / 2.)
    cen_pos = ((binary_warped.shape[1] * lane_xm_per_pix) / 2.)
    distance_from_center = veh_pos - cen_pos
    return curvature,distance_from_center
I did this in lines # through # in my code in my_other_file.py
6. Provide an example image of your result plotted back down onto the road such that the lane area is identified clearly.
1. Provide a link to your final video output. Your pipeline should perform reasonably well on the entire project video (wobbly lines are ok but no catastrophic failures that would cause the car to drive off the road!).
Here's a link to my video result
1. Briefly discuss any problems / issues you faced in your implementation of this project. Where will your pipeline likely fail? What could you do to make it more robust?
While use the pipeline to process the vedio it may sometime loose track of the line lane, so I define a line class to keep track of the last polynomial coefficients, the 10 most recent polynomial coefficients and the best polynomial coefficients which is average of 10 most recent polynomial coefficients so I can decide if it lose track of lane or not:
# Define a class to receive the characteristics of each line detection
class Line():
    def __init__(self):
        # was the line detected in the last iteration?
        self.detected = False
        # x values of the last n fits of the line
        self.recent_fitted = [np.array([False])]
        #average x values of the fitted line over the last n iterations
        self.bestx = None
        #polynomial coefficients averaged over the last n iterations
        self.best_fit = None
        #polynomial coefficients for the most recent fit
        self.current_fit = [np.array([False])]
        #radius of curvature of the line in some units
        self.radius_of_curvature = None
        #distance in meters of vehicle center from the line
        self.line_base_pos = None
        #difference in fit coefficients between last and new fits
        self.diffs = np.array([0,0,0], dtype='float')
        #x values for detected line pixels
        self.allx = None
        #y values for detected line pixels
        self.ally = None

    def check_detected(self):
        if (self.diffs[0] < 0.01 and self.diffs[1] < 10.0 and self.diffs[2] < 1000.) and len(self.recent_fitted) > 0:
            return True
        else:
            return False


    def update(self,fit):
        if fit is not None:
            if self.best_fit is not None:
                self.diffs = abs(fit - self.best_fit)
                if self.check_detected():
                    self.detected =True
                    if len(self.recent_fitted)>10:
                        self.recent_fitted = self.recent_fitted[1:]
                        self.recent_fitted.append(fit)
                    else:
                        self.recent_fitted.append(fit)
                    self.best_fit = np.average(self.recent_fitted, axis=0)
                    self.current_fit = fit
                else:
                    self.detected = False
            else:
                self.best_fit = fit
                self.current_fit = fit
                self.detected=True
                self.recent_fitted.append(fit)
My current pipeline are very likely fail to detecte the lane in night, where light condition are very different. Using more color channals or other color spaces, and cobined all this, may solve this problem, but it remain to be see.


