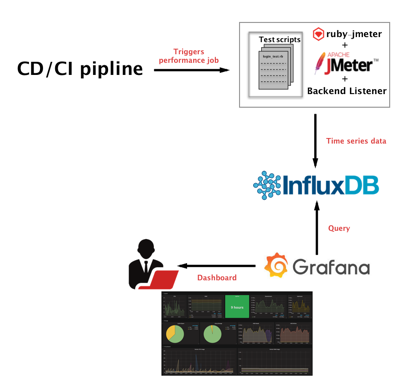
This repo executes the performance tests using jmeter in non gui mode pushes data to Influx DB. Which can be viewed through Grafana dashboard.
Before running test, run following commands from command line (make sure you are in your project root directory ):
- Ruby
    $ brew update
    $ brew install rbenv
    $ brew install ruby-build
    $ rbenv install (this will install jruby version mentioned in your .ruby-version file)
$ bundle install (this will install all necessary gems mentioned in your Gemfile)- Influx DB
$ brew install influxdb- Grafana
$ brew install grafana- Jmeter
$ brew install jmeter- Make sure Influxdb is up and listening to the port 8086 and host and port details are updated in script file
    $ influxd -config /usr/local/etc/influxdb.conf
    $ source setup.sh (this will export all necessary env and change your USER_NAME,
USER_PASSWORD, SITE_URL and jmeter influxdb configuaration.- To executae single tests in the scenario folder
$ rake performance:test[load_admin_page.json]- To execute all the tests in folder
$ rake performance:test_all- Run the grafana server locally
$ brew services start grafana (visit localhost:3000 to view the dashboard)