██╗██████╗ ██████╗ ███████╗███╗   ███╗
██║██╔══██╗██╔══██╗██╔════╝████╗ ████║
██║██║  ██║██████╔╝█████╗  ██╔████╔██║
██║██║  ██║██╔══██╗██╔══╝  ██║╚██╔╝██║
██║██████╔╝██║  ██║███████╗██║ ╚═╝ ██║
╚═╝╚═════╝ ╚═╝  ╚═╝╚══════╝╚═╝     ╚═╝
Note: For iDREM interactive visualization manual, please skip to INTERACTIVE-VISUALIZATION section.
The Dynamic Regulatory Events Miner (DREM) software was initially developed to integrate static protein-DNA interaction data with time series gene expression data for reconstructing dynamic regulatory networks. In recent years, several additional types of high-throughput time series data have been used to study biological processes including time series miRNA expression, proteomics, epigenomics and single cell RNA-Seq. Integrating all available time series and static datasets in a unified model remains an important challenge and goal. To address this goal, and to enable interactive queries of the resulting learned models we have developed a new version of DREM termed interactive DREM (iDREM). iDREM provides support for all data types mentioned above and more. Importantly, it also allows users to interactively visualize a gene, TF, path or model-centric view of each of these data types, their interactions and their impact on the resulting model. We showcase the functionality of the new tool by applying it to integrate several data types from multiple labs for modeling brain development regulatory networks. The following figures presents the flowchart.

-
Java
To use iDREM, a version of Java 1.7 or later must be installed. If Java 1.7 or later is not currently installed, please refer to http://www.java.com for installation instructions. -
JavaScript
To enable the interactive visualization powered by Javascript, please make sure that you have Internet connection.
(The users are still able to run the software off-line, but Internet access is needed to view the result interactively.)
To download iDREM, simply download and extract iDREM package.
Please use the iDREM jar package (idrem.jar) inside the unzipped directory together with the depending libraries and data files (TF targets and miRNA targets).
If users want to use the jar package outside the directory, please
add the iDREM directory to $PATH.
Please refer https://www.java.com/en/download/help/path.xml for instructions to set up system environment variable.
To execute iDREM from a command line, change to the iDREM directory and then type:
java -Xmx8g -jar idrem.jarThe output results will be given under the same directory of the input "Expression Data File".
For large datasets, it's recommended to use 8G RAM (-Xmx8g) while 4G RAM (-Xmx4g) should be enough for most cases.
iDREM input interface(required, users need to specify to run iDREM)

-
1. Data Input
-
TF-gene Interaction source:
Users can choose from default TF-gene interactions database we collected. -
TF-gene Interaction File:
Users need to provide the customized TF-gene interaction File if choose User Provided TF-gene Interaction source. It must follow the following formatting requirements:
1st row: header, it should be "TF Gene Input" (tab-delimited).
remaining rows: 1st col is TF, 2nd col is Gene, 3nd col is interaction between TF-Gene (1/0 binary or a score)
example input:
TF Gene Input CD40 ANPEP 1 NKX2-1 ALS2CL 1 NFKB1 ALS2CL 1- Expression Data File:
This species the mRNA expression file. Please choose right normalization method.
If the expression is already in log-space, please choose "normalize data".
If the expression is not in log-space, please choose "log normalize data".
Both "normalize data" and "log normalized data" are using the expression at the first time point as the anchor to study the expression changes through the time. This is recommended. However, if you prefer to use 0 expression as the anchor to study the expression changes, please choose "No normalization/add 0". Please note this requires that the expression must be in log space.
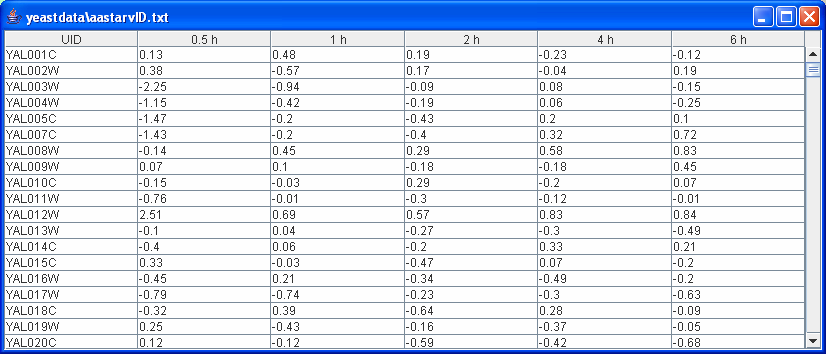
The expression data must follow the formatting requirments:
header row (1st row): 1st column- Gene , remaining columns- time point IDs.
data rows (2nd -last row): 1st column-Gene Symbol, remaining columns- expression values at each time point.
Example input:
 If users have repeats for expression data, there are two ways to use them:
First, users pre-process the repeats. For each gene, take the median expression over all repeats. This requires that all repeats cover the same time points. Then use the processed expression as the input expression data.
Second, let iDREM process the repeats data, simply upload the repeats using "Repeat Data" button.
The repeats file should be in the same format as the expression data. By default, the repeat data should cover the same time points as the original expression data ('The same time period' checkbox). However, if the repeat time covers different period, some information from the repeats can still be used. Please refer the "manual" for details.
-
-
2. Gene Annotation Input
-
Gene Annotation Source
iDREM provides Gene Ontology (GO) annotation files for most well-studied organisms. For complete list of provided GO annotation files, please refer to the iDREM manual. -
Gene Annotation File
This file contains the Gene Ontology (GO) annotations of genes. The file can be in one of two formats:
The file can be in the official 15 column GO Annotation format described at http://www.geneontology.org/GO.annotation.shtml#file. Users can download the annotation file (if not in the provided list) from Gene Ontology Consortium website(http://www.geneontology.org/)
Alternatively the file can have two columns where the first column contains gene symbols or spot IDs and the second column contains annotations of the genes in the first column. The two columns are delimited by a tab. Gene symbols and GO annotations can be delimited by either a semicolon (;), comma (','), or a pipe (|).
Note:
*If a gene is listed as belonging to a certain GO category that is a sub-category of other categories in the GO hierarchy, it is not necessary to also explicitly list its super-categories. *If the same gene appears on multiple lines the union of annotation terms is taken. *The file can either be in plain text or a gzipped version of a plain text file in the required format.
Sample file of two column format:
ZFX GO:0003677;GO:0003713;GO:0008270;GO:0030528;GO:0046872;GO:0006355;GO:0005634 ZNF133 GO:0003700;GO:0008270;GO:0006355;GO:0005634 USP2 GO:0004197;GO:0004221;GO:0016787;GO:0006511-
Cross Reference Source
Users can choose from "User provided" and "NO cross reference". If "User provided" selected, please specify "Cross Reference File" field. Note that leaving the cross-reference field blank under 'User Provided' is equivalent to selecting 'No cross references'. -
Cross Reference File
A cross reference file specifies that two or more symbols for the same gene are equivalent. This file is optional, but is useful in the case where annotation of genes in the annotation file use a different naming convention than the genes in the data file, and thus with a cross reference file it is possible to match a gene in the data file with its annotation in the annotation file even when the symbol used in the data file does not appear in the annotation file. Note that the cross reference file is only used to map between gene symbol. Any symbols on the same line are considered to be equivalent where symbols are delimited by tabs, a pipe(|), a comma (',') or a semicolon (;). The file can either be in plain text or gzipped version of a text file in this format.
Sample cross reference file:
GeneA SymbolA GeneB SymbolB GeneC SymbolC -
-
3. Options (Optional, iDREM can run without specifying options)
The options can be used to provide optional data sets or search setting for model prediction.-
model searching options
The model searching options include "Gene Annotations", "GO Analysis", "DECOD Options", "Expression Scaling Options", "Filtering Options", "Search Options" and "Model Selection Options". Note users can use the default parameters provided (no need to specify those options). Please refer to the manual for detailed description of those options if users want to change the model searching parameters. -
datasets options
There are 3 additional datasets options including "microRNA Option", "Epigenomics Option" and "Proteomics Option". This optional datasets can provide additional regulatory information, which is helpful for iDREM model prediction.-
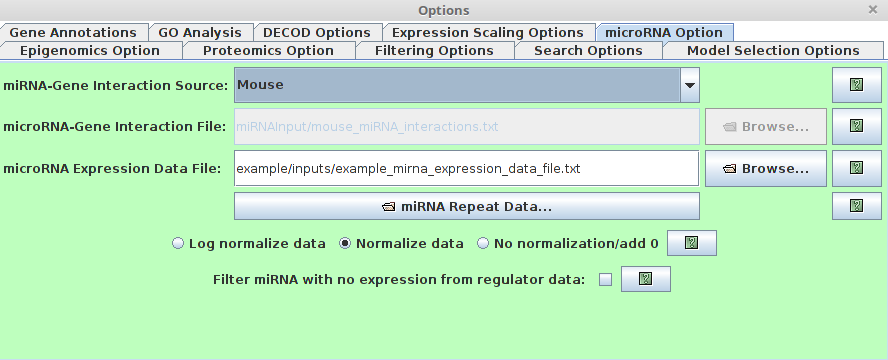
microRNA Option
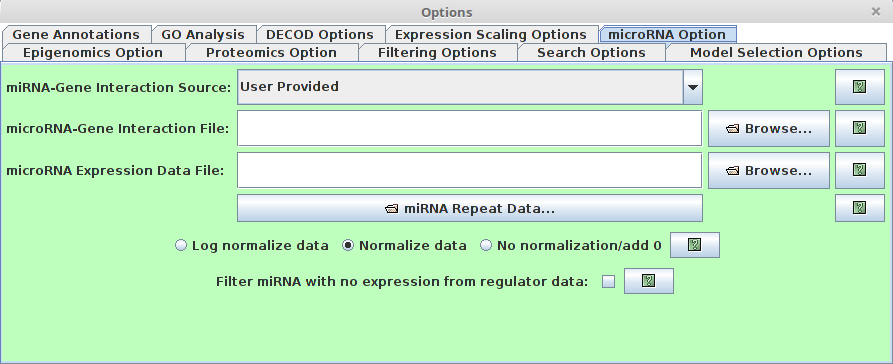 Users are able to specify the miRNA information (It’s optional.
If the miRNA information is available, if will help to predict the regulatory model). There are several
major fields for this option dialog.
Users are able to specify the miRNA information (It’s optional.
If the miRNA information is available, if will help to predict the regulatory model). There are several
major fields for this option dialog.-
microRNA-gene Interaction Source
This specifies the miRNA-gene interaction. By default, we provided the miRNA-gene interaction predicted by miRanda for Human, Rat, Mouse, Fruitfly and Mematode. -
microRNA-gene Interaction File
Users are also able to use customized miRNA-gene interaction files. The miRNA-gene interaction must follow the following format requirement. 1st column: miRNA ID 2nd column: gene symbol 3rd column: regulation (It can be binary 1/0 or a float binding score in range [0,1]) The columns are tab-delimited. example file:
MIRNA GENE INPUT dme-miR-1 CG18769 1 dme-miR-1 CG11710 1 dme-miR-1 CG5522 1 dme-miR-1 apt 1 dme-miR-1 CG3338 1 dme-miR-1 LIMK1 1- microRNA Expression Data File
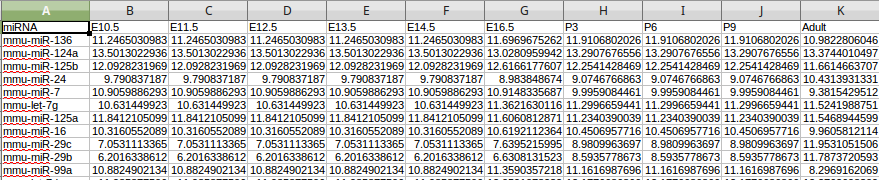
This field specifies the microRNA expression data file. The microRNA expression must follow the following format requirement. 1st row: 1st column ”miRNA”, the remaining columns in the first row are ID for time points.
remaining rows: 1st column represents miRNA ID, the remaining columns represent miRNA expression values.
All columns are tab-delimited.
example file:
The description of normalization methods and repeats is the same as the gene expression data in the "Data Input".
-
-
Epigenomics Option
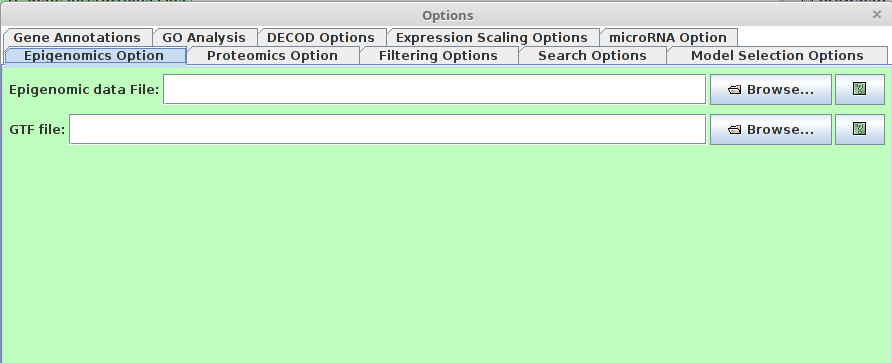 Note that this option can take different types of epigenomic data (e.g. DNA methylation, histone modification)
- Epigenomic data File
This File specifies the Epigenomic data such as DNA methylation, histone methylation, etc. Here the epigenomic score is used to denote the repression of the region. Therefore, different types of Epigenomic data need to be pre-processed differently.
For example, if the epigenomic data is DNA methylation, the normalized methylation score [0-1] can be used directly as the input. If the epigenomic data is histone modification, e.g H3K4me2, which is asssociated with activiation,then the input should be (1-normalized histone modification score). In short, the epigenomic data here should represent 'difficulty' score of TF-binding. The larger score, the smaller probablity of TF binding.
The epigenomic input should be in BED6 format.
This file has the following BED6 formatting requirements:
1st column: chrom
2nd column: ChromStart
3rd column: ChromEnd
4th column: Name with time point information. It should be in the format of TimePoint_Gene
5th column: Epigenomic score
6th column: strand
All columns are tab delimited.
Sample File:
chr7 28372162 28373662 p0.5_Plekhg2 0.21 - chr12 76532560 76534060 p0.5_Plekhg3 0.25 + chr10 3739377 3740877 p0.5_Plekhg1 0.56 + chr6 125380004 125381504 p0.5_Plekhg6 0.41- GTF File
This is the GTF file associated with given organisms. The gene annotation will be obtained from the given GTF file. For GTF format, plese refers to : http://www.ensembl.org/info/website/upload/gff.html.
- Epigenomic data File
-
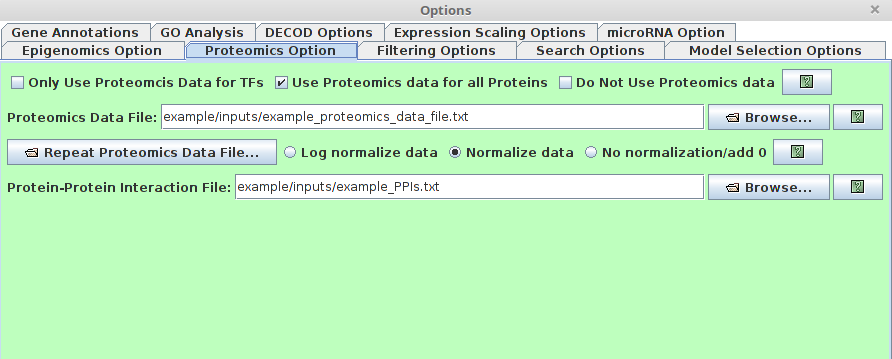
Proteomics Option
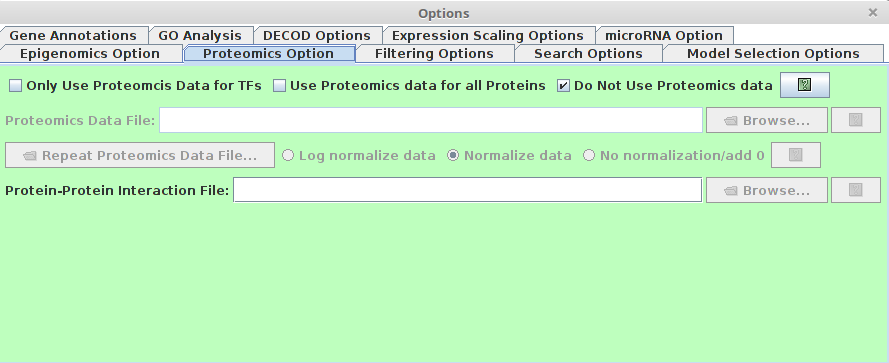 Users are able to specify the protein level information using this option, which is helpful for model prediction.
There are several major fields in this option dialog.
Users are able to specify the protein level information using this option, which is helpful for model prediction.
There are several major fields in this option dialog.-
Proteomics checkbox
- Only Use Proteomics Data for TFs : If checked, only protein level for TFs will be considered.
- Use Proteomics data for all proteins (recommended) : If checked, all protein level will be used. The "Activity" measurement of TFs is made not not just by the protein level of the TF, but also also the protein level of all potential interacting proteins, which is much more robust to the noise of the protein level.
- Do not Use Proteomics data: If checked, the proteomics panel will be disabled and no proteomics data will be used.
-
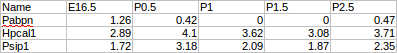
Proteomics Data File
This entry specifies a file that contains the time-series proteomics data. A data file includes gene symbols, data values. This file has the following formatting requirements:
The first row specifies the time points.
For every row after the first, 1st Columns tells the gene name, the following columns tell the corresponding protein level of the gene at each time point.
The "Repeat Proteomics Data File" and normalization have the same meaning as the described in "microRNA option" section.
- Protein-Protein Interaction File (PPI)
This entry specifies the Protein-protein interaction file.
Such data can be downloaded from PPI databases such as STRING or BioGRID. This file has the following formatting requirements:
First ,Second Columns present the interacting protein pairs (Using gene names). The first column tells the interaction strength. If such information is not avaiable, use 1 instead.
All columns are tab-delimited.
Sample file:
Gnai3 Adora3 0.813 Gnai3 Grm6 0.902 Gnai3 Bdkrb2 0.904 Gnai3 Akt1 0.717 Gnai3 Adcy4 0.966 Gnai3 Rgs19 0.987 Gnai3 Hck 0.889 -
-
iDREM can be run in batch mode to learn models without going through the graphical interface. Batch mode is useful for learning multiple iDREM model in parallel or interacting iDREM with external scripts. In batch mode, the DREM settings are read from the file "settingsfile.txt", which has the same format as the "default_config" file, and the model file "outmodelfile.txt" is automatically saved after the learning precedure terminates. The saved model file can then be loaded into iDREM for later viewing. To run iDREM in batch model, use the command:
java -Xmx8g -jar idrem.jar -b settingsfile.txt outmodelfile.xt
All the files and parameters described above are specified by the settingsfile.txt in batch mode. Please refer to the example_settings.txt provided for the required format of the iDREM setting file.
-
-
4. Execute
Click to Execute iDREM.


iDREM provides an interactive visualization of the predicted model besides the iDREM direct output (please refer to manual for details of iDREM direct ouput).

Please note that some popup windows might be blocked by the browser. Please pay attention to the top right of the browser. If blocked, please allow the pop-up window by clicking it and choosing the right option.
The interactive visualization is composed of the following sections:
-
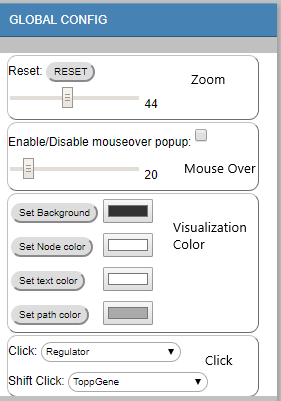
Global Config
-
Zoom sub-panel
- RESET
Rest all configurations. - Zoom Slider
Use the slider to zoom in/out the model visualization on the right.
- RESET
-
Mouse Over sub-panel
- Enable/Disable mouseover popup checkbox
If checked, show regulating factors when mouse over a node in the model visualization on the right. - Regulator cutoff slider
This slider is used to control how many regulators will be shown when mouse over a node. By default, it is set as 20, which means that 20 regulators at most will be shown in the mouse over popup window. Users are able to choose # of top regulators (10-100) to display on the mouseover popup window.
- Enable/Disable mouseover popup checkbox
-
Visualization color sub-panel
- Set background
Change/Set the background color in the model visualization on the right. - Set Node color
Change/set the node color in the model visualization on the right. - Set text color
Change/set the text color in the model visualization on the right. - Set path color
Change/set the path color in the model visualization on the right.
- Set background
-
Click sub-panel
- Click
Functions bound to left Click:-
Regulator
show Top TFs for the clicked node (regulating the edge ending at the node). The number of shown TFs is controlled by the regulator cutoff slider in the mouse over sub-panel.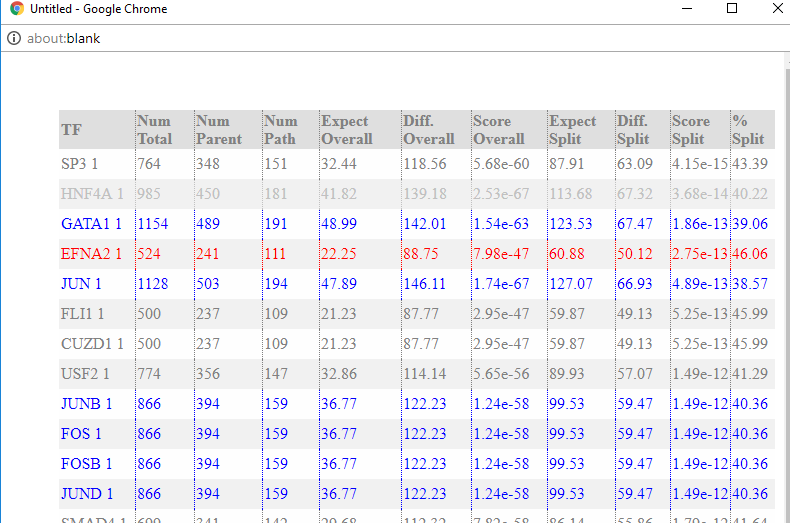
red: down-regulated regulators.
blue: up-regulated regulators.
gray: non-expressed regulators or filtered regulators (zero or near-zero expression variance across all time points). -
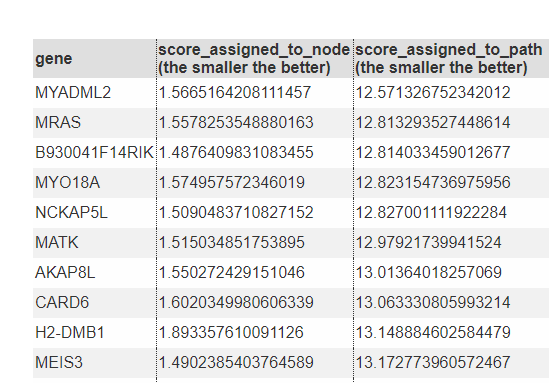
Genes Assigned To The Node
show the gene list assigned to the node/path. (The genes in the path are the same as the genes in the leaf node of the path.)
-
Average Methylation For Genes In Node
show the average methylation score for all genes in the clicked node. Please note "methylation" score is only representing the "repression" score here. It's not necessarily the DNA methylation score. It could be other epigenomic information which iDREM can take as the input. For example, if using H3K4me2 histone modification as the epigenomic input (Methylation option), the methylation score here actually is the opposite of the H3K4me2 histone modification score (1-H3K4me2 score) as H3K4me2 is generally associated with "Activation", which is the opposite of the default "repression" associated methylation score used in the visualization. To understand the meaning of the methylation score correctly, please pay attention to the type of the epigenomic data used in the study. -
Average Methylation For All Top Regulator Targets
show the average methylation score for the target genes of the top TFs associated to the clicked node. The cutoff for top TFs is set by the regulator cutoff slider in the mouse over sub-panel. -
Average Methylation For Top Regulator Targets In Node show the average methylation score for the target genes of the top TFs associated to the clicked node, the target genes must be also in the clicked node.
-
Compare Regulator
Compare predicted regulators (TFs and miRNAs) under different models (using Methylation/Proteomics vs Proteomics only vs none) -
Single Cells
show the overlapping comparison between the clicked node and all cell types from the single cell dataset. -
Sorted Cells
show the overlapping comparison between the clicked node and all cell types from the sorted cell dataset.
-
- Shift Click
Functions bound to shift+Click:- ToppGene
functional analysis using Toppgene. - PANTHER
functional analysis using PANTHER.
- ToppGene
- Click
-
-
Regulator Panel
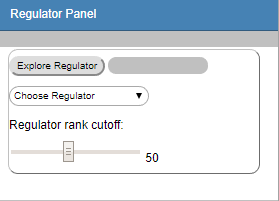
- Explore Regulator
Type in Regulator Name (TF/miRNA) to search the regulating paths/Edges (Marked in Blue). - Choose Regulator Dropdown
Choose the regulator from the dropdown menu to search the regulating paths/Edges (Marked in Blue). - Regulator rank cutoff
The ranking (from 10-100) cutoff used to determine whether the TF/miRNA is regulating the corresponding Edge/node.
- Explore Regulator


To undo the search, delete the text and then press enter; or hit the RESET button.
An example:
search “STAT1” by type in "STAT1" or select "STAT1" from the dropdown menu (under regulator rank cutoff 50):

-
Gene Enrichment Panel
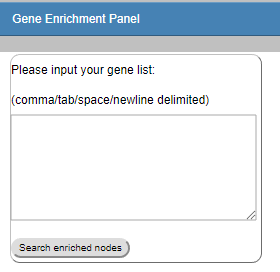
For any given gene list, find the enriched nodes (Nodes whose associated genes are significantly overlapping with the given input gene list). -
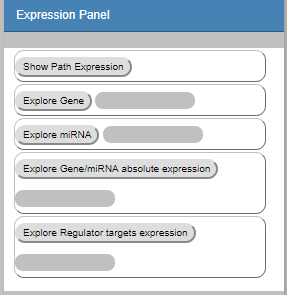
Expression Panel
-
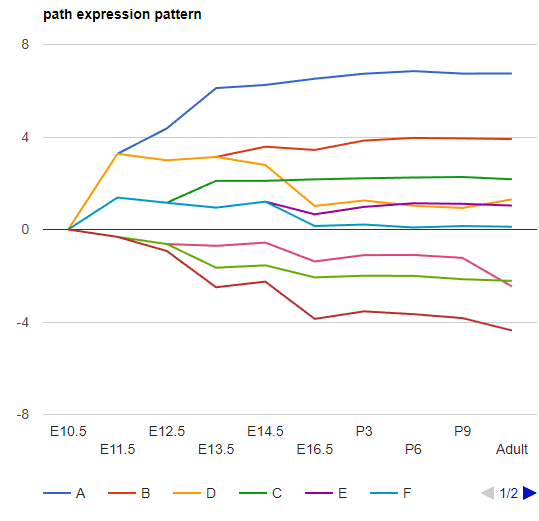
Show Path Expression
The interactive visualization of the model is organized by the split order to avoid overlapping paths. Therefore, the geometric position of the node is not representing the actual expression level. We provided the "Show Path Expression" function to show all the paths based on their expression levels. (x-value : time point, y-value: expression level). Path expression:
-
Explore Gene
Type in Gene Name to show the assigned nodes/paths (Marked in Red). The expression plot (log2 expression relative to time 0) is also provided.
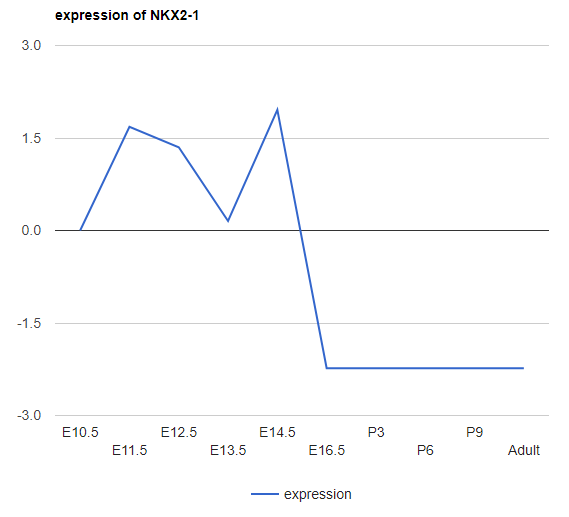
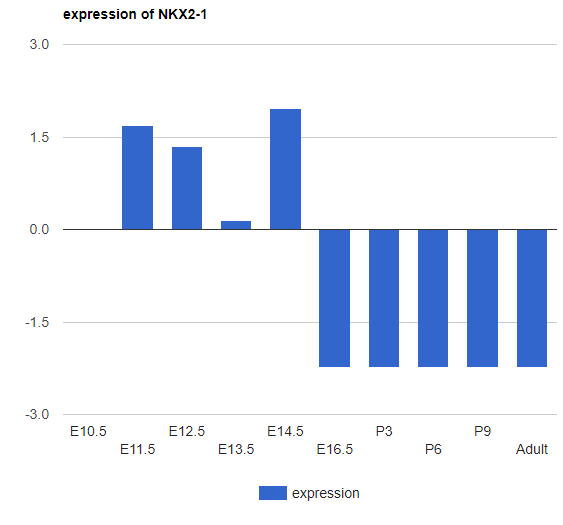
There are 3 different plots for expression (for all expression in the iDREM visualization): LineChart (shown above), ColumnChart and BarChart.
ColumnChart:
 BarChart:
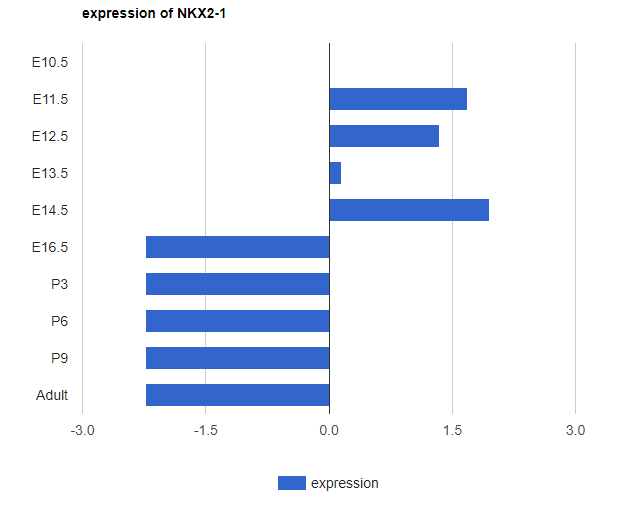
To undo the search: delete the text and then press enter; or hit the RESET button. -
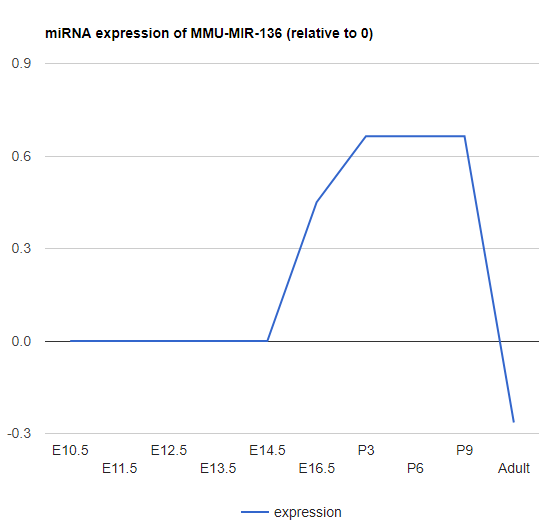
Explore miRNA
Type in miRNA name to show the expression of miRNAs.
-
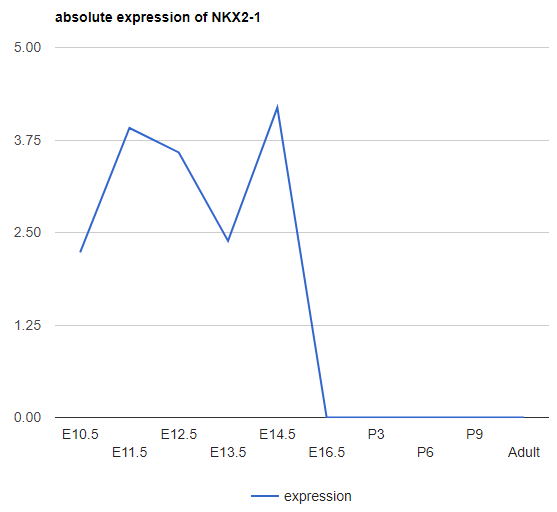
Explore Gene/miRNA absolute expression
The above expression is the relative expression to 0. Those low/zero variance genes were removed from our analysis. To show the expression for those filtered genes, users can use this "Explore gene/miRNA absolute expression". Besides, the expression here is the absolute expression (in log2 space) instead of the relative (to time point 0) expression.
-
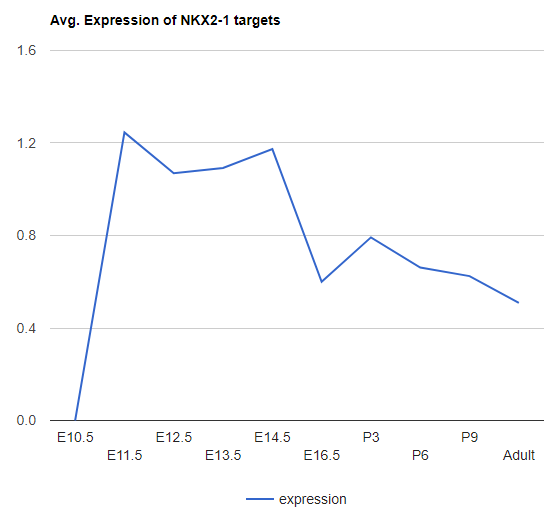
Explore Regulator targets expression
This function is provided to explore the expression of targets of given regulator. Type in the regulator name to search.
-
-
Epigenomic Panel
-
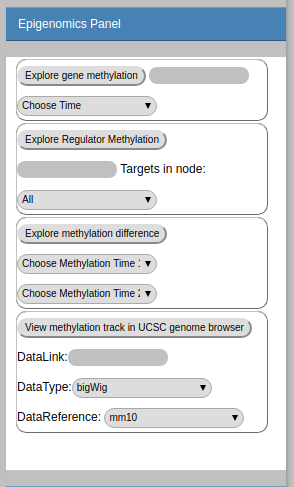
Explore gene methylation
Plot the average methylation scores in the promoter region (-1k->+500bp) of of given gene. Type the gene name or use the dropdown menu to select time points and gene names to explore.
example plot:
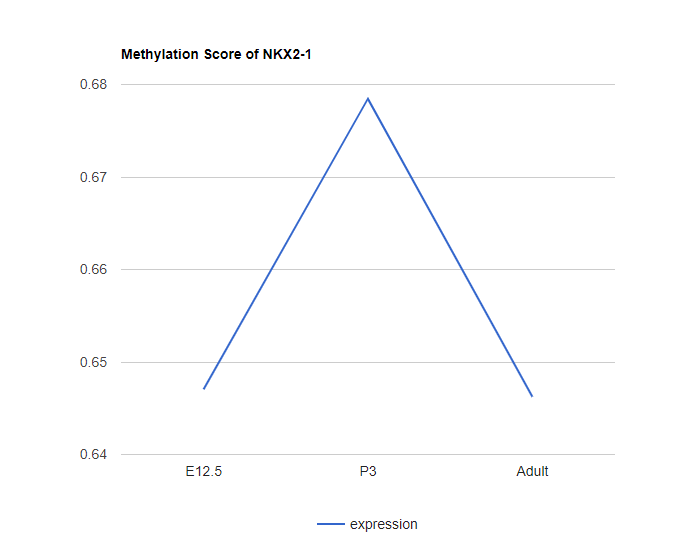
Please note that the methylation score does not necessarily denotes the DNA methylation score. It depends on the type of the genomic data used as the input for iDREM. But all methylation score here denotes the "repression" associated with the promoter region of the given gene. If the epigenomic data is associated with "activation", a pre-processing is needed to transform it to "repression" related (1-normalized activation score). -
Explore Regulator Methylation
Plot the methylation scores for all targets of given TF. (Users can even choose the node they are interested in).
By choosing a specific node, only the targets in that specific node of the given TF will be considered. -
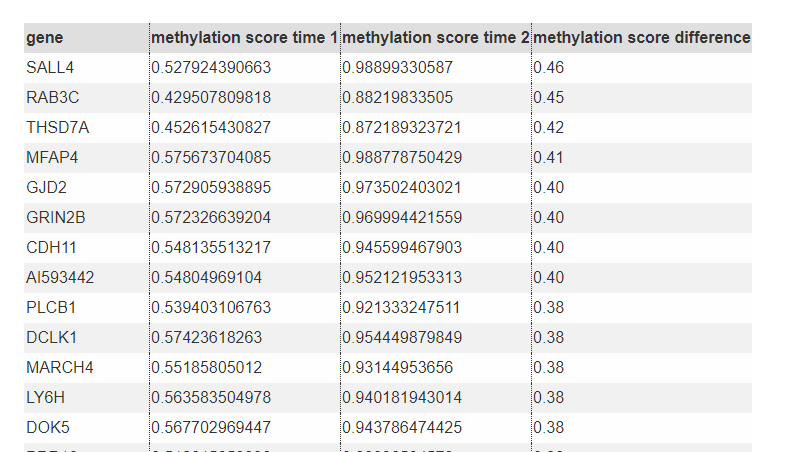
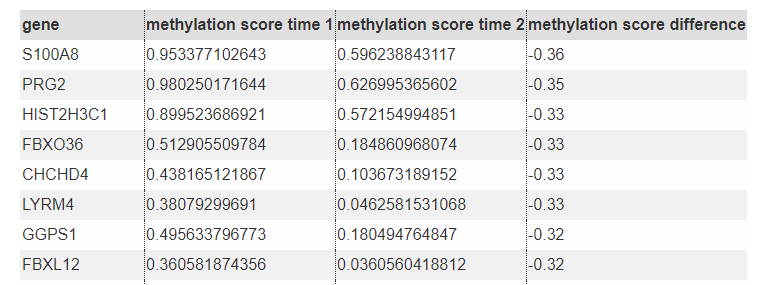
Explore Methylation Difference List all genes (miRNAs) with methylation significantly different in specified two time points.
Top genes with increased methylation in the promoter
Top genes with decreased methylation in the promoter
- View the Methylation Track in UCSC genome browser
As the above analysis is based on the methylation score in promoter region, this might limit the exploration of methylation score in other regions. Therefore, we also provided the visualization of methylation scores (can be any epigeomic scores) using UCSC genome browser. Simply providing the data link for the epigenomic data (in Bam format or bigWig format) and choosing the reference genome accordingly, users are able to explore the epigenomic data in any interested genomic locations using the integrated UCSC genome browser.
-
-
Proteomics Panel
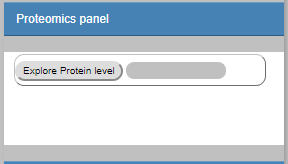
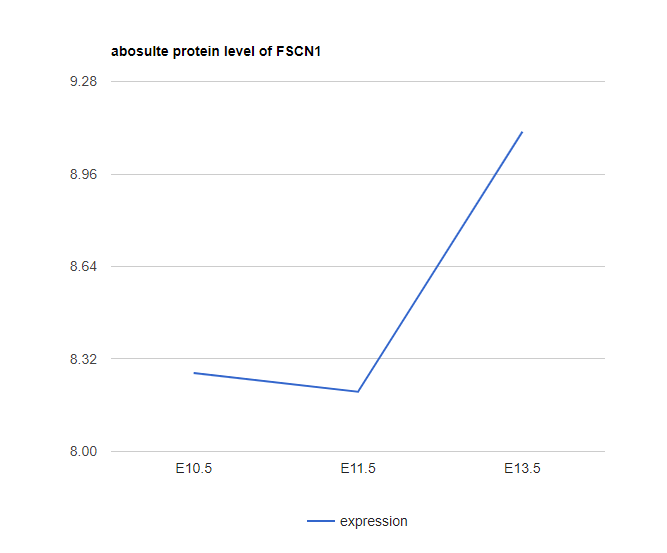
- Explore Protein Level
Type in the protein name (using corresponding gene symbol) to search the corresponding protein level.
- Explore Protein Level
-
Cell Types Panel
-
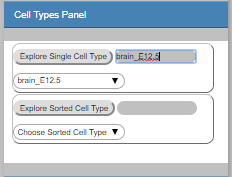
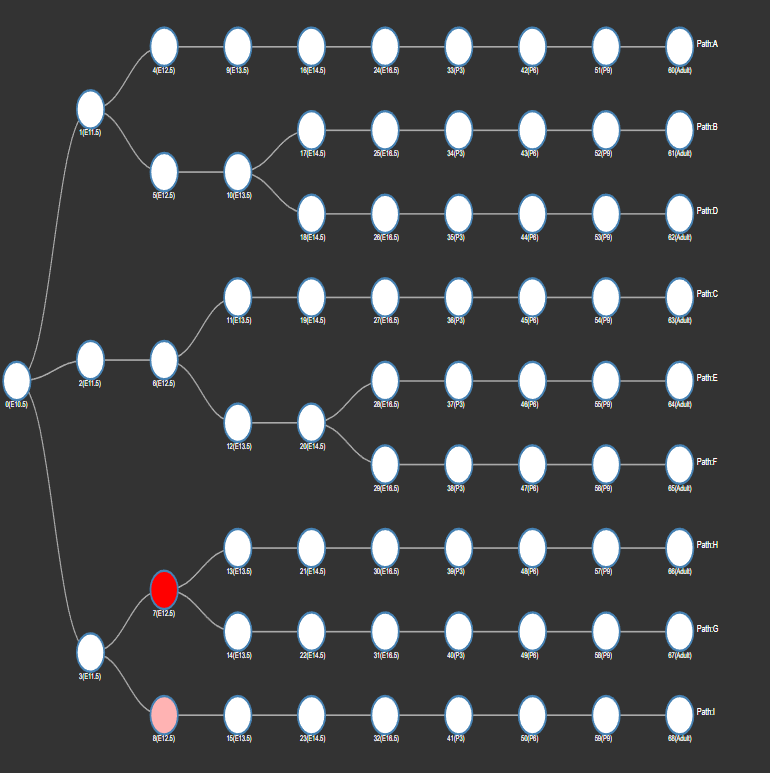
Explore Single Cell Type
highlight all nodes, which are significantly overlapping with signature genes associated to a specific cell type (based on single cell data)
example:
-
Explore Sorted Cell Type
Explore Sorted Cell Type: highlight all nodes, which are significantly overlapping with signature genes associated to a specific cell type (based on sorted cell data) -
__ "Cell Types" data Format (a modified json format)__
- Please note that the "Cell Types" data is not used when predicting the iDREM model and thus it will not be used as the input for iDREM. But it's needed if users want to analyze the correlation between cell types to the predicted nodes and paths in the model.
- The data should be named as "cells.json"
- The data should be in the format of:
data_cells=[SingleCellList, SortedCellList] If don't have the corresponding data, mark it as a empty list [].
For each cell type data (e.g. SingleCellList), iDREM has the following formatting requirements.
SingleCellList=[["TimePoint 1", "CellLabel1", signature gene list delimited by ","], ["TimePoint n", "CellLabeln", signature gene list delimited by ","]]. The following is an example file:
data_cells=[ [['Adult','brain_adult',"Nefh,Nek2,Ggh,Gfm1,Git1,Gja1,Gk5"], ['E10.5','brain_E10.5',"Gfm1,Git1,Gja1,Gk5"] ], [] ] -
-
Path Function Panel
-
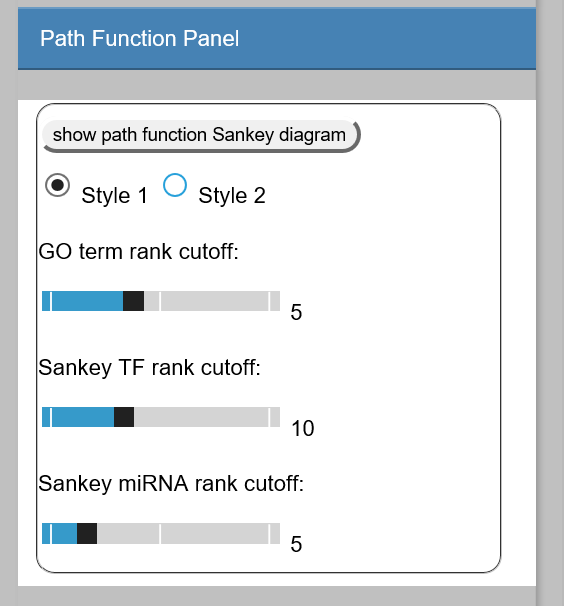
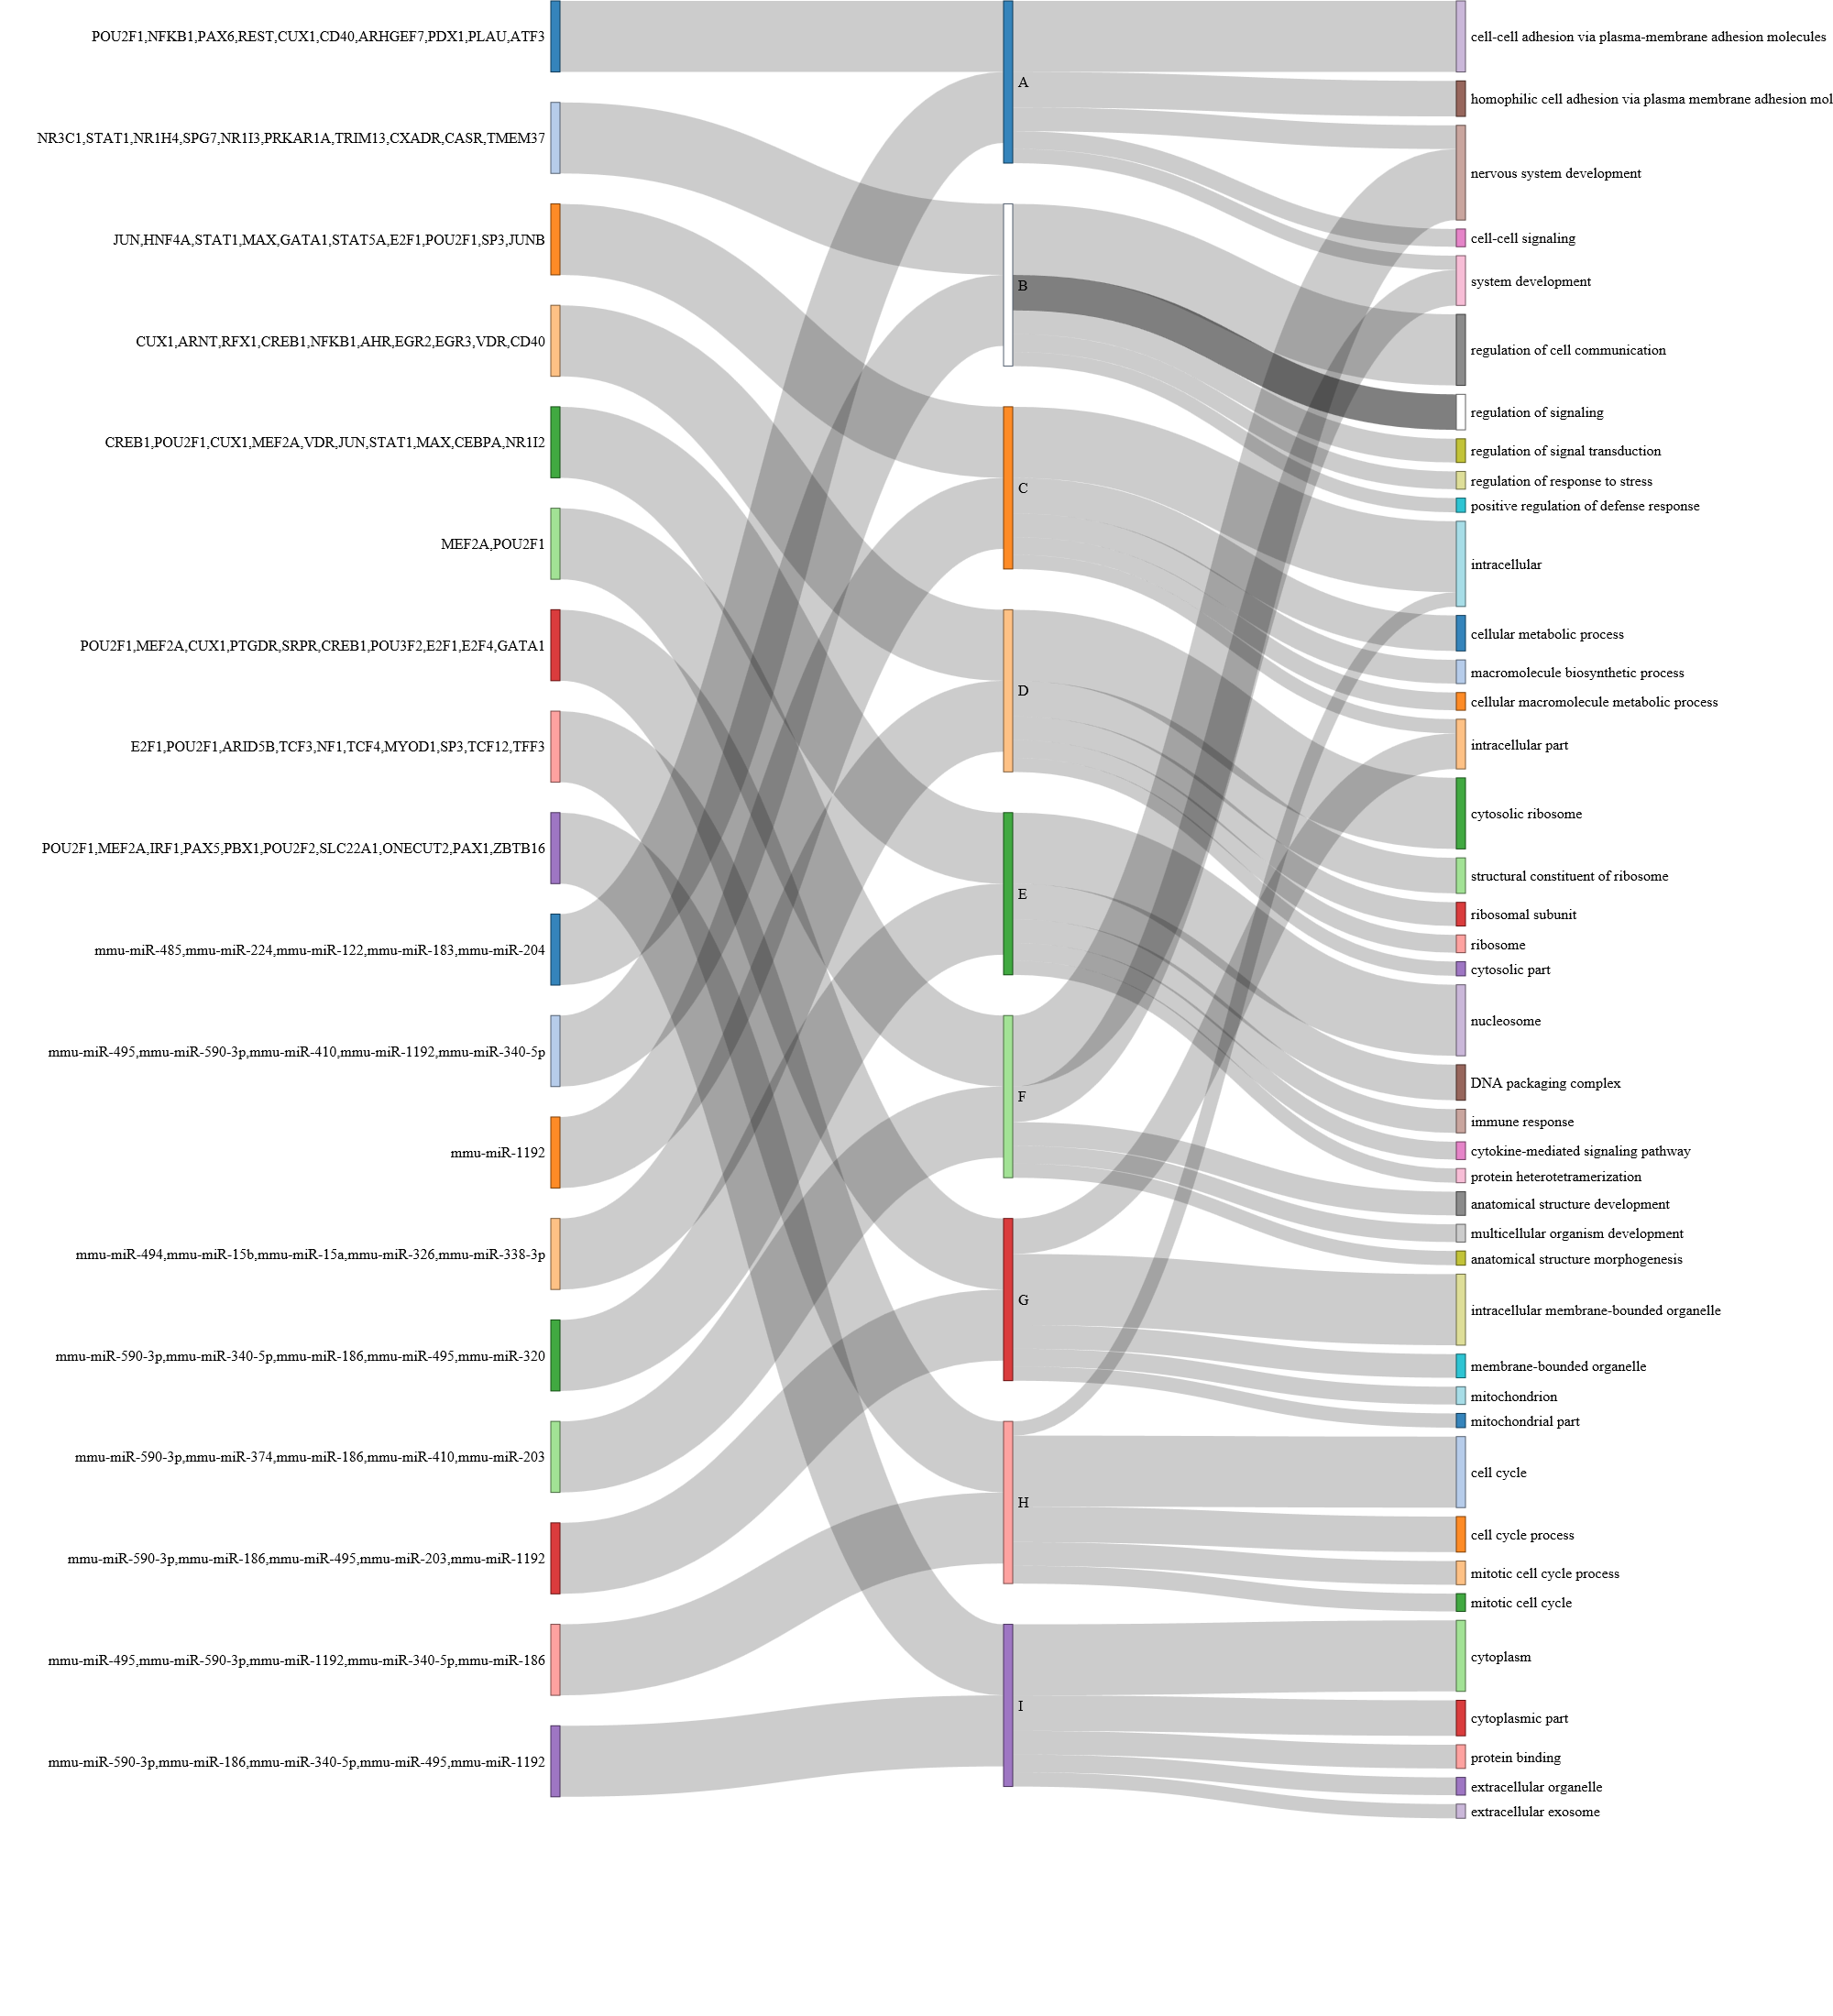
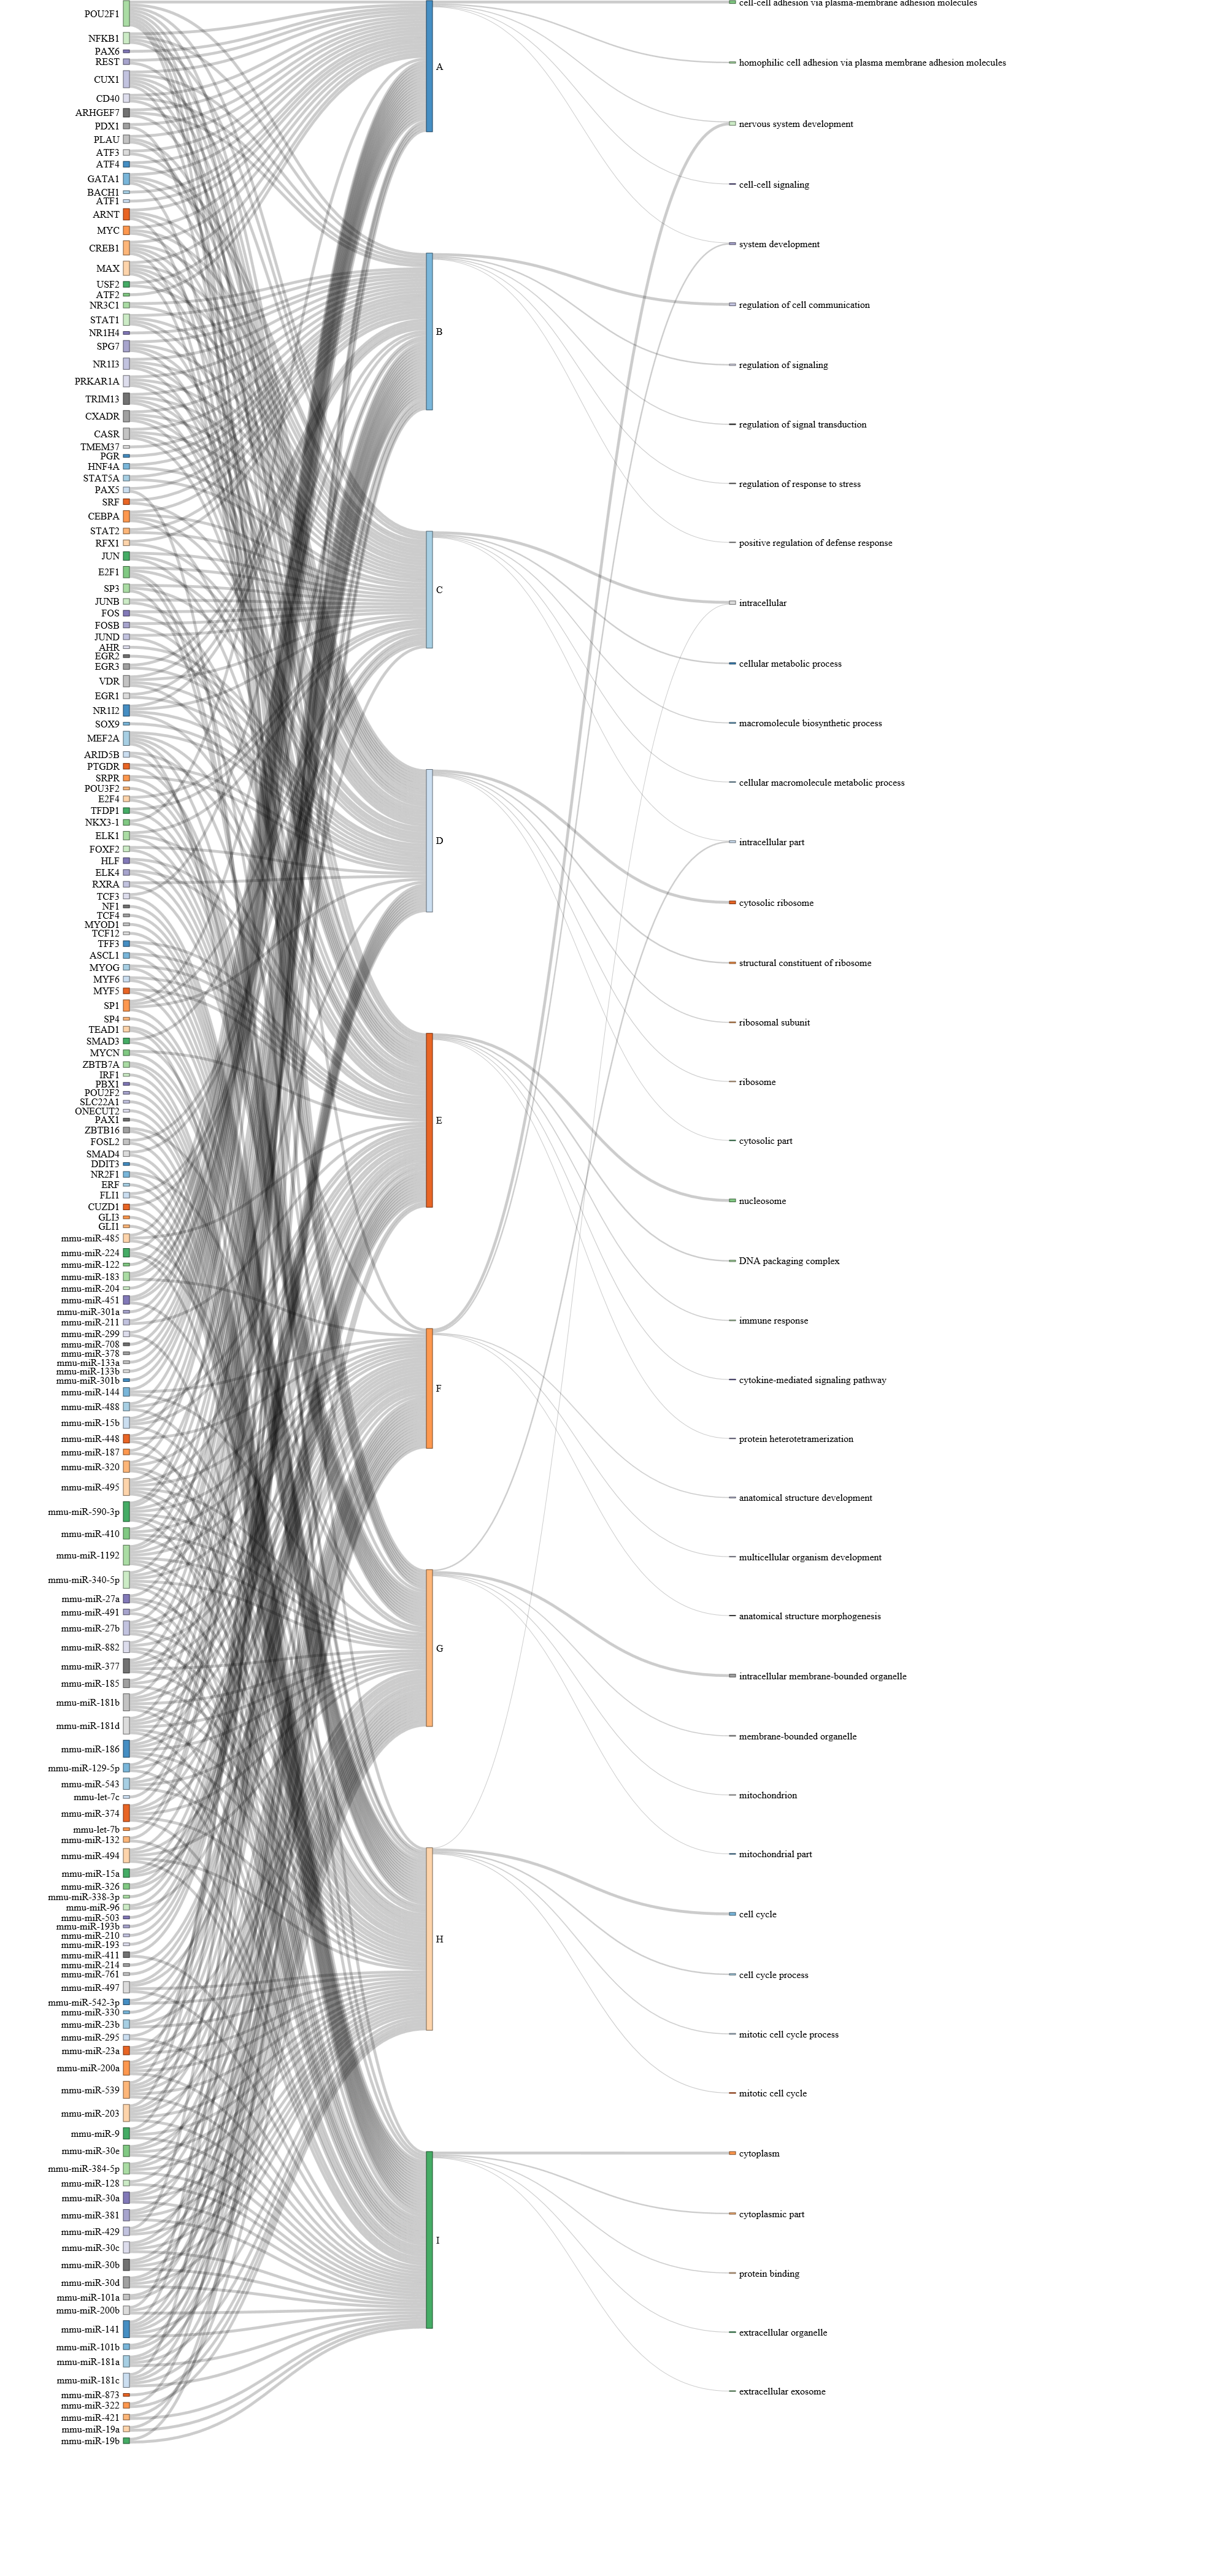
Show path function Sankey Diagram
This plots the Sankey diagram to show the function (GO terms) and regulators (miRNA/TFs) associated to each path.
Users can choose from two styles of Sankey Diagram. example:
style 1:
style 2:
 Clicking the path on the sankey diagram, users will be able to see the details (Go terms names, p-value, regulating miRNAs, TFs, etc.).
 -
Go Term rank cutoff:
This slider sets the GO term rank cutoff for each path. For example, if set as 3, only the top 3 GO terms will be used in the Sankey Diagram.
By default, it set as 5. -
Sankey TF rank cutoff:
The slider sets the TF rank cutoff in the Sankey diagram. -
Sankey miRNA rank cutoff:
This slider sets the miRNA rank cutoff in the Sankey diagram.
-
-
Omnibus Panel
Key in the Gene(Regulator) name to search all related expression and methylation. -
DOWNLOAD Panel
Click the "Generate Json download file" button to download the json file, which describes the model.
With the downloaded json file, users can extract the following information:


- genes associated with each node
- TFs associated with each node
- Mean expression and Standard deviation of the node
The format of the json file:
[
{                //node 1
	ETF: [[TF1 list],[TF2 list],...] // All TFs for the node, please use the rank or the p-value to select the "significant" ones.
	genes: [list of genes assigned to the node]
	id: node_id,
	nodetime: node_time,
	nodeMean: Mean gene expression value of the node,
	nodeSigma: the standard deviation of the gene expression value of the node.
},
{                // node 2
},...
]
All inputs files mentioned in this section can be found under the "example/inputs" directory.
-
run iDREM
Start the iDREM program by the command:
java -Xmx4g -jar idrem.jarThen specify the inputs in the graphical interface as shown below.
-
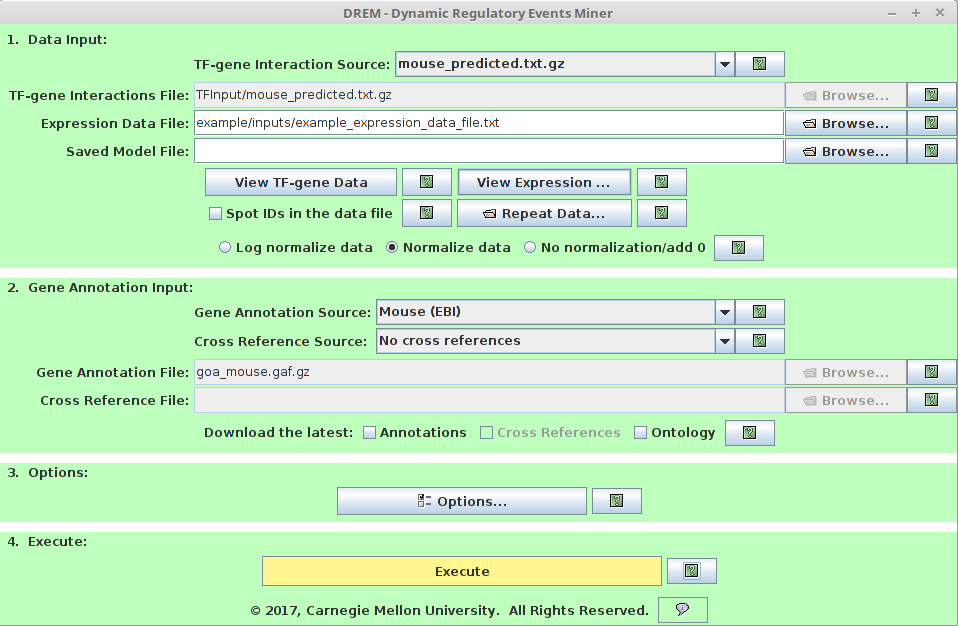
Data Input and Gene Annotation Input
Please specify the example expression inputs as the following figure:
-
Options
-
microRNA Option Please specify the example miRNA option inputs as the following figure:
-
Epigenomics Option
Please specify the example Epigenomics option inputs as the following figure: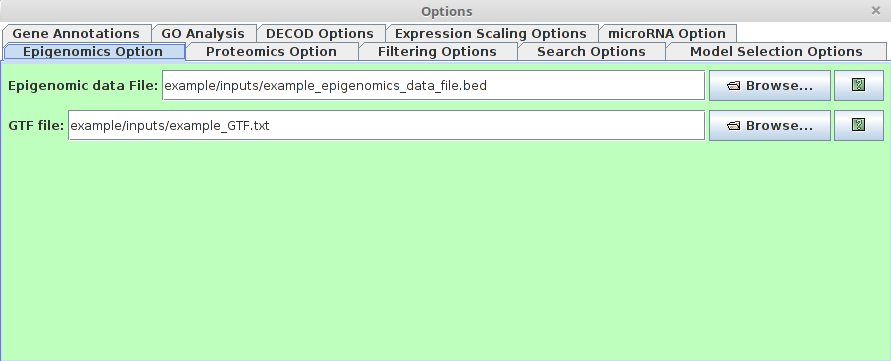
-
Proteomics Option
Please specify the example proteomics option inputs as the following figure:
-
-
Interactive iDREM visualizations
iDREM interactive visualization output:
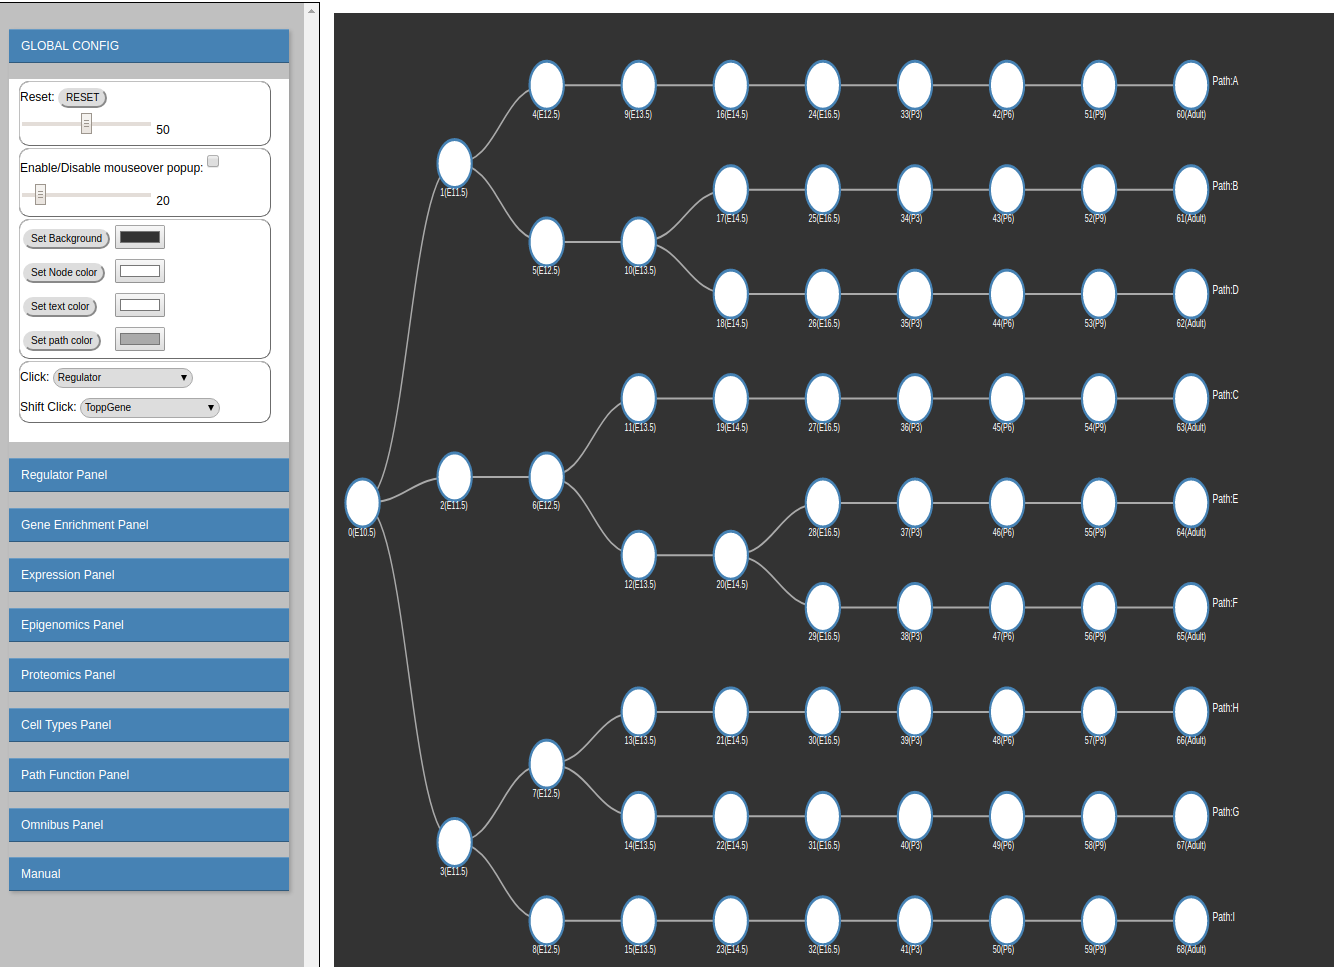
The iDREM visualization results will be given in the same directory as the input "Expression Data File".
-
-
iDREM batch mode
run iDREM in batch mode:java -Xmx4g -jar idrem.jar -b example_settings.txt outmodelfile.xtexample_settings.txt specifies all the files and parameters required by iDREM.
outmodelfile.txt is the saved model, which can be used to restore the running results later. Besides, The output results will be given under the same directory of the input "Expression Data File". Please refer to the manual for more details. -
example analysis of the single cell data
We provided an example for the single cell data analysis in iDREM under the directory example/SingleCellExample. "example/SingleCellExample/singleCellExample.txt" is an example single cell expression data. Using the provided script example/SingleCellExample/parseSC.py, users can get a json file named "cells.json". Copy and place the "cells.json" file under the visualization folder generated by iDREM software, users will be able to use the "Cell type panel" to analyze the single cell/ sorted cell data.


The DREM was developed by Jason Ernst at 2007 and Later extended by MH Schuulz at 2012.
The iDREM was further extended on the base of DREM2 and also the interative Visualization functions were newly added by Jun Ding at 2017.
The DREM software suit was developed by ZIV-System biology group @ Carnegie Mellon University. All rights reserved.
This software is under MIT license.
see the LICENSE.txt file for details.
zivbj at cs.mcu.edu
jund at cs.cmu.edu