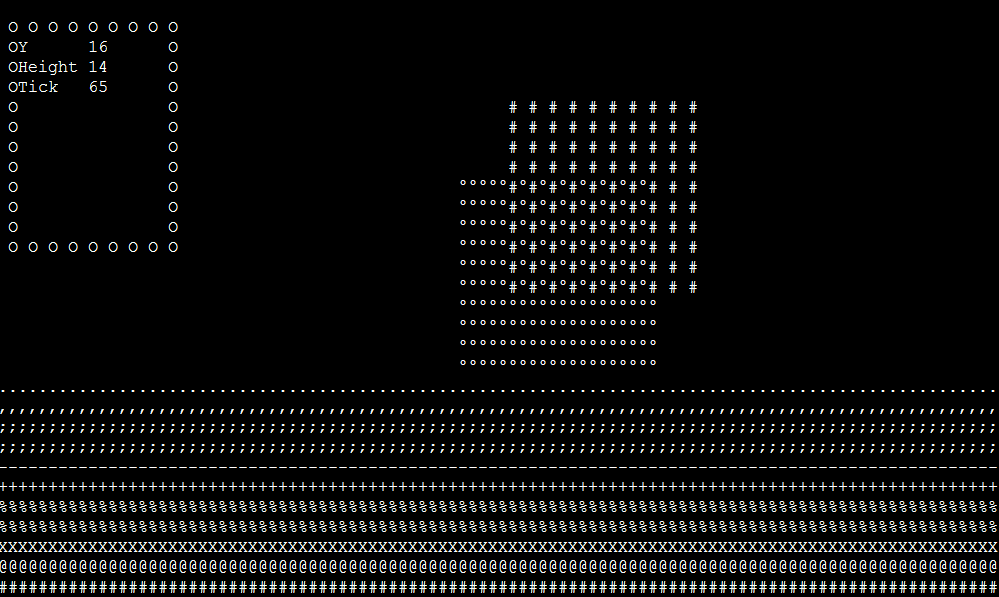
A Python Graphics Library for the Console. Contains several Widgets.
STILL VERY MUCH WORK IN PROGRESS
First import ConsoleGUI and create a CG Object
import ConsoleGUI

cg = ConsoleGUI.CG()
Once you have a CG Object you can customize it or add Widgets.
Widgets get saved in an internal Dict. You can adress specific Widgets
by calling the Dict with the Widgets name.
# Adds a Diagram Widget with the name 'd1'
cg.add_widget('diagram', 'd1', 1, 1, 20, 20, 3)

# Sets the transparency of 'd1' to True
cg.widgets['d1'].set_transparent(True)
For a proper example check out Example.py
-
add_widget(widget_type, name, x, y, width, height, [z])
Adds a Widget with specified type, name, position and scale.
Adding a Widget with an already existing name will overwrite the Widget.
Possible Values for widget_type can be found under Widgets -
remove_widget(name)
Removes the Widget with the specified Name -
get_size()
Returns the size of the Screen in Charater Width and Height as a Tuple -
resize(width, height)
Sets the size of the Screen in Charater Width and Height.
Default: width = 100, height = 30 -
update()
Updates the Screen.
While colored Text is currently not implemented, a brightness value can be simulated by drawing specific characters from a gradient.
Currently there are two types of Gradient, a small and a large one.
Small Gradient:  .:-=+*#%@
Large Gradient:  .'´\",:;Il!i><~+_-?][}{1)(|\\/tfjrxnuvczXYUJCLQ0OZmwqpdbkhao*#MW&8%B@$
To get a Gradient Character for a brightness value between [0, 1], call either gradient_value(p) or gradient_value_small(p) from Color.py.
Widget Types:   - rect
                - text
                - textbox
                - gradient
                - variable
                - diagram
                - bar
                - container
                - table
Widgets with higher z values get draw over widgets with lower z values.
-
set_transparent(transparent)
If a Widget is transparent its empty spaces do not get drawn, revealing the Widgets behind it.
Default: transparent = False
Values: True, False -
get_type()
Returns the Type of the Widget. -
get_name()
Returns the Name of the Widget. -
set_pos(x, y)
Sets the Position of the Widget. -
get_pos()
Returns a tuple of the X, Y and Z of the Widget. -
get_size()
Returns a tuple of the Width and Height of the Widget. -
resize(width, height)
Sets the Scale of a Widget.
Draws a filled Rectangle.
- set_fill(char)
Sets the Character the Rectangle is filled with.
Default: fill_char = '#'
Draws a filled Ellipse
-
set_fill(fill_char, empty_char)
fill_char controls the Character the Ellipse is filled with.
empty_char controls the Character the Background of the Ellipse is filled with.
Default: fill_char = 'O', empty_char = ' ' -
set_scale(scale)
Sets the scale the Ellipse is drawn with.
scale < 1.0: Ellipse is smaller than borders.
scale = 1.0: Ellipse touches borders.
scale > 1.0: Ellipse is bigger than borders.
Default: scale = 1.0
Displays text with simple wrapping.
- set_text(new_text)
Changes the displayed Text.
Displays characters like Text, but with more control over them.
-
set_text(new_text)
Changes the displayed Text, similar to Text. -
set_char(char, x, y)
Sets a single Character in the Textbox. -
add_pattern(pattern, x, y, [transparent])
Imprints the Textbox with a pattern. The Pattern has to be an Array of Strings.
Example:pattern = ['123', '456', '789']
Will be displayed as:123 456 789If transparent is set to True, spaces will not override symbols behind them.
Default: transparent = False -
clear()
Clears the Textbox.
Like Rect, but filled with a Gradient.
- set_direction(new_direction)
Sets the Direction of the Gradient.
Default: direction = 'right'
Values: 'left', 'up', 'right', 'down'
Displays the Name of a Variable with a Value next to it.
-
set_variable(name, value)
Adds a new Variable or sets the value of an existing one.
Values have to be continuosly updated or they will show old values. -
remove_variable(name)
Removes a Variable from the list.
Displays a Diagram. Values get drawn at a specific Y between a specified Range
-
set_draw_axis(visible)
Controls whether the Axis get drawn.
Default: draw_axis = True -
set_fill_bar(visible)
Controls whether the whole bar under the Value gets drawn, or only the Value itself.
Default: fill_bar = False -
set_min_max(new_min, new_max)
Sets the Range in which the Values get drawn.
Default: min = 0, max = 10 -
add_value(value)
Adds a value to the right-most side of the Diagram.
All other values get shifted left. -
set_fill(char)
Sets the Character the Values (and Bars) get drawn with.
Default: fill_char = 'X'
Similar to a loading bar, it displays a value in a range as a bar.
-
set_min_max(new_min, new_max)
Changes the Range in which the value gets interpolated.
Default: min = 0, max = 10 -
set_fill(fill_char, empty_char)
fill_char controls the Character the Bar is filled with.
empty_char controls the Character the Background of the Bar is filled with.
Default: fill_char = '=', empty_char = ' ' -
set_value(value)
Sets the to be displayed Value.
Default: value = 0 -
set_direction(direction)
Sets the direction the Bar fills in.
Default: direction = 'left'
Values: 'left', 'up', 'right', 'down'
A smaller canvas that can contain its own Widgets (and even other Containers!).
Widgets get saved in an internal Dict. You can adress specific Widgets
by calling the Dict with the Widgets name.
The Z Values of Widgets inside the Container only matters to other Widgets inside the Container.
Widgets outside the Container only care about the Containers Z Value.
-
add_widget(widget_type, name, x, y, width, height, [z])
Adds a Widget with specified type, name, position and scale.
Adding a Widget with an already existing name will overwrite the Widget.
Possible Values for widget_type can be found under Widgets. -
remove_widget(name)
Removes the Widget with the specified Name.
Example:
# Creates a Container with the name 'c1'
cg1.add_widget('container', 'c1', 35, 5, 30, 20)

# Creates the Rectangle 'c1_t1' within the Container 'c1'
cg1.widgets['c1'].add_widget('rect', 'c1_t1', 0, 0, 30, 20)

# Changes the Fill Character of the Rectangle
# Notice the Recursive widgets[] Calls
cg1.widgets['c1'].widgets['c1_t1'].set_fill('X')
Similar to a Textbox, a Table is an array of values. The difference is that Tables contain numerical values instead of characters. These values get interpolated between the min and max value of the Table and finally assigned a gradient value.
-
set_min_max(new_min, new_max)
Sets the min and max value of the Table. All Values get interpolated between these. -
set_value(self, value, x, y):
Sets a single Value at a specified Position. -
set_gradient_type(type)
Sets the Gradient Type the Table uses. Check the Chapter Color for more info.
Default: type = 'large'
Values: 'large', 'small' -
add_pattern(pattern, x, y, [transparent])
Imprints the Table with a pattern. The Pattern has to be an Array of Digits.
Example:pattern = [123, 456, 789]
with a min of 0 and a max of 10 will be displayed as:.: -=+ *#%If transparent is set to True, spaces will not override symbols behind them.
Warning! Adding Patterns with a min and max outside of 0-9 could cause unexpected Behavior.Default: transparent = False -
clear()
Clears the Table. Every Value gets set to the min value.