Prometheus-based Kubernetes Resource Recommendations
Installation
.
Usage
·
How it works
.
Slack Integration
Report Bug
·
Request Feature
·
Support
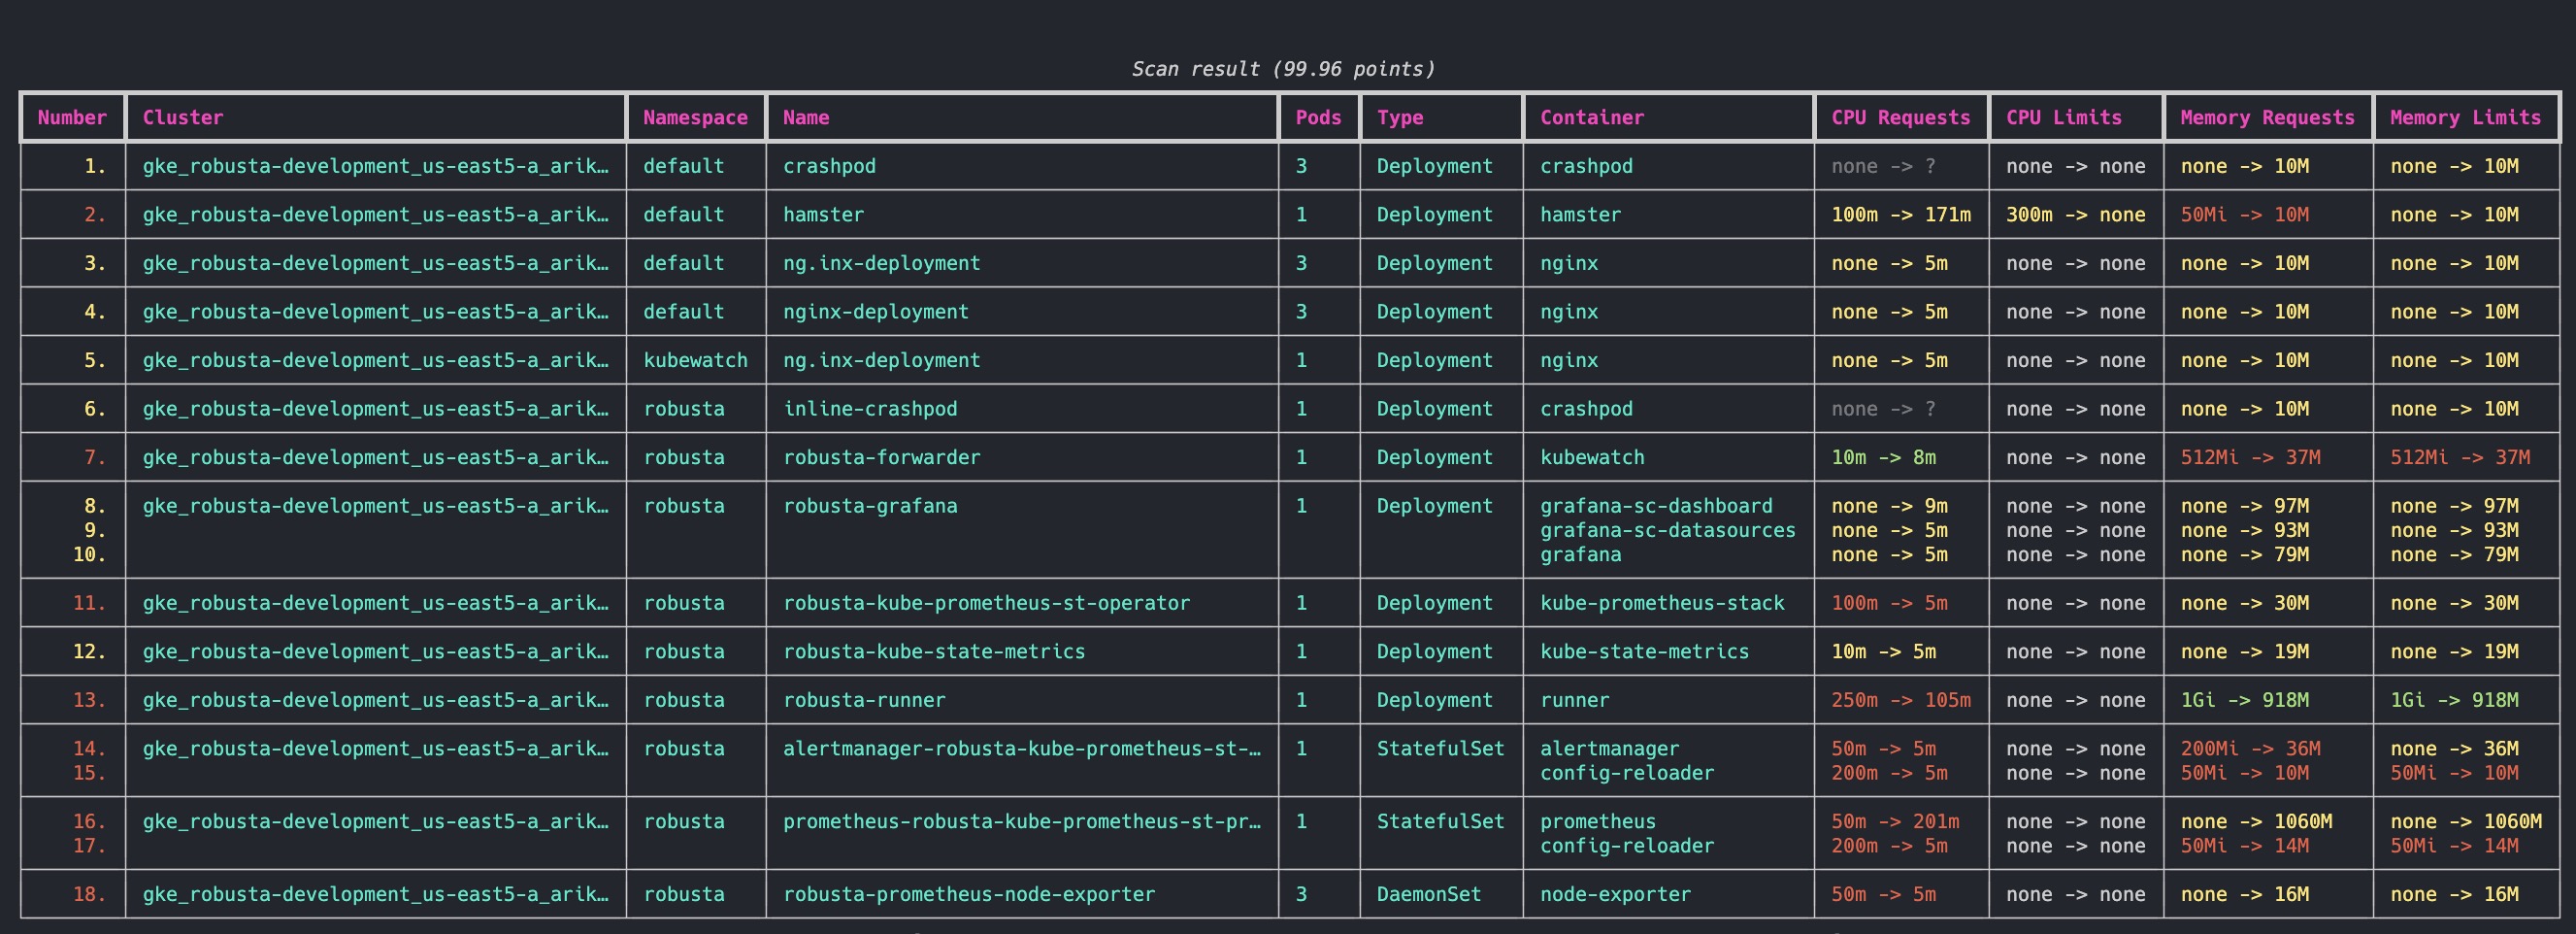
Robusta KRR (Kubernetes Resource Recommender) is a CLI tool for optimizing resource allocation in Kubernetes clusters. It gathers pod usage data from Prometheus and recommends requests and limits for CPU and memory. This reduces costs and improves performance.
Supports: Prometheus, Thanos, Victoria Metrics, EKS, Azure, Coralogix and Grafana Cloud
- No Agent Required: Run a CLI tool on your local machine for immediate results. (Or run in-cluster for weekly Slack reports.)
- Prometheus Integration: Get recommendations based on the data you already have
- Extensible Strategies: Easily create and use your own strategies for calculating resource recommendations.
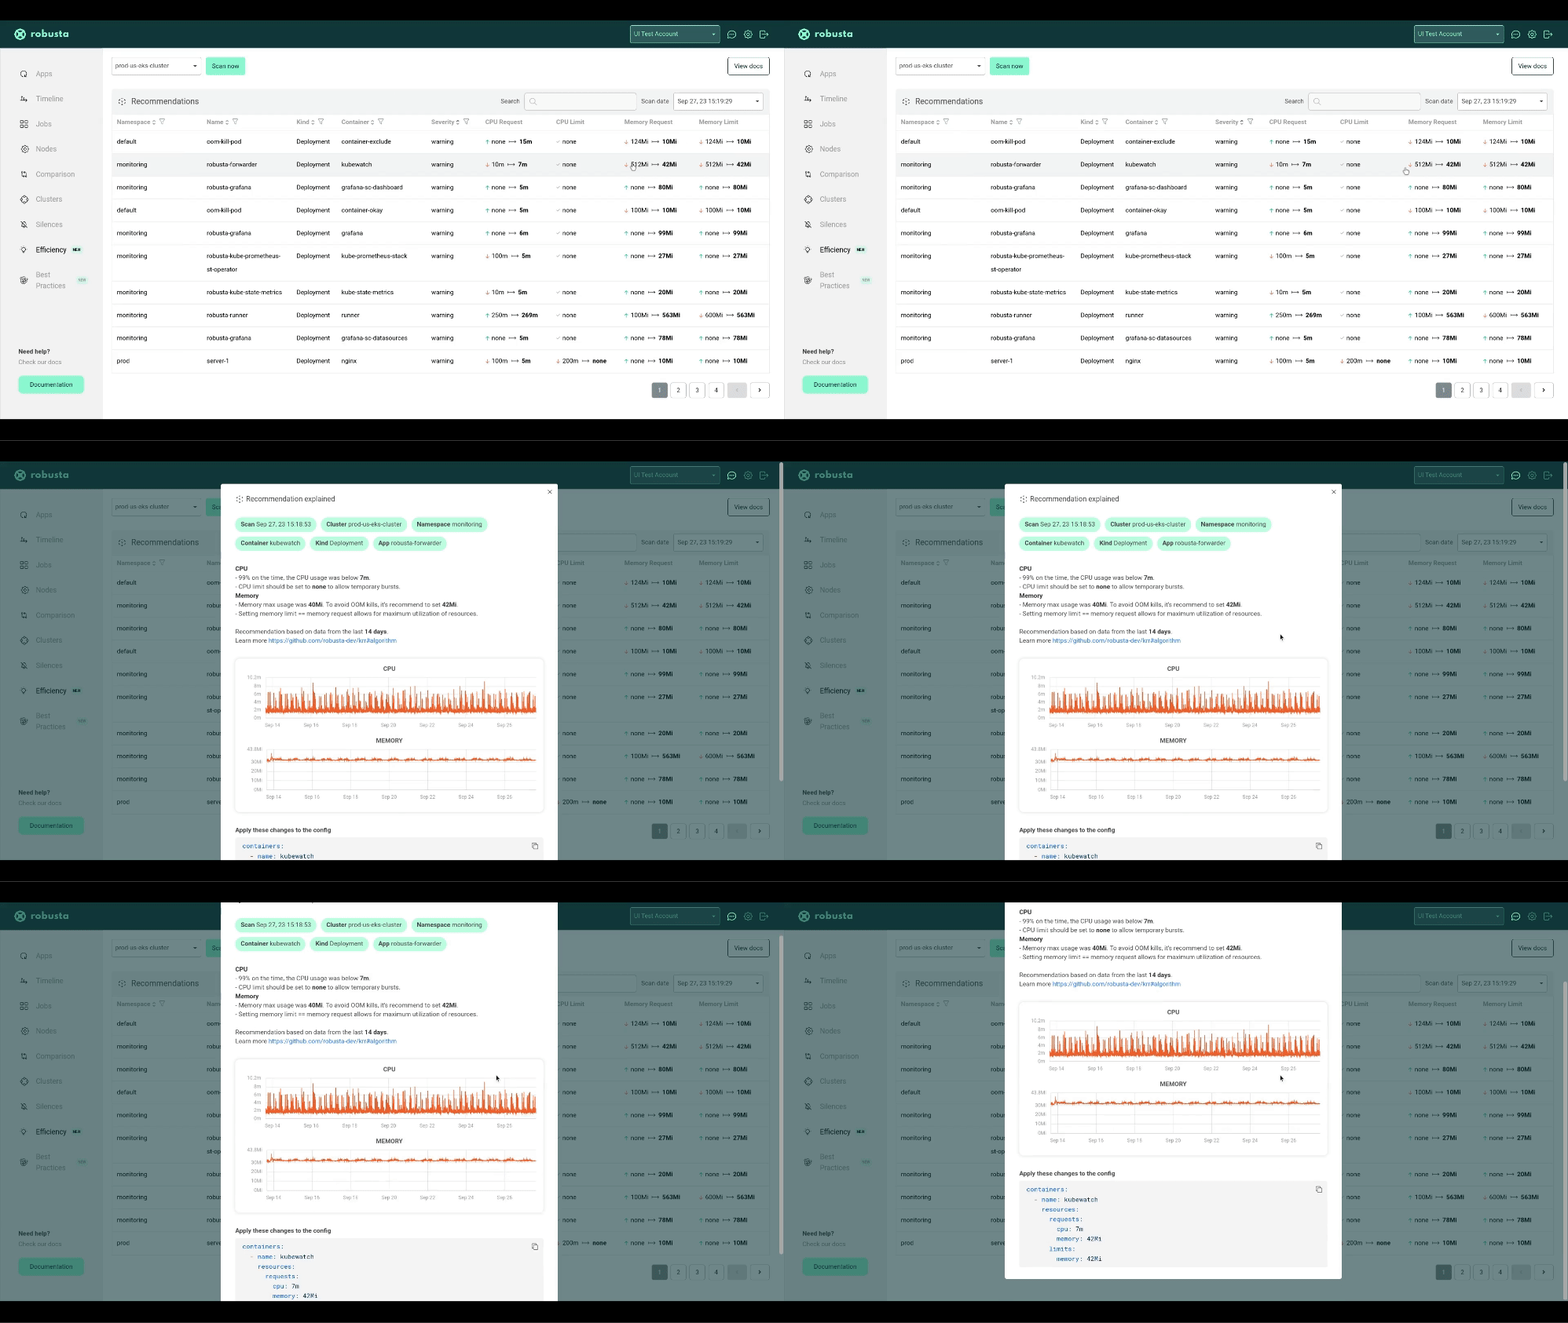
- Free SaaS Platform: See why KRR recommends what it does, by using the free Robusta SaaS platform.
- Future Support: Upcoming versions will support custom resources (e.g. GPUs) and custom metrics.
According to a recent Sysdig study, on average, Kubernetes clusters have:
- 69% unused CPU
- 18% unused memory
By right-sizing your containers with KRR, you can save an average of 69% on cloud costs.
Read more about how KRR works and KRR vs Kubernetes VPA
KRR requires you to have Prometheus.
Additionally to that, kube-state-metrics needs to be running on your cluster, as KRR is dependant on those metrics:
container_cpu_usage_seconds_totalcontainer_memory_working_set_byteskube_replicaset_ownerkube_pod_ownerkube_pod_status_phase
Note: If one of last three metrics is absent KRR will still work, but it will only consider currently-running pods when calculating recommendations. Historic pods that no longer exist in the cluster will not be taken into consideration.
- Add our tap:
brew tap robusta-dev/homebrew-krr- Install KRR:
brew install krr- Check that installation was successfull (First launch might take a little longer):
krr --helpYou can install using brew (see above) on WSL2, or install manually.
- Make sure you have Python 3.9 (or greater) installed
- Clone the repo:
git clone https://github.com/robusta-dev/krr- Navigate to the project root directory (
cd ./krr) - Install requirements:
pip install -r requirements.txt- Run the tool:
python krr.py --helpNotice that using source code requires you to run as a python script, when installing with brew allows to run krr.
All above examples show running command as krr ..., replace it with python krr.py ... if you are using a manual installation.
- View KRR Reports in a Web UI
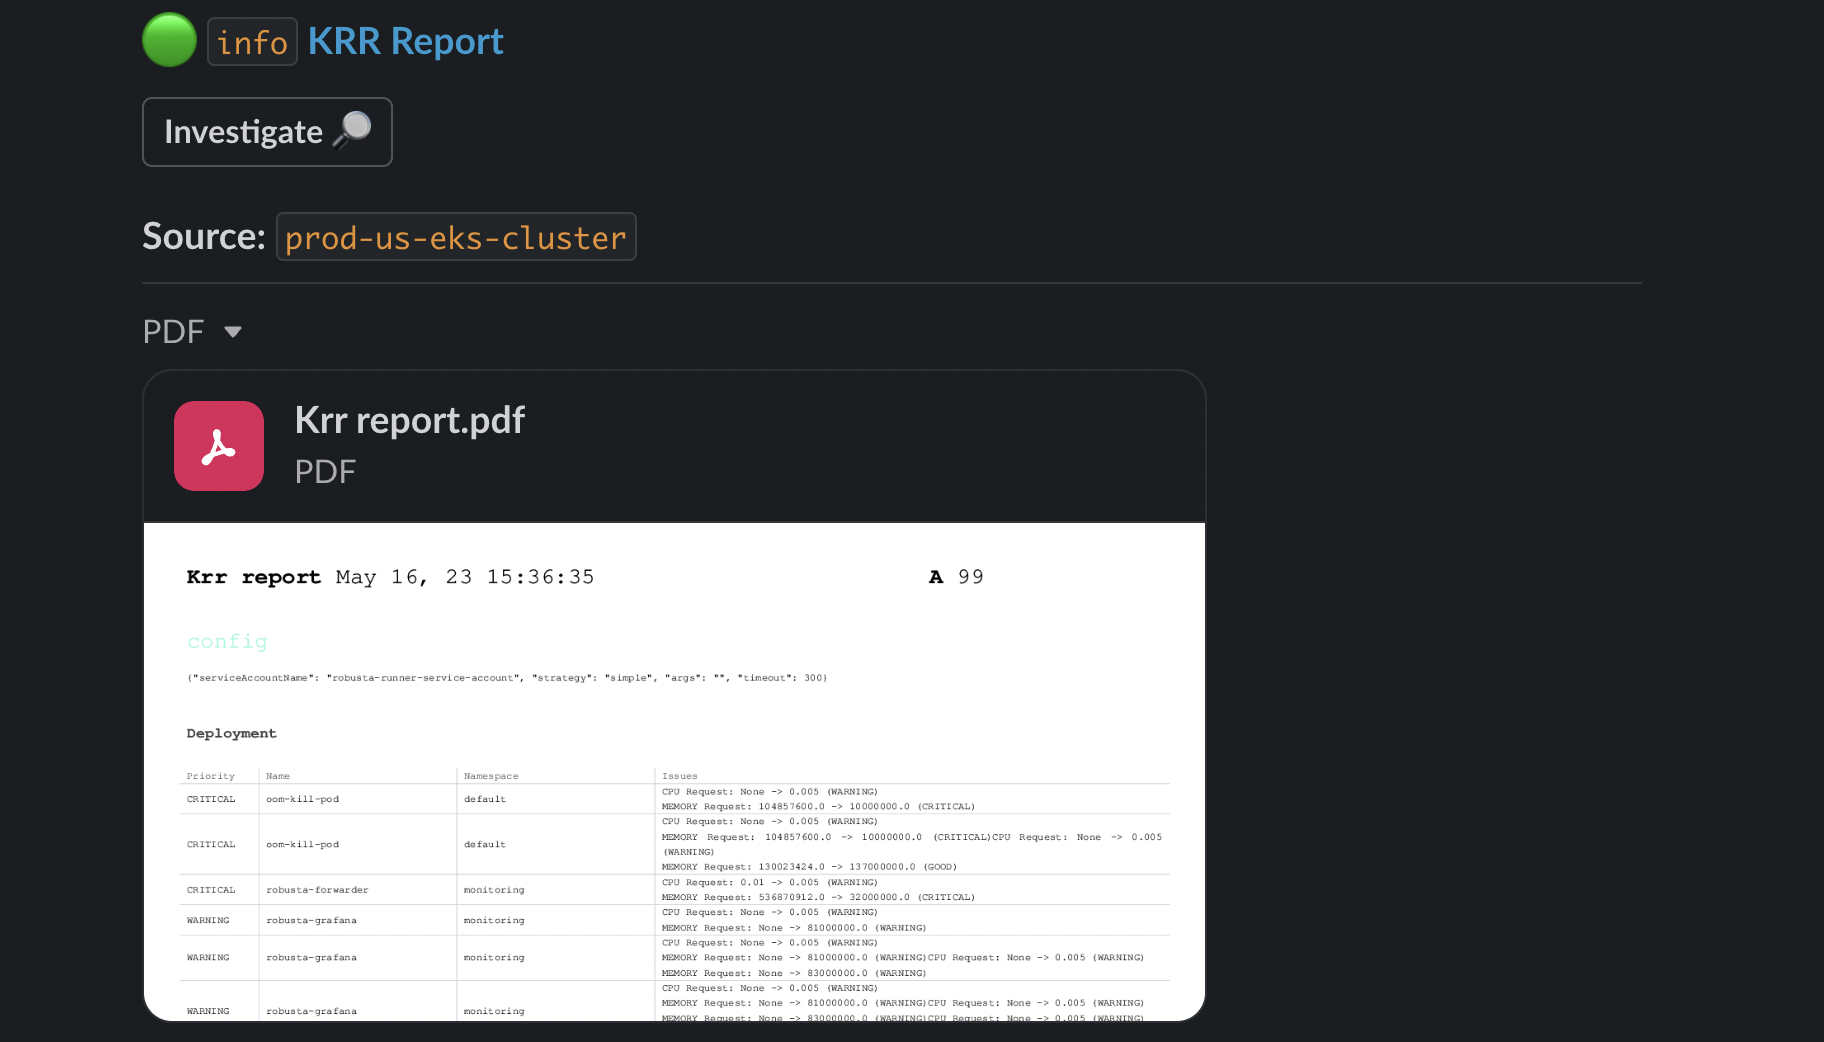
- Get a Weekly Message in Slack with KRR Recommendations
- Setup KRR on Google Cloud Managed Prometheus
- Setup KRR for Azure managed Prometheus
Straightforward usage, to run the simple strategy:
krr simpleIf you want only specific namespaces (default and ingress-nginx):
krr simple -n default -n ingress-nginxFiltering by labels (more info here):
python krr.py simple --selector 'app.kubernetes.io/instance in (robusta, ingress-nginx)'By default krr will run in the current context. If you want to run it in a different context:
krr simple -c my-cluster-1 -c my-cluster-2If you want to get the output in JSON format (--logtostderr is required so no logs go to the result file):
krr simple --logtostderr -f json > result.jsonIf you want to get the output in YAML format:
krr simple --logtostderr -f yaml > result.yamlIf you want to see additional debug logs:
krr simple -vOther helpful flags:
--cpu-minSets the minimum recommended cpu value in millicores--mem-minSets the minimum recommended memory value in MB--history_durationThe duration of the prometheus history data to use (in hours)
More specific information on Strategy Settings can be found using
krr simple --helpWith the free Robusta SaaS platform you can:
- See why KRR recommends what it does
- Sort and filter recommendations by namespace, priority, and more
- Copy a YAML snippet to fix the problems KRR finds
Robusta KRR uses the following Prometheus queries to gather usage data:
-
CPU Usage:
sum(irate(container_cpu_usage_seconds_total{{namespace="{object.namespace}", pod="{pod}", container="{object.container}"}}[{step}])) -
Memory Usage:
sum(container_memory_working_set_bytes{job="kubelet", metrics_path="/metrics/cadvisor", image!="", namespace="{object.namespace}", pod="{pod}", container="{object.container}"})
Need to customize the metrics? Tell us and we'll add support.
Get a free breakdown of KRR recommendations in the Robusta SaaS.
By default, we use a simple strategy to calculate resource recommendations. It is calculated as follows (The exact numbers can be customized in CLI arguments):
-
For CPU, we set a request at the 99th percentile with no limit. Meaning, in 99% of the cases, your CPU request will be sufficient. For the remaining 1%, we set no limit. This means your pod can burst and use any CPU available on the node - e.g. CPU that other pods requested but aren’t using right now.
-
For memory, we take the maximum value over the past week and add a 5% buffer.
Find about how KRR tries to find the default prometheus to connect here.
| Feature 🛠️ | Robusta KRR 🚀 | Kubernetes VPA 🌐 |
|---|---|---|
| Resource Recommendations 💡 | ✅ CPU/Memory requests and limits | ✅ CPU/Memory requests and limits |
| Installation Location 🌍 | ✅ Not required to be installed inside the cluster, can be used on your own device, connected to a cluster | ❌ Must be installed inside the cluster |
| Workload Configuration 🔧 | ✅ No need to configure a VPA object for each workload | ❌ Requires VPA object configuration for each workload |
| Immediate Results ⚡ | ✅ Gets results immediately (given Prometheus is running) | ❌ Requires time to gather data and provide recommendations |
| Reporting 📊 | ✅ Detailed CLI Report, web UI in Robusta.dev | ❌ Not supported |
| Extensibility 🔧 | ✅ Add your own strategies with few lines of Python | |
| Custom Metrics 📏 | 🔄 Support in future versions | ❌ Not supported |
| Custom Resources 🎛️ | 🔄 Support in future versions (e.g., GPU) | ❌ Not supported |
| Explainability 📖 | 🔄 Support in future versions (Robusta will send you additional graphs) | ❌ Not supported |
| Autoscaling 🔀 | 🔄 Support in future versions | ✅ Automatic application of recommendations |
Put cost savings on autopilot. Get notified in Slack about recommendations above X%. Send a weekly global report, or one report per team.
- A Slack workspace
- Install Robusta with Helm to your cluster and configure slack
- Create your KRR slack playbook by adding the following to
generated_values.yaml:
customPlaybooks:
# Runs a weekly krr scan on the namespace devs-namespace and sends it to the configured slack channel
customPlaybooks:
- triggers:
  - on_schedule:
      fixed_delay_repeat:
        repeat: -1 # number of times to run or -1 to run forever
        seconds_delay: 604800 # 1 week
  actions:
  - krr_scan:
      args: "--namespace devs-namespace" ## KRR args here
  sinks:
      - "main_slack_sink" # slack sink you want to send the report to here
- Do a Helm upgrade to apply the new values:
helm upgrade robusta robusta/robusta --values=generated_values.yaml --set clusterName=<YOUR_CLUSTER_NAME>
By default, KRR will try to auto-discover the running Prometheus Victoria Metrics and Thanos. For discovering prometheus it scan services for those labels:
"app=kube-prometheus-stack-prometheus"
"app=prometheus,component=server"
"app=prometheus-server"
"app=prometheus-operator-prometheus"
"app=prometheus-msteams"
"app=rancher-monitoring-prometheus"
"app=prometheus-prometheus"
For Thanos its these labels:
"app.kubernetes.io/component=query,app.kubernetes.io/name=thanos",
"app.kubernetes.io/name=thanos-query",
"app=thanos-query",
"app=thanos-querier",
And for Victoria Metrics its the following labels:
"app.kubernetes.io/name=vmsingle",
"app.kubernetes.io/name=victoria-metrics-single",
"app.kubernetes.io/name=vmselect",
"app=vmselect",
If none of those labels result in finding Prometheus, Victoria Metrics or Thanos, you will get an error and will have to pass the working url explicitly (using the -p flag).
If your prometheus is not auto-connecting, you can use kubectl port-forward for manually forwarding Prometheus.
For example, if you have a Prometheus Pod called kube-prometheus-st-prometheus-0, then run this command to port-forward it:
kubectl port-forward pod/kube-prometheus-st-prometheus-0 9090Then, open another terminal and run krr in it, giving an explicit prometheus url:
krr simple -p http://127.0.0.1:9090If your Prometheus monitors multiple clusters we require the label you defined for your cluster in Prometheus.
For example, if your cluster has the Prometheus label cluster: "my-cluster-name" and your prometheus is at url http://my-centralized-prometheus:9090, then run this command:
krr.py simple -p http://my-centralized-prometheus:9090 --prometheus-label cluster -l my-cluster-nameFor Azure managed Prometheus you need to generate an access token, which can be done by running the following command:
# If you are not logged in to Azure, uncomment out the following line
# az login
AZURE_BEARER=$(az account get-access-token --resource=https://prometheus.monitor.azure.com  --query accessToken --output tsv); echo $AZURE_BEARER
Than run the following command with PROMETHEUS_URL substituted for your Azure Managed Prometheus URL:
python krr.py simple --namespace default -p PROMETHEUS_URL --prometheus-auth-header "Bearer $AZURE_BEARER"See here about configuring labels for centralized prometheus
For EKS managed Prometheus you need to add your prometheus link and the flag --eks-managed-prom and krr will automatically use your aws credentials
python krr.py simple -p "https://aps-workspaces.REGION.amazonaws.com/workspaces/..." --eks-managed-promAdditional optional parameters are:
--eks-profile-name PROFILE_NAME_HERE # to specify the profile to use from your config
--eks-access-key ACCESS_KEY # to specify your access key
--eks-secret-key SECRET_KEY # to specify your secret key
--eks-service-name SERVICE_NAME # to use a specific service name in the signature
--eks-managed-prom-region REGION_NAME # to specify the region the prometheus is in
See here about configuring labels for centralized prometheus
For Coralogix managed Prometheus you need to specify your prometheus link and add the flag coralogix_token with your Logs Query Key
python krr.py simple -p "https://prom-api.coralogix..." --coralogix_tokenSee here about configuring labels for centralized prometheus
For Grafana Cloud managed Prometheus you need to specify prometheus link, prometheus user, and an access token of your Grafana Cloud stack. The Prometheus link and user for the stack can be found on the Grafana Cloud Portal. An access token with a metrics:read scope can also be created using Access Policies on the same portal.
Next, run the following command, after setting the values of PROM_URL, PROM_USER, and PROM_TOKEN variables with your Grafana Cloud stack's prometheus link, prometheus user, and access token.
python krr.py simple -p $PROM_URL --prometheus-auth-header "Bearer ${PROM_USER}:${PROM_TOKEN}" --prometheus-ssl-enabledSee here about configuring labels for centralized prometheus
Currently KRR ships with a few formatters to represent the scan data:
table- a pretty CLI table used by default, powered by Rich libraryjsonyamlpprint- data representation from python's pprint library
To run a strategy with a selected formatter, add a -f flag:
krr simple -f jsonLook into the examples directory for examples on how to create a custom strategy/formatter.
We use pytest to run tests.
- Install the project manually (see above)
- Navigate to the project root directory
- Install poetry (https://python-poetry.org/docs/#installing-with-the-official-installer)
- Install dev dependencies:
poetry install --group dev- Install robusta_krr as editable dependency:
pip install -e .- Run the tests:
poetry run pytestContributions are what make the open source community such an amazing place to learn, inspire, and create. Any contributions you make are greatly appreciated.
If you have a suggestion that would make this better, please fork the repo and create a pull request. You can also simply open an issue with the tag "enhancement". Don't forget to give the project a star! Thanks again!
- Fork the Project
- Create your Feature Branch (
git checkout -b feature/AmazingFeature) - Commit your Changes (
git commit -m 'Add some AmazingFeature') - Push to the Branch (
git push origin feature/AmazingFeature) - Open a Pull Request
Distributed under the MIT License. See LICENSE.txt for more information.
If you have any questions, feel free to contact [email protected] or message us on robustacommunity.slack.com


