GPUprobe (GPU probe, GP-uprobe) provides utilities for observability of GPU behavior via their interaction with the Cuda runtime API by leveraging eBPF uprobes.
GPU monitoring and debugging traditionally requires either heavyweight profiling tools like Nsight (which significantly impacts performance), or high-level monitoring solutions like DCGM (which lack granular insights into application behavior). This creates a gap for developers who need detailed GPU runtime information without the overhead of full profiling or code instrumentation.
GPUprobe fills this gap by leveraging eBPF to provide:
- Real-time memory leak detection at the CUDA runtime level
- Kernel launch frequency tracking
- Memory bandwidth utilization metrics
The key advantage of GPUprobe's approach is that it requires zero modification to existing code bases. Whether you're running production ML pipelines, handling complex GPU computations, or debugging CUDA applications, GPUprobe can monitor multiple running processes calling the CUDA runtime API and provide granular insights without any changes to your CUDA kernels or application code.
By hooking directly into the CUDA runtime API through eBPF uprobes, GPUprobe maintains a lightweight footprint while still offering detailed observability into GPU behavior - making it suitable for both development and production environments.
This repository provides the source code for gpuprobe-daemon - a lightweight
binary that implements these capabilities. While the project is experimental,
it already offers several powerful features described below.
For information on building and running, refer to the short guide on the subject.
Usage: gpu_probe [OPTIONS]

Options:
      --memleak
          Attaches memleak program: detects leaking calls to cudaMalloc from the CUDA runtime API
      --cudatrace
          Attaches the cudatrace program: maintains per-process histograms of cuda kernel launches and their frequencies
      --bandwidth-util
          Attaches the bandwidth util program: approximates bandwidth utilization of cudaMemcpy
      --metrics-addr <METRICS_ADDR>
          Address for the Prometheus metrics endpoint [default: 0.0.0.0:9000]
      --display-interval <DISPLAY_INTERVAL>
          Interval in seconds for displaying metrics to stdout [default: 5]
      --libcudart-path <LIBCUDART_PATH>
          The path of the libcudart.so dynamic lib that is monitored [default: /usr/local/cuda/lib64/libcudart.so]
  -h, --help
          Print help
  -V, --version
          Print version
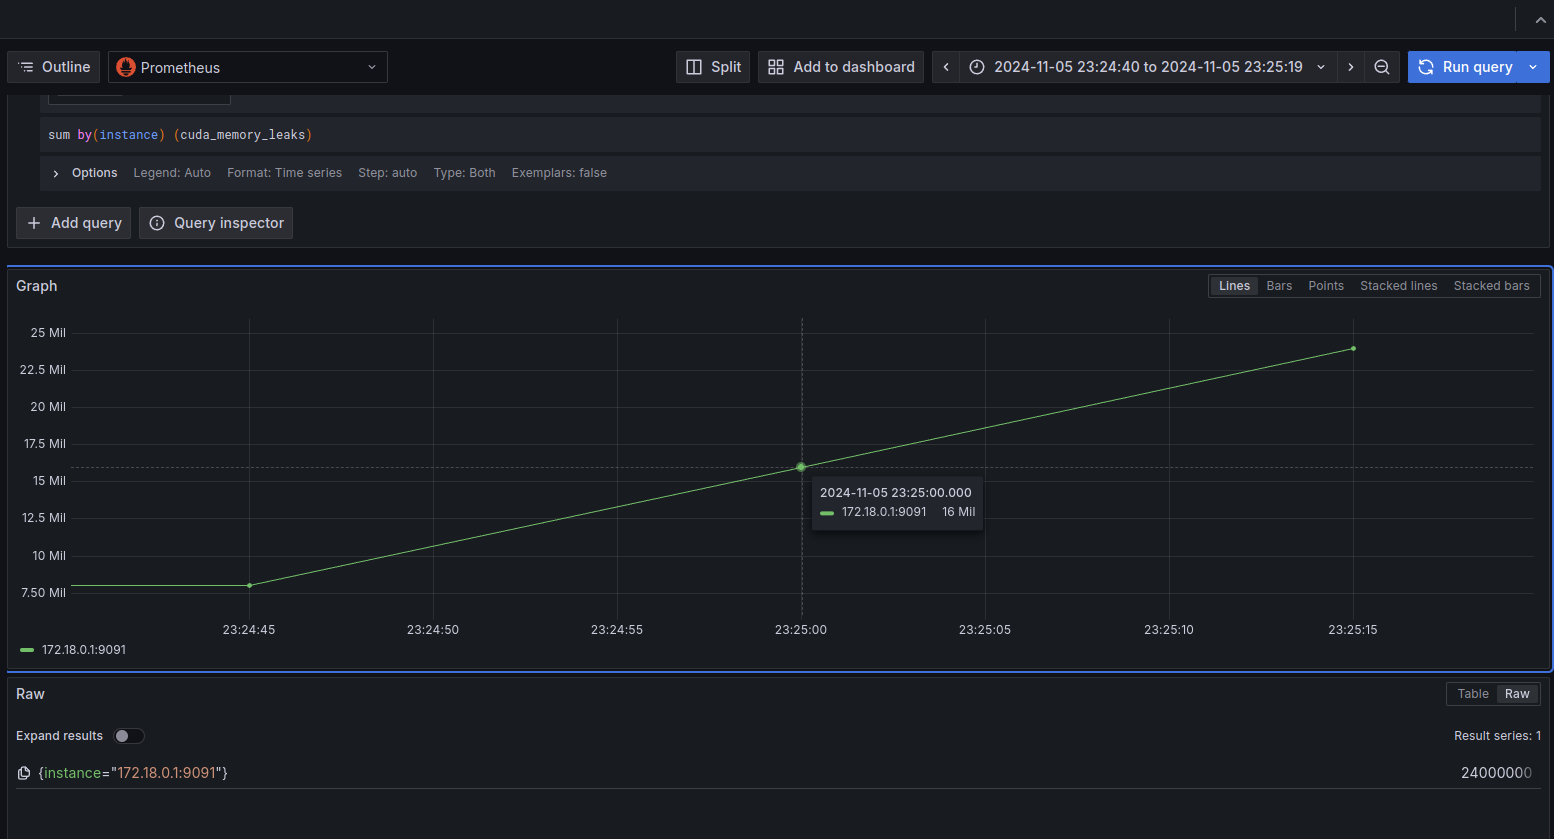
Metrics are exported in OpenMetrics format via an http handler, which is intended to be scraped by Prometheus. This allows for seamless integration with your favorite observability stack, e.g. Grafana.
These metrics are also displayed periodically to stdout.
2024-12-12 16:32:46

num_successful_mallocs:  6
num_failed_mallocs:      0
num_successful_frees:    2
num_failed_frees:        0
per-process memory maps:
process 365159
        0x0000793a44000000: 8000000 Bytes
        0x0000793a48c00000: 8000000 Bytes
        0x0000793a49400000: 8000000 Bytes
process 365306
        0x000078fd20000000: 8000000 Bytes
        0x000078fd24c00000: 0 Bytes
        0x000078fd25400000: 0 Bytes

total kernel launches: 1490
pid: 365306
        0x5823e39efa50 (unknown kernel) -> 10
        0x5823e39efb30 (unknown kernel) -> 10
pid: 365159
        0x5de98f9fba50 (_Z27optimized_convolution_part1PdS_i) -> 735
        0x5de98f9fbb30 (_Z27optimized_convolution_part2PdS_i) -> 735
The various features are opt-in via command-line arguments passed to the program at launch.
E.g. running gpuprobe --memleak will only attach the uprobes needed for
the memleak feature, and only display/export relevant metrics.
This utility correlates a call to cudaFree() to the associated call to
cudaMalloc(), allowing for a measurement of the number of leaked bytes
related to a Cuda virtual address.
This utility keeps stats on the launched kernels and number of times that they
were launched as a pair (func_addr, count). It can be thought of and
aggregated as a histogram of the frequencies of kernel launches.
This feature approximates bandwidth utilization on the bus between host and
device as a function of execution time and size of a cudaMemcpy() call.
This is computed naively with: throughput = count / (end - start)
Note that this only plausibly works for host-to-device (H2D) and device-to-host (D2H) copies, as only these calls provide any guarantees of synchronicity.
This feature is not yet exported. Below you will find a sample output of an older iteration that simply wrote the results to stdout.
GPUprobe bandwidth_util utility
========================


Traced 1 cudaMemcpy calls
        H2D 3045740550.87548 bytes/sec for 0.00263 secs
========================

Traced 2 cudaMemcpy calls
        H2D 2981869117.56429 bytes/sec for 0.00268 secs
        D2H 3039108386.38160 bytes/sec for 0.00263 secs
========================
An eBPF compatible Linux kernel version is required for running GPUprobe, as
well as bpftool.
A vmlinux.h file is required for the build process, which can be created
by executing the following command from the project root:
bpftool btf dump file /sys/kernel/btf/vmlinux format c > src/bpf/vmlinux.hFollowing that, you should be able to build the project.
cargo buildRoot privileges are required to run the project due to its attaching of eBPF uprobes.
sudo ./gpu_probe # --options