matplotlib backend for blender (backend_blender.py)

if you're curious about bpyplot.py or if you want to try plt.imsave, read the Known Limitations.
- numpy version should be over 0.14.
- matploblib should be downloaded with its dependencies.
Above should be installed into the python packed with blender. To use pip for this python, this stackflow post should be useful.
Place backend_blender.py as a library of blender. This can be done by using the add-on importer.
import matplotlib
matplotlib.use("module://backend_blender")
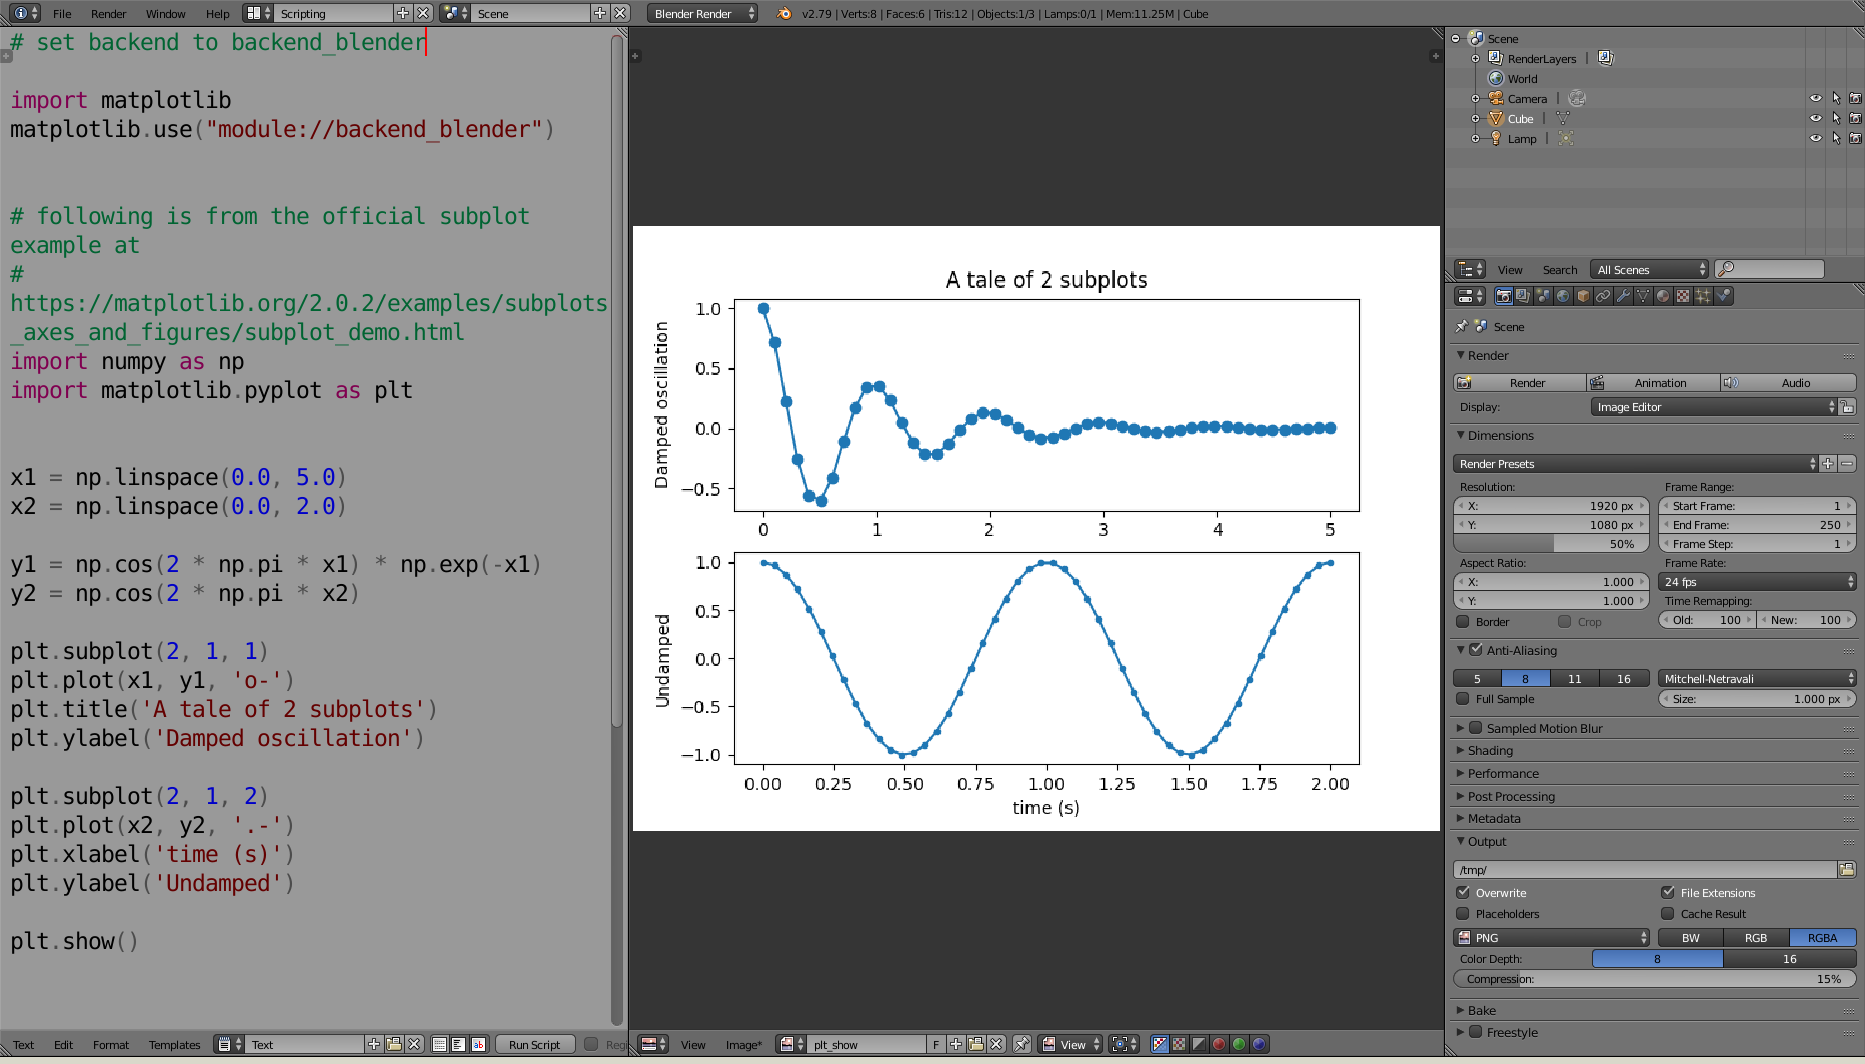
use as always !!! (sample code from official sample)
import numpy as np
import matplotlib.pyplot as plt


x1 = np.linspace(0.0, 5.0)
x2 = np.linspace(0.0, 2.0)

y1 = np.cos(2 * np.pi * x1) * np.exp(-x1)
y2 = np.cos(2 * np.pi * x2)

plt.subplot(2, 1, 1)
plt.plot(x1, y1, 'o-')
plt.title('A tale of 2 subplots')
plt.ylabel('Damped oscillation')

plt.subplot(2, 1, 2)
plt.plot(x2, y2, '.-')
plt.xlabel('time (s)')
plt.ylabel('Undamped')

plt.show()plt.imsave causes errors even when plt.savefig works fine. There seems to be no way to remove this error with a simple backend. In order to use such functions, import bpyplot.py as plt, in this repository, instead of matplotlib.pyplot.
You should be able to use other functions in pyplot.
import matplotlib
matplotlib.use("module://backend_blender")

import matploblib.pyplot as plt
plt.plot([1,2,3],[1,2,3])     # works
plt.imsave("temp.png", [[1]]) # fails

import matploblib.bpyplot as plt
plt.plot([1,2,3],[1,2,3])     # should work
plt.imsave("temp.png", [[1]]) # work
plt.show() won't automatically close the already-rendered-image which sometimes causes problems such as strange sizes. This may change in the future, but for now, use plt.close() as a work around.